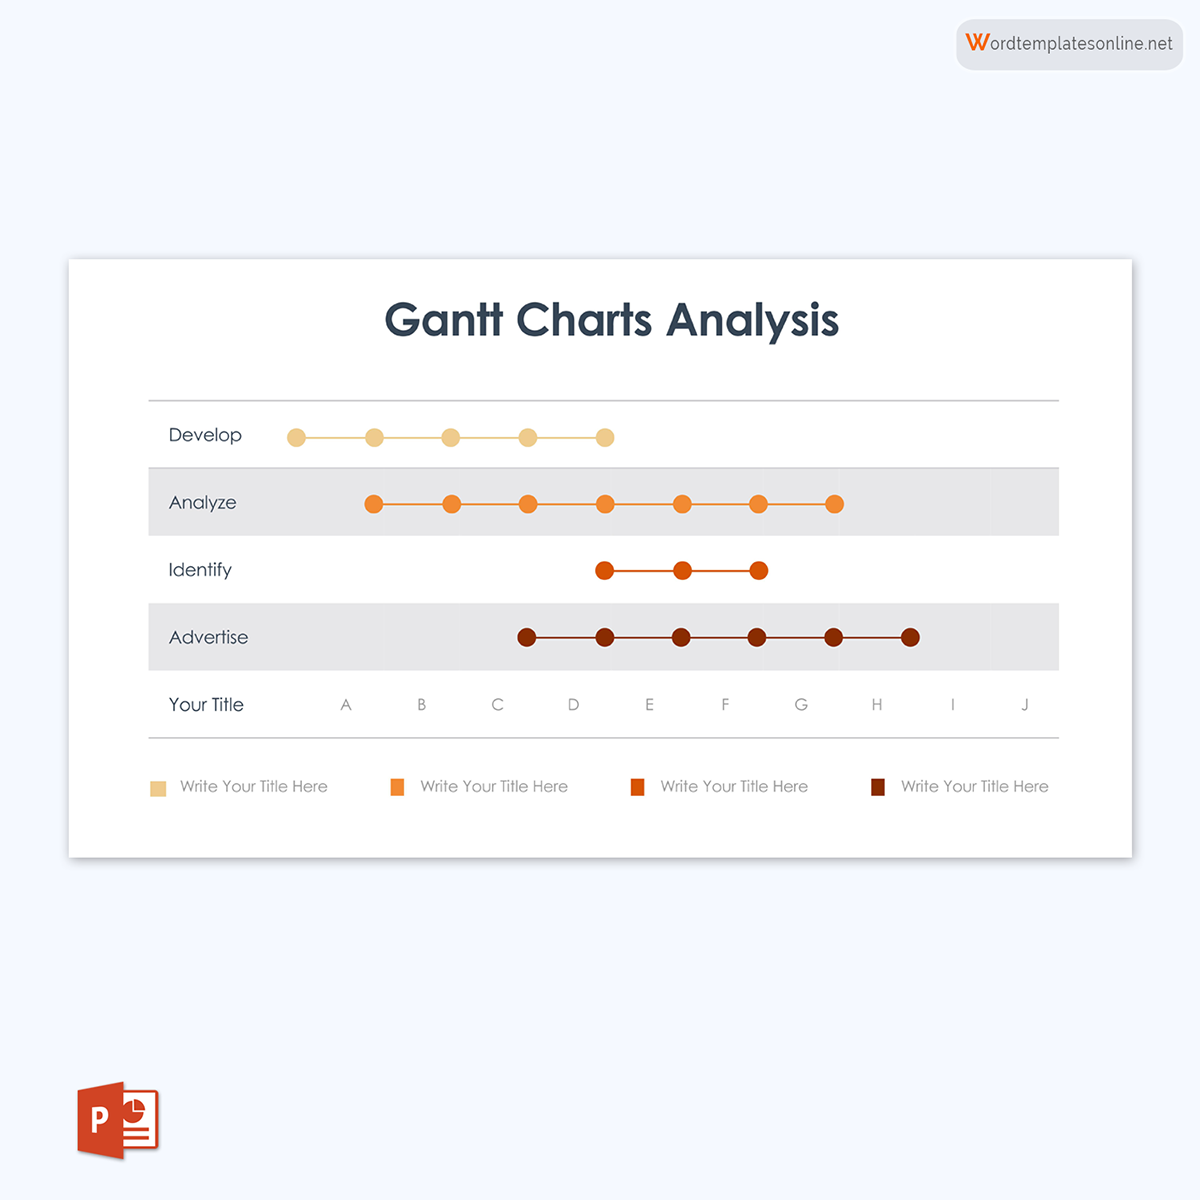
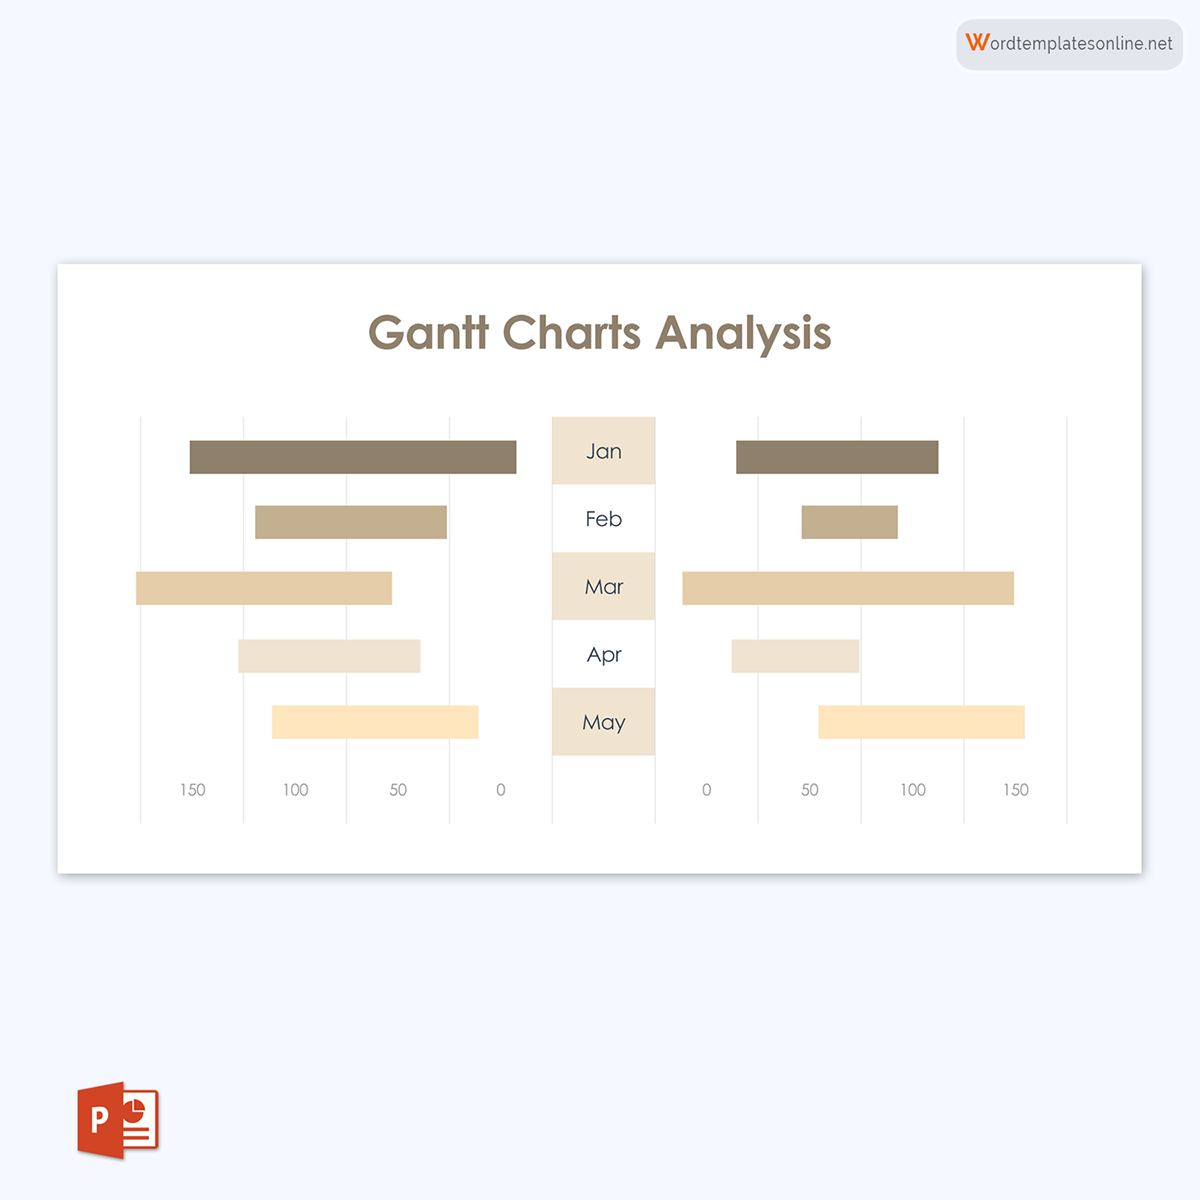
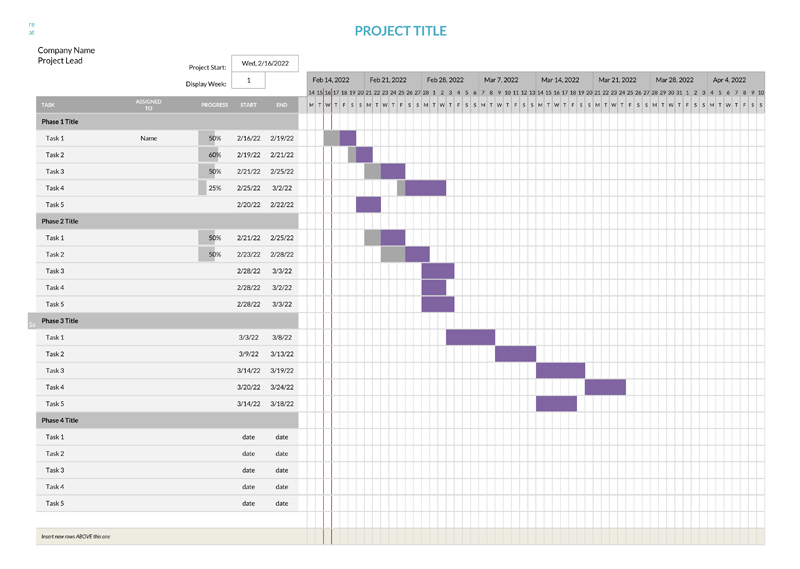
A Gantt chart, also referred to as a Project Bar Chart, is a tabular display that graphically shows the start and finish dates for each task required to complete a project.
Gantt charts illustrate the relationship between the time-phasing of activities and a project schedule. They are commonly used for planning and control purposes, such as when compiling a project activity list, creating a budget, or determining staffing requirements at each project phase.
It is one of the most widely used project management, problem management, scheduling, and business analysis tools. It provides a visual representation of a project schedule, particularly useful for large projects or those involving multiple tasks. They are frequently used with other project management tools, such as work breakdown structures (WBS) and network diagrams. These graphical representations help to show how individual tasks contribute to the completion of a project at both high and grass-roots levels.
They are also an effective means of displaying project milestones or progress. They provide a clear view of how tasks are related to one another in terms of timing, duration, and logical dependencies. They are also helpful in identifying the critical path(s)- the sequence of tasks that results in the shortest total project duration if the schedule is not delayed or extended.
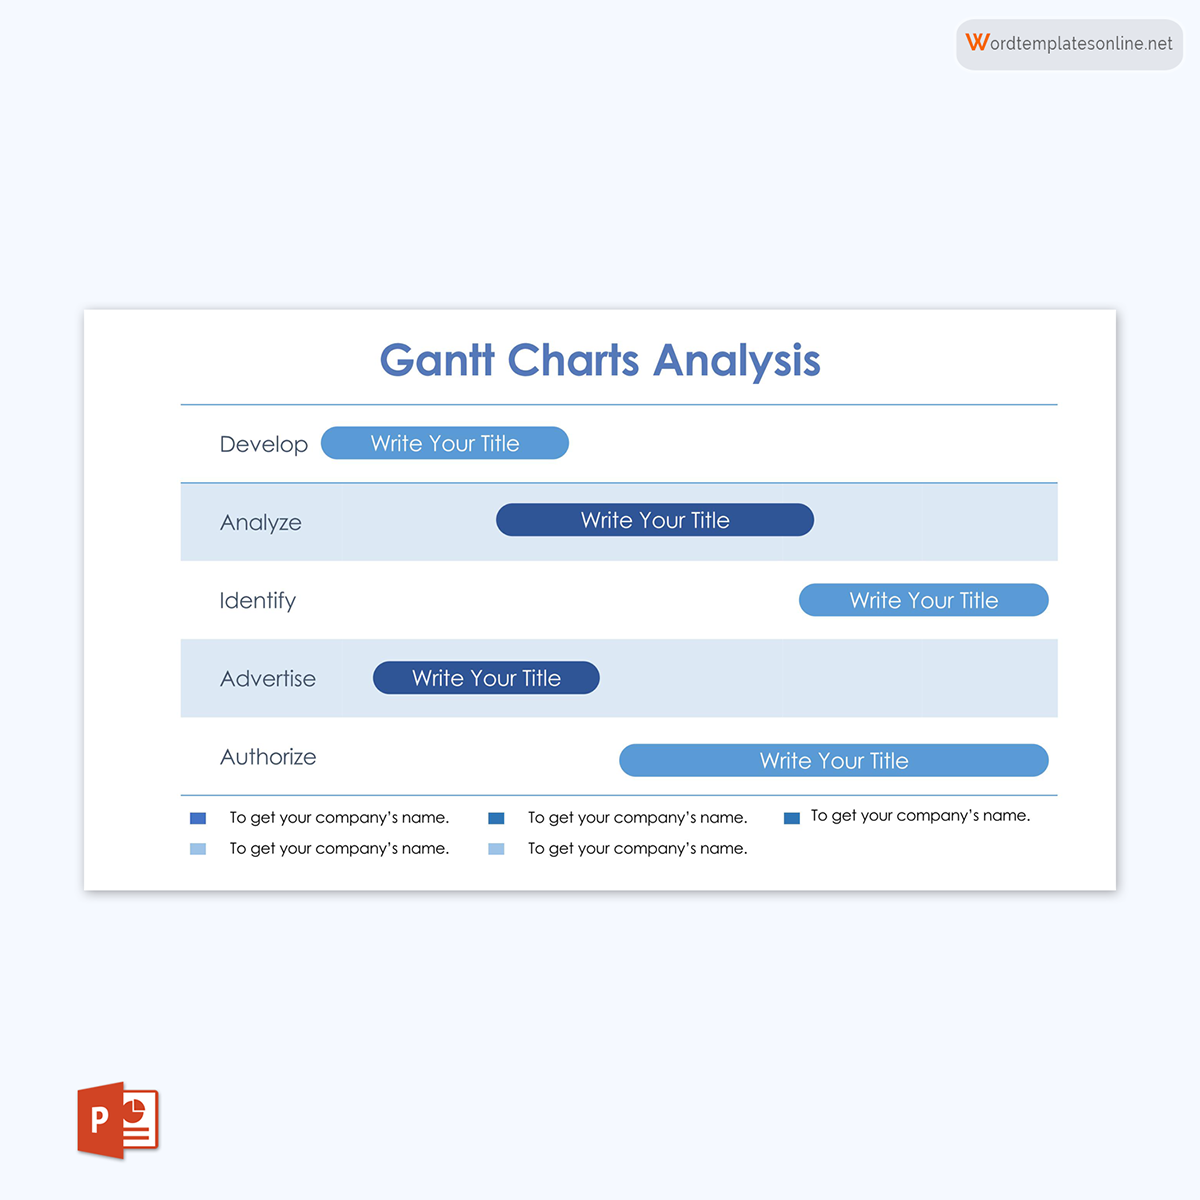
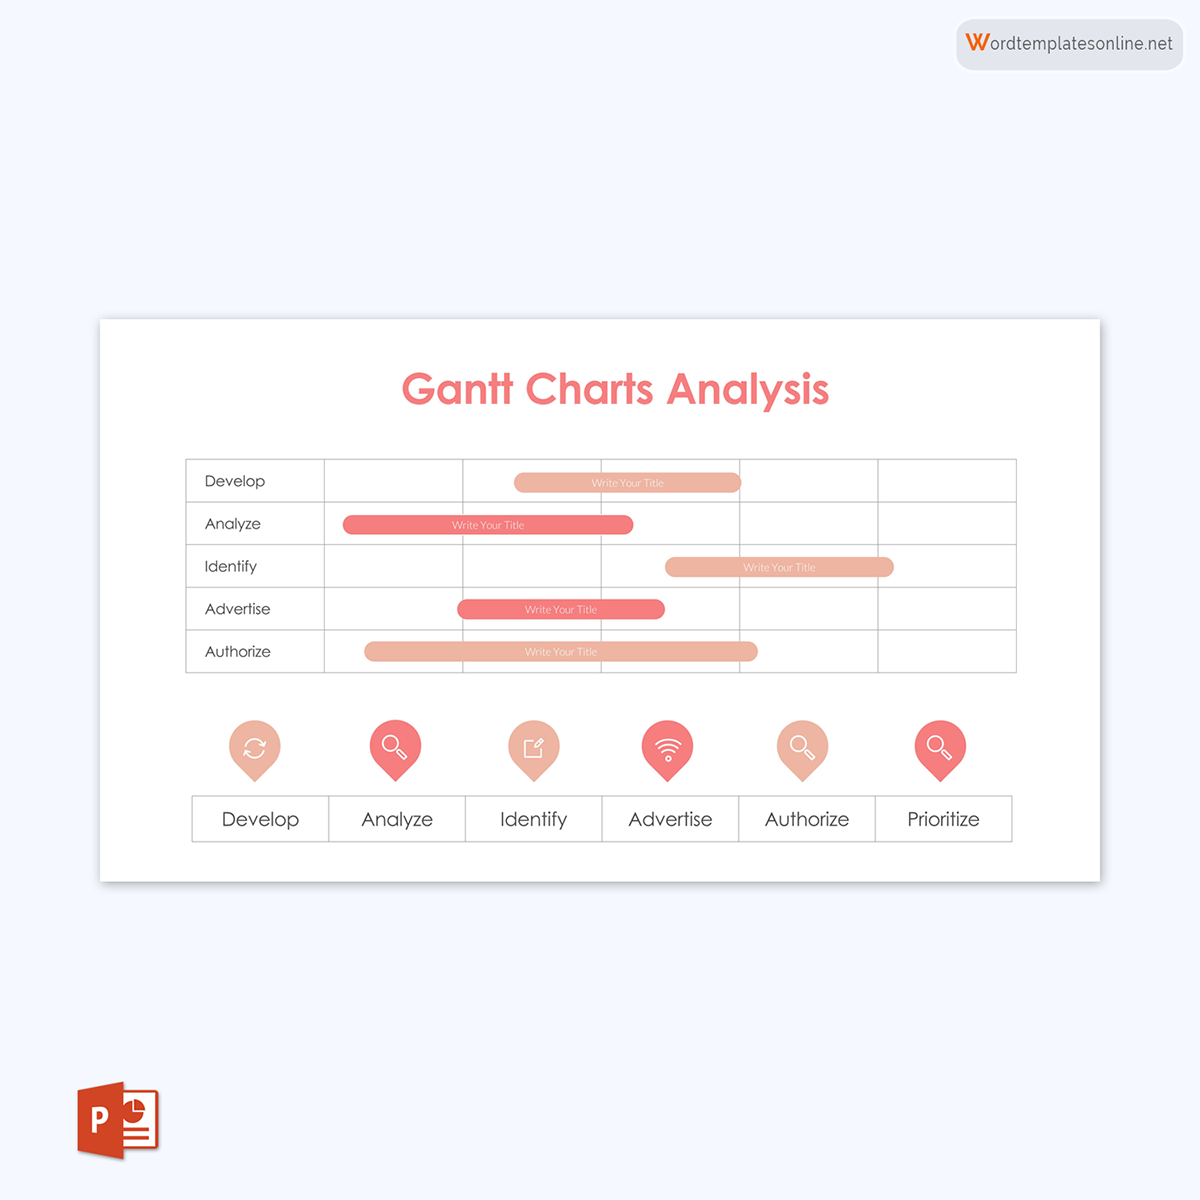
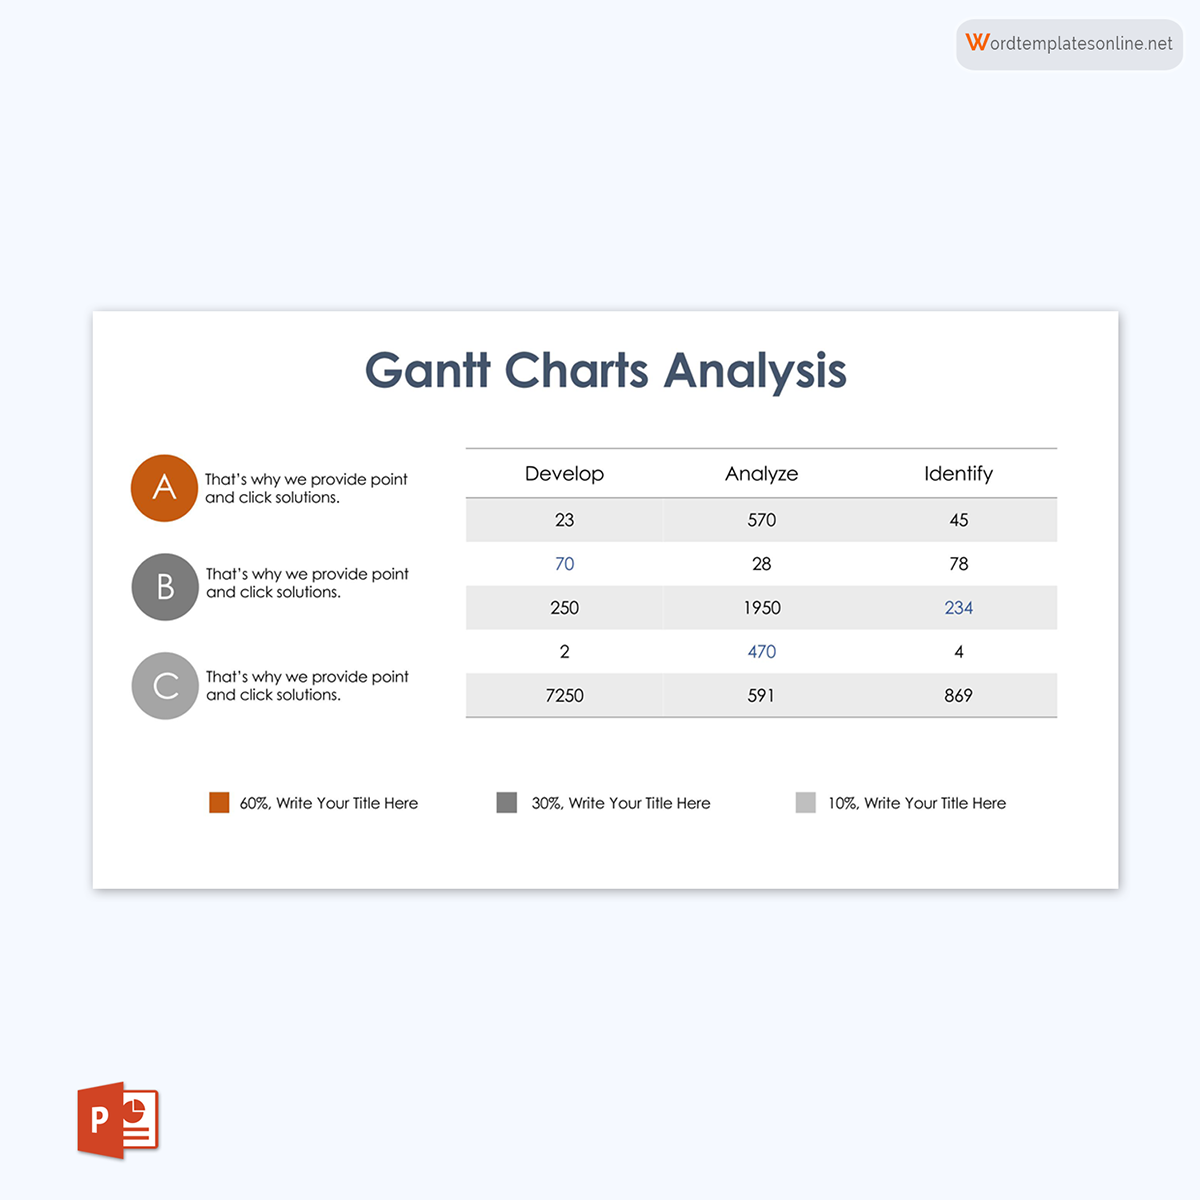
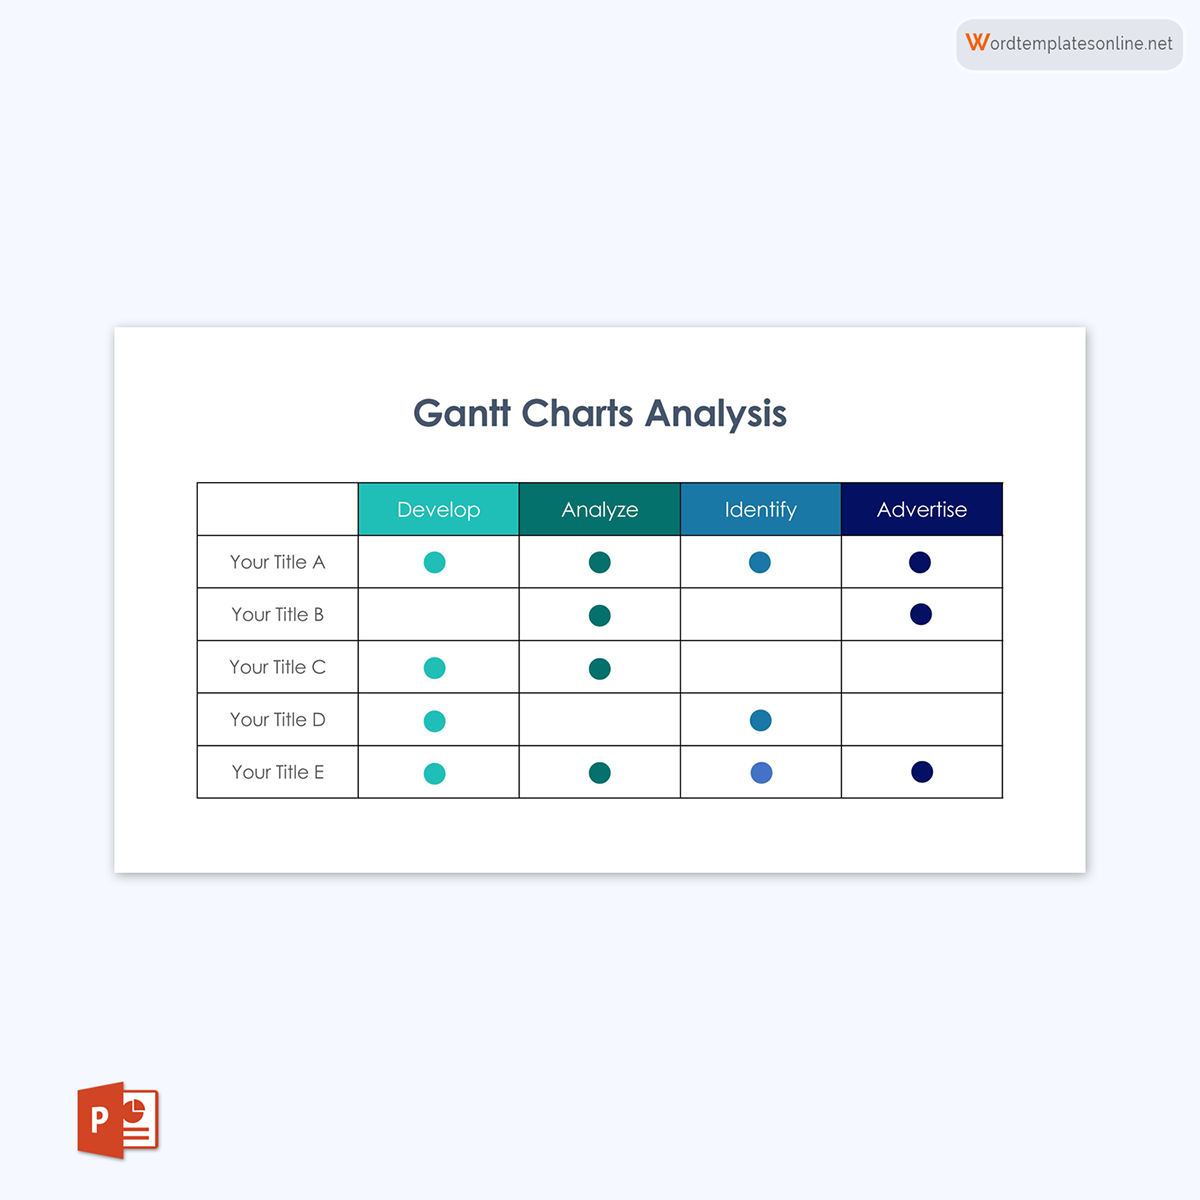
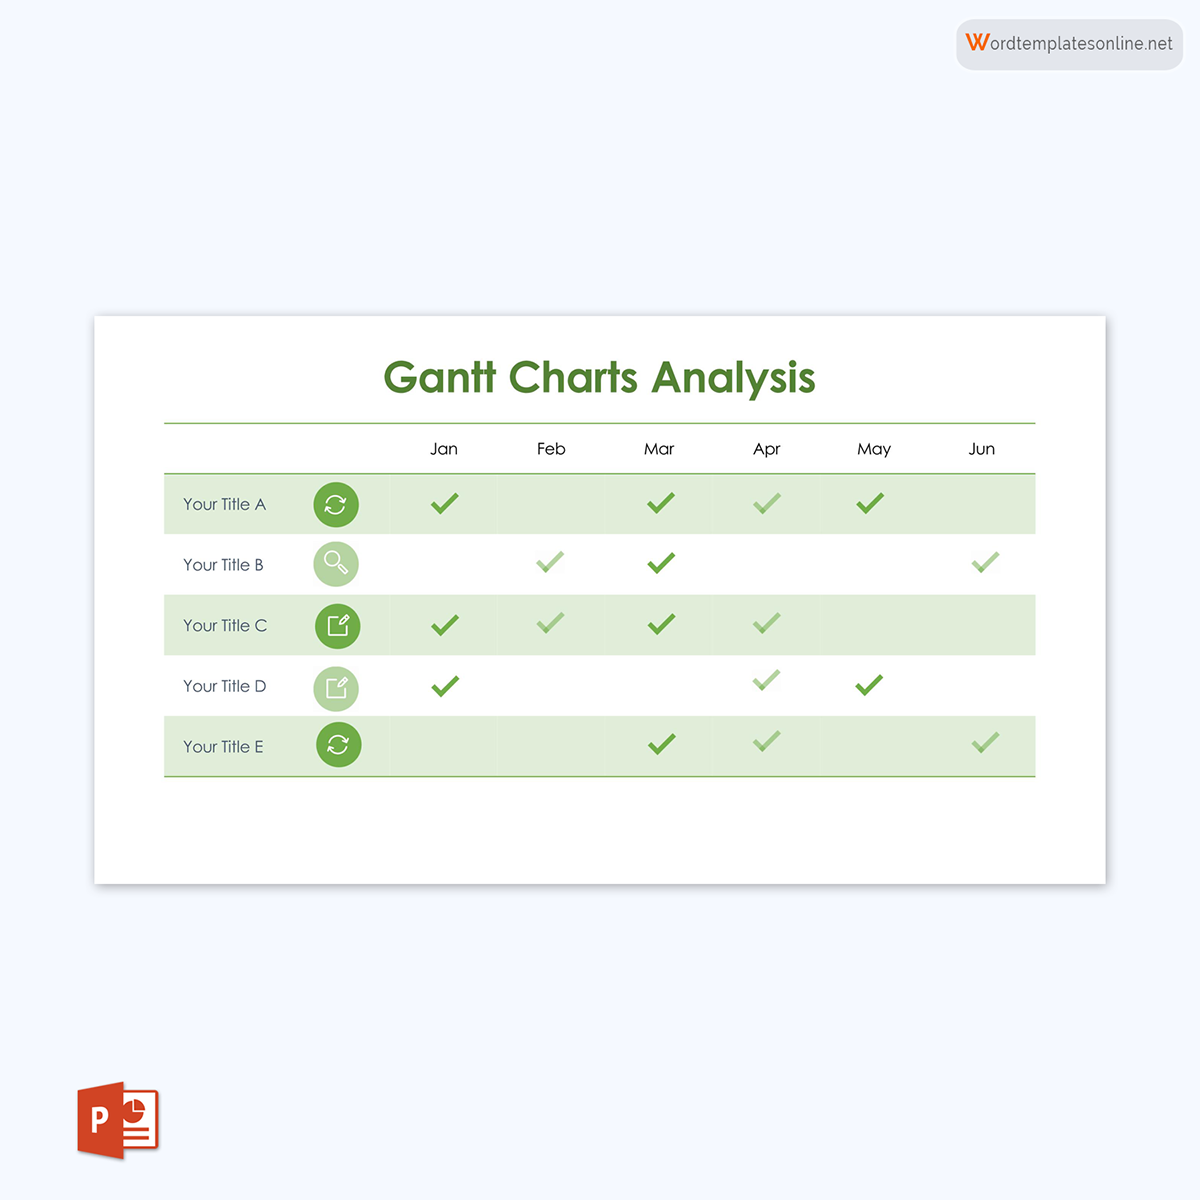
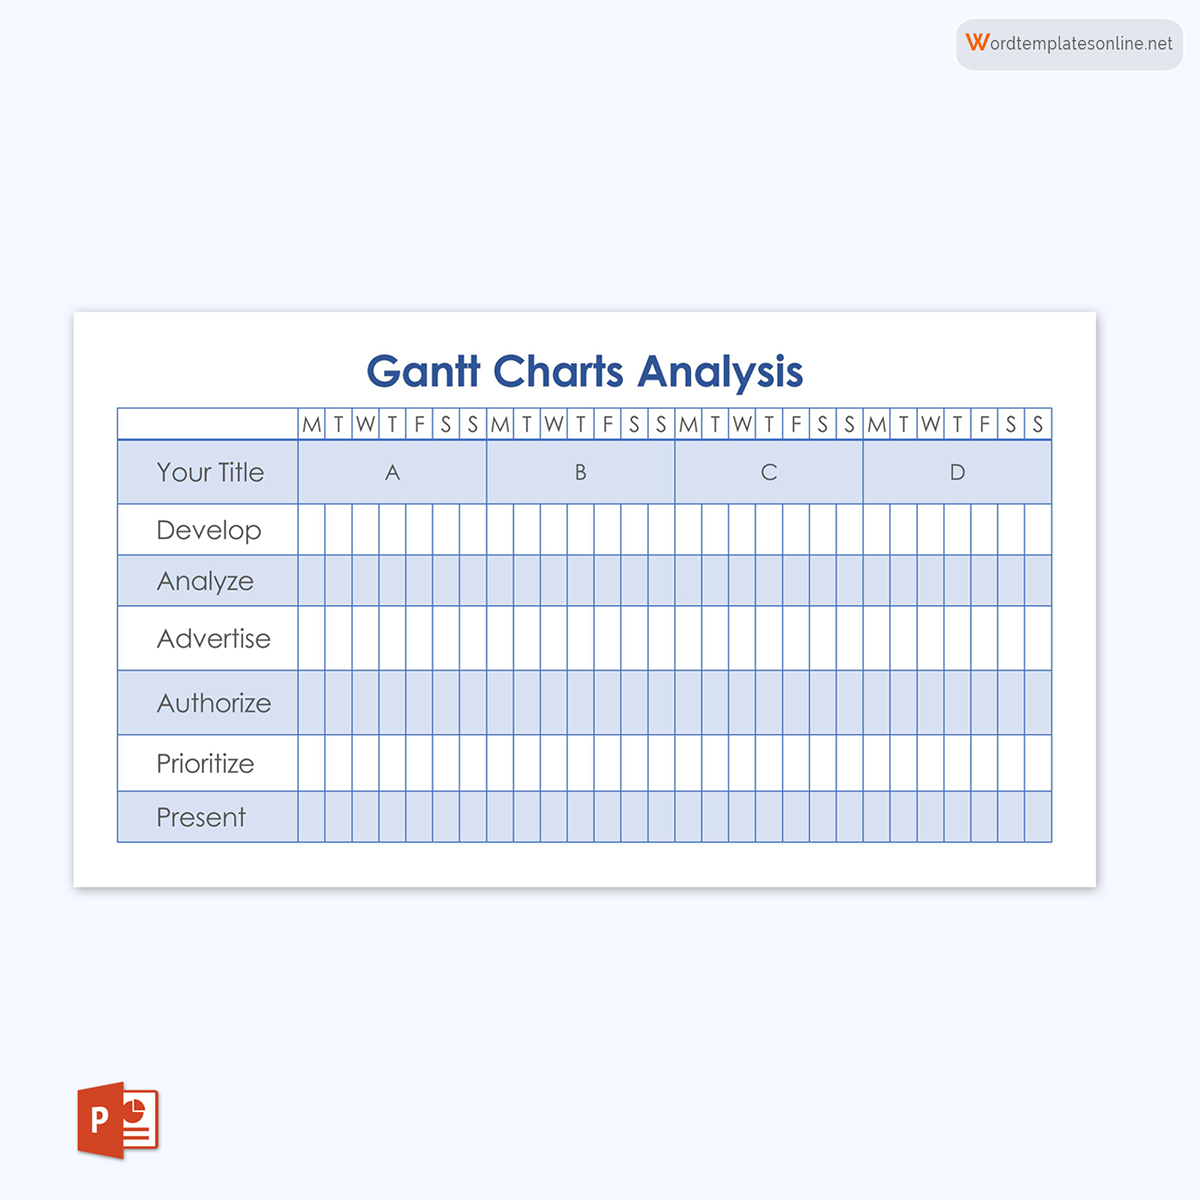
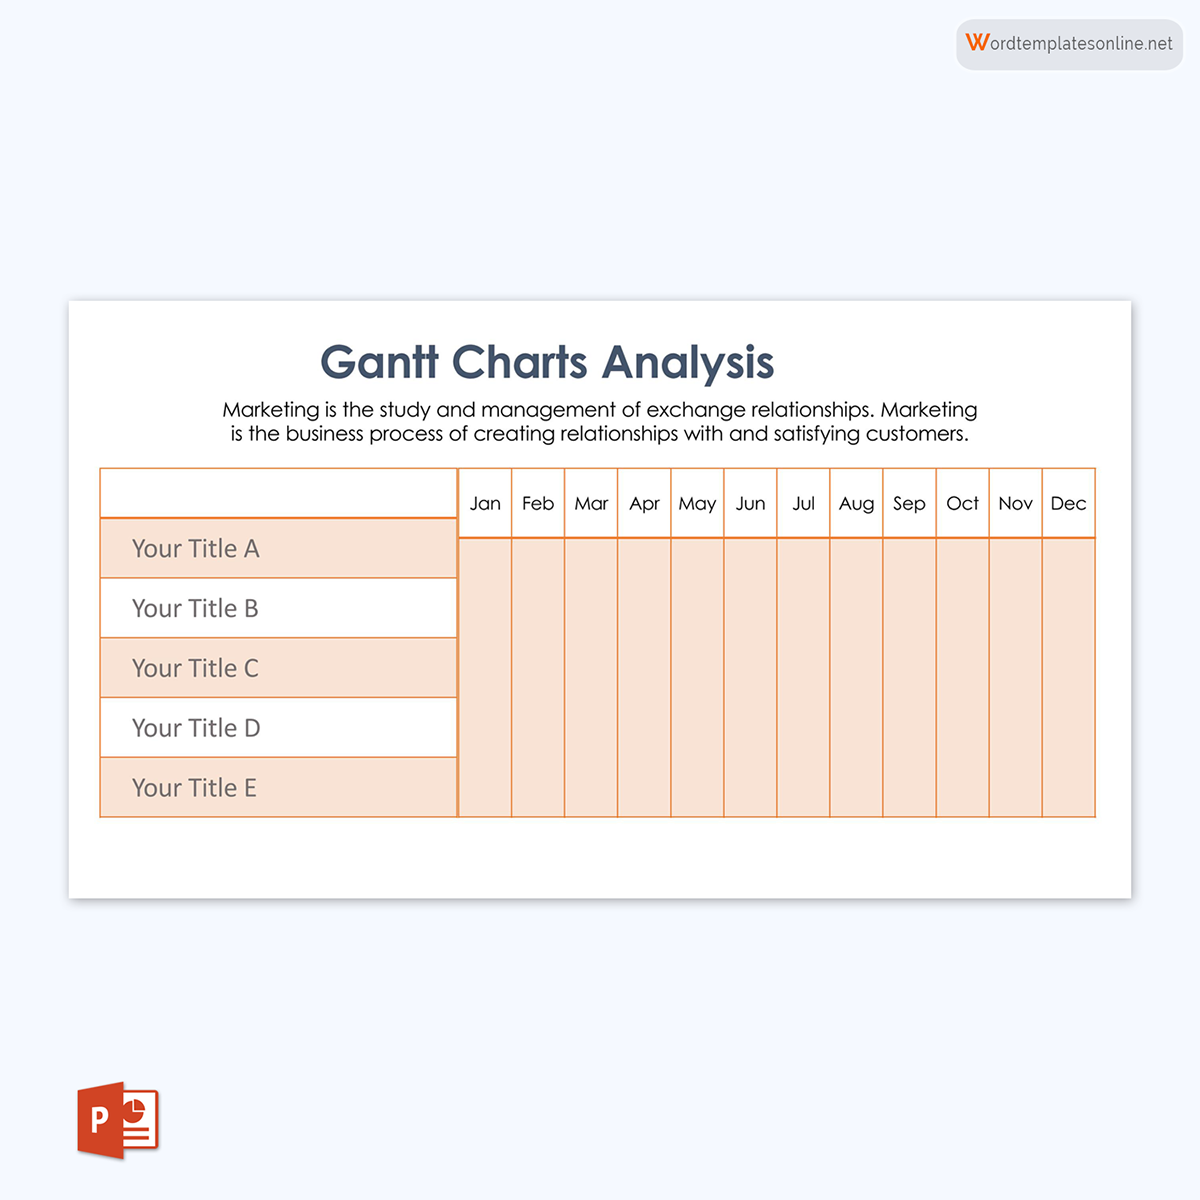
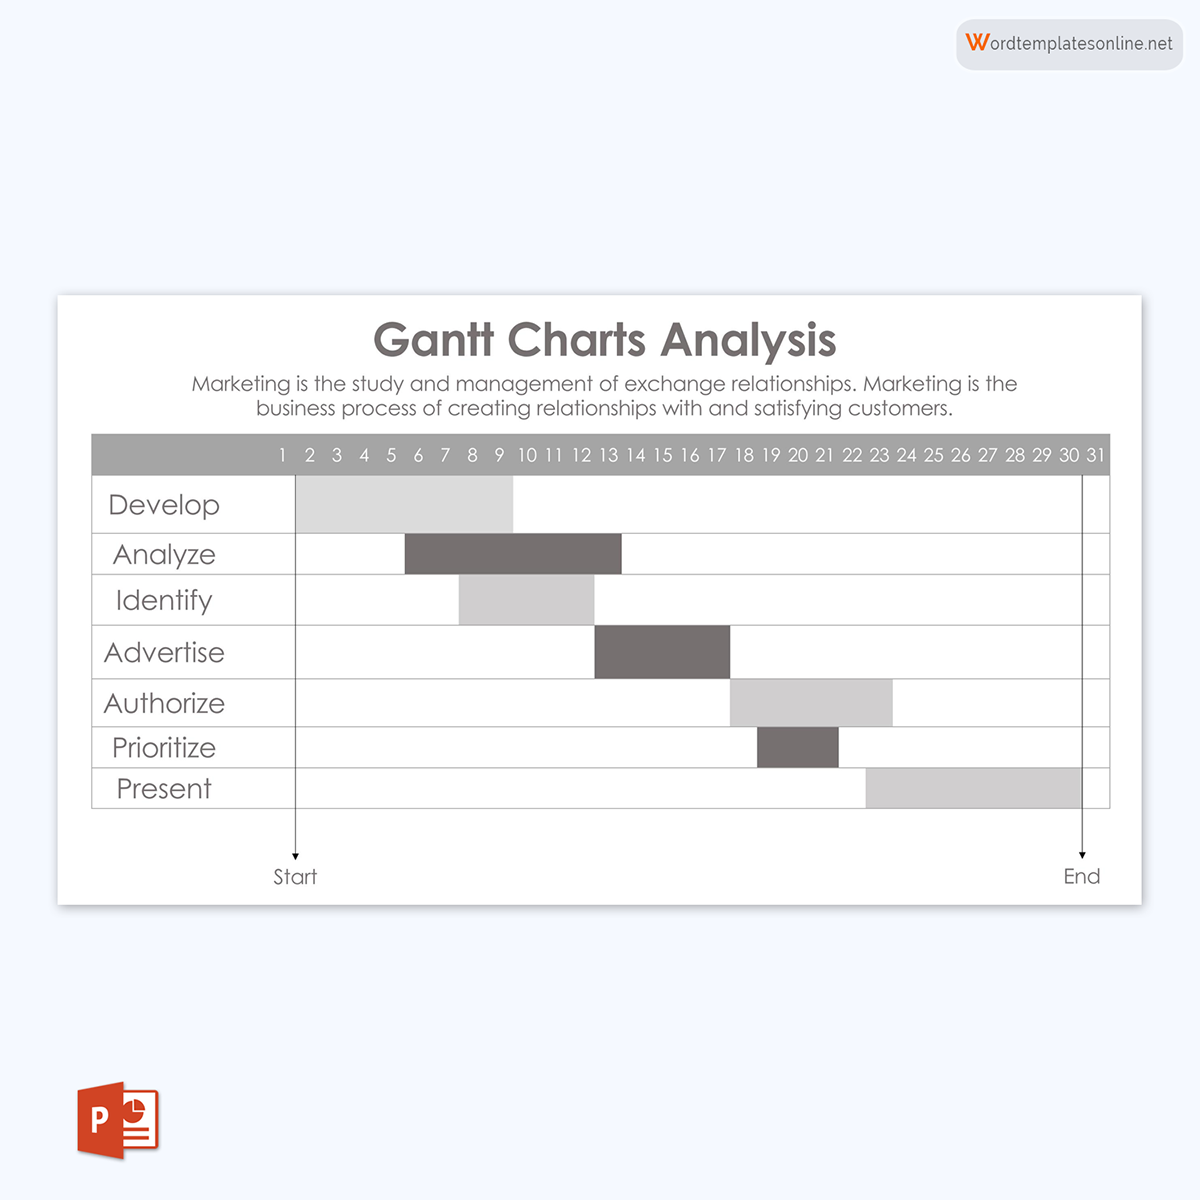
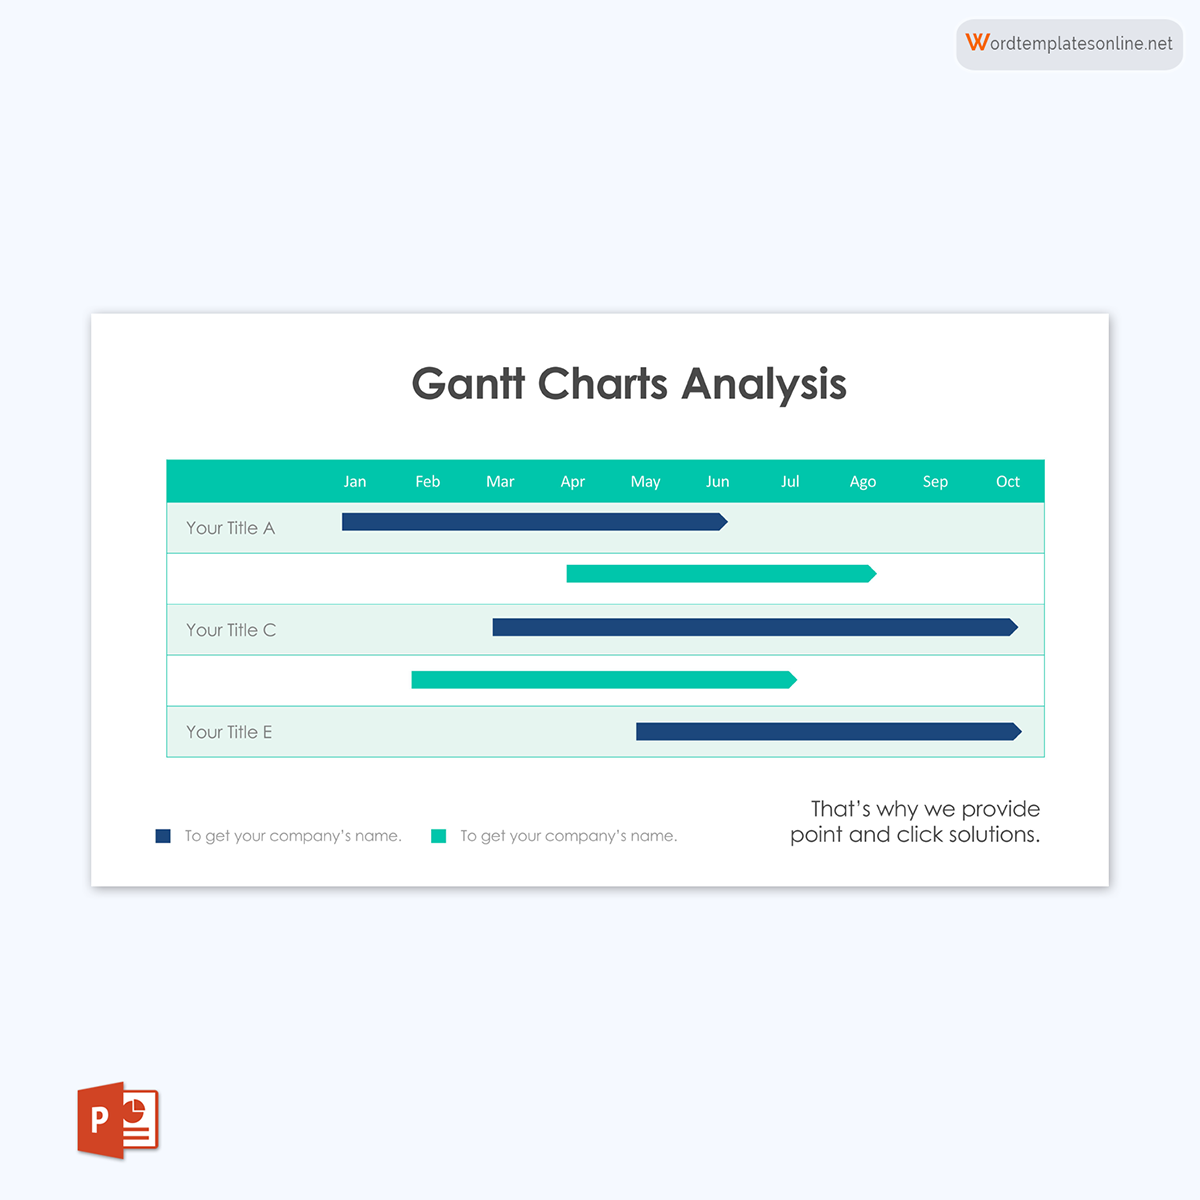
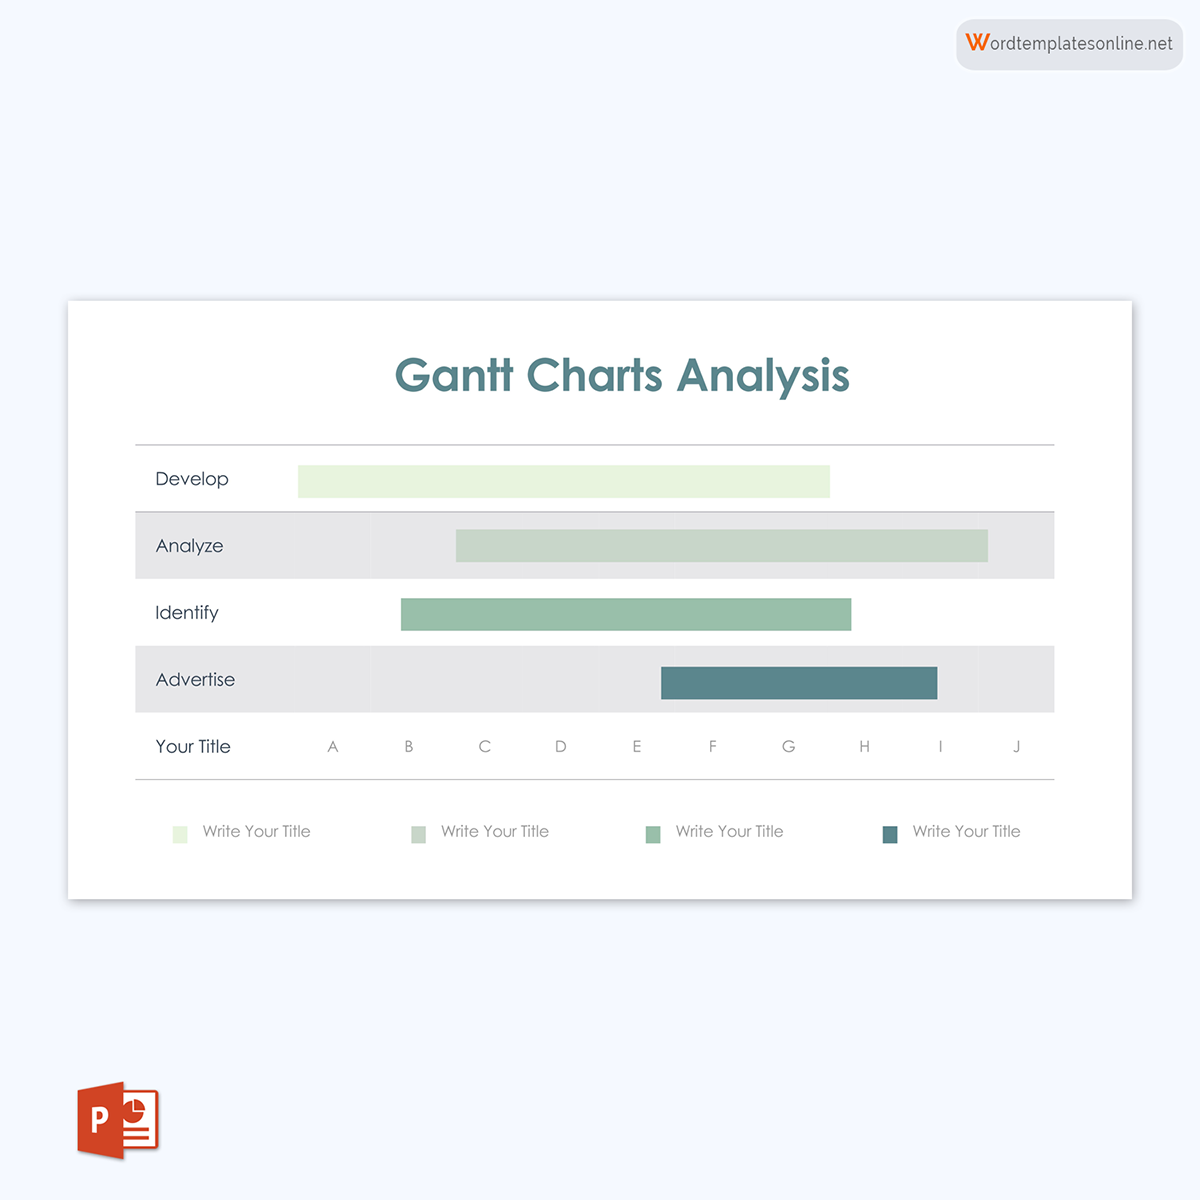
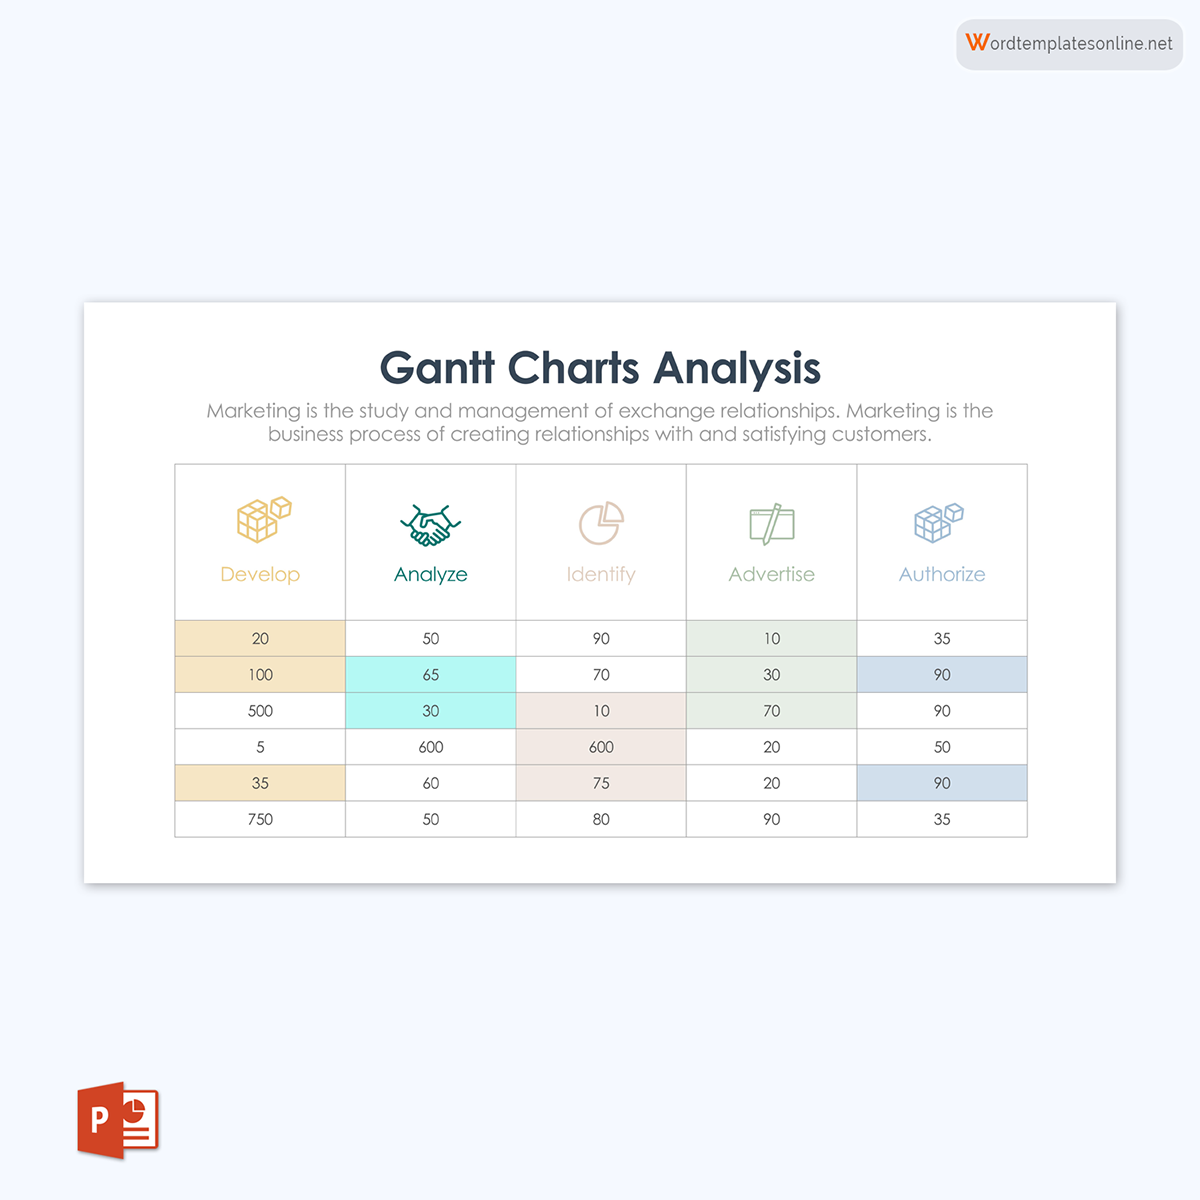
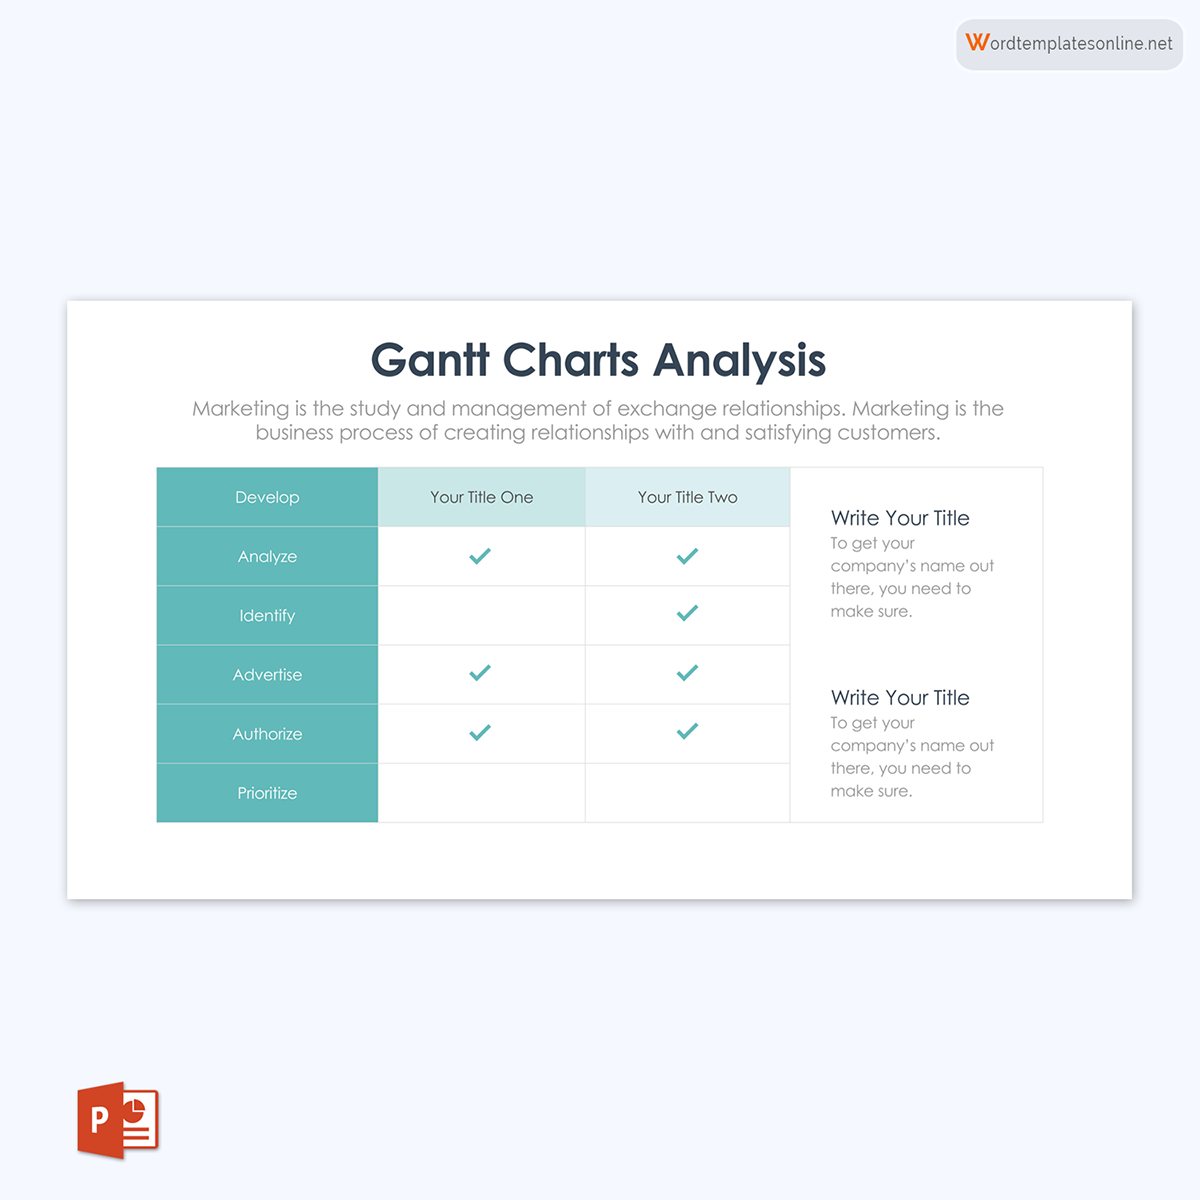
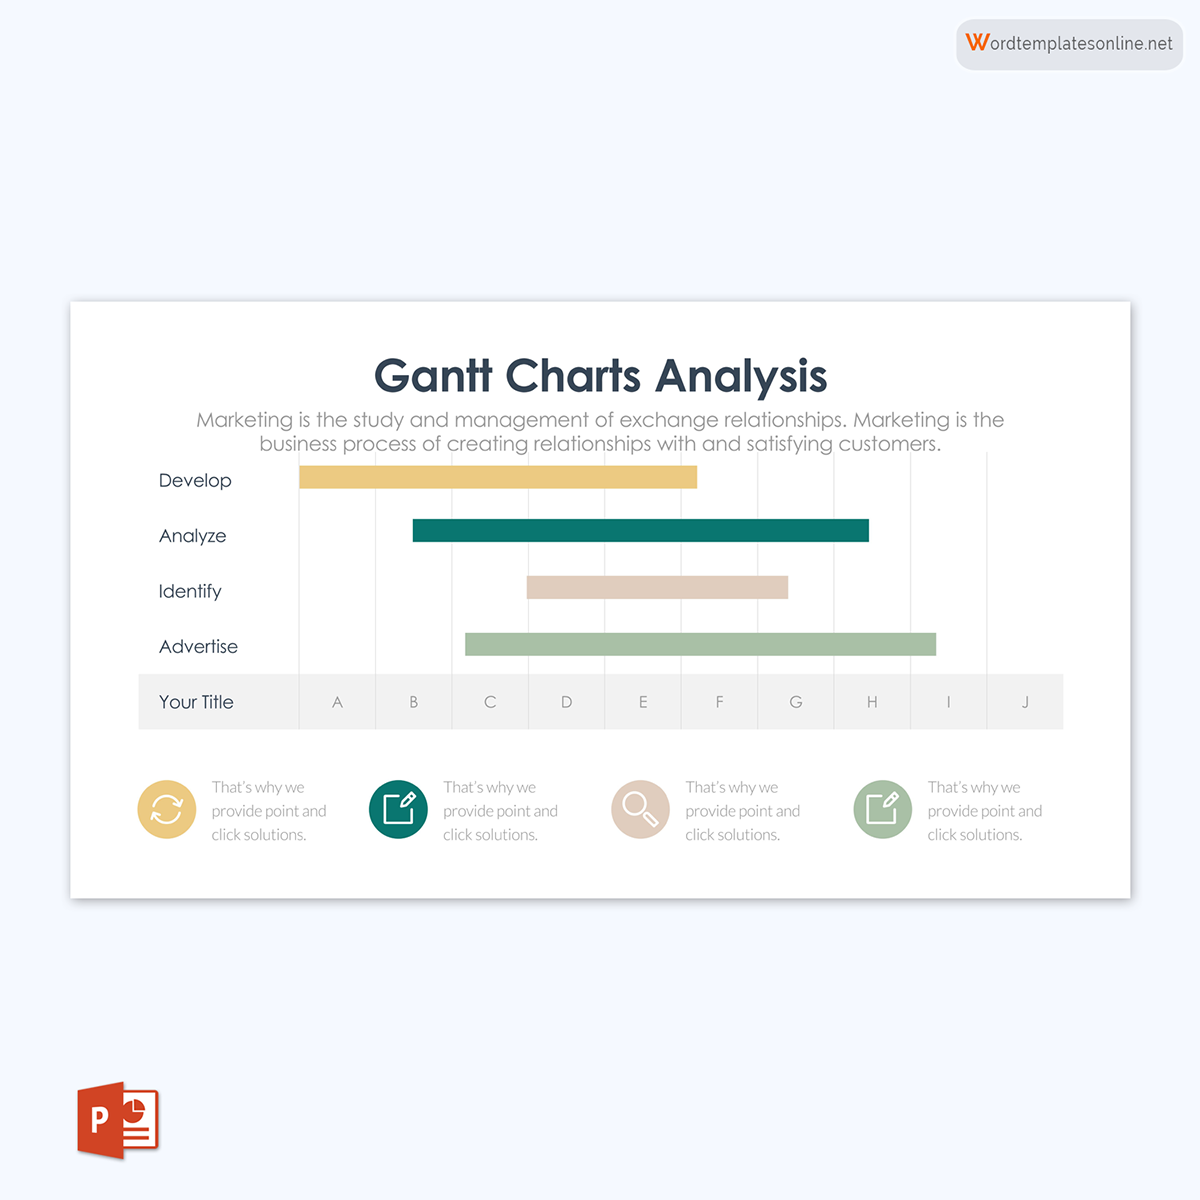
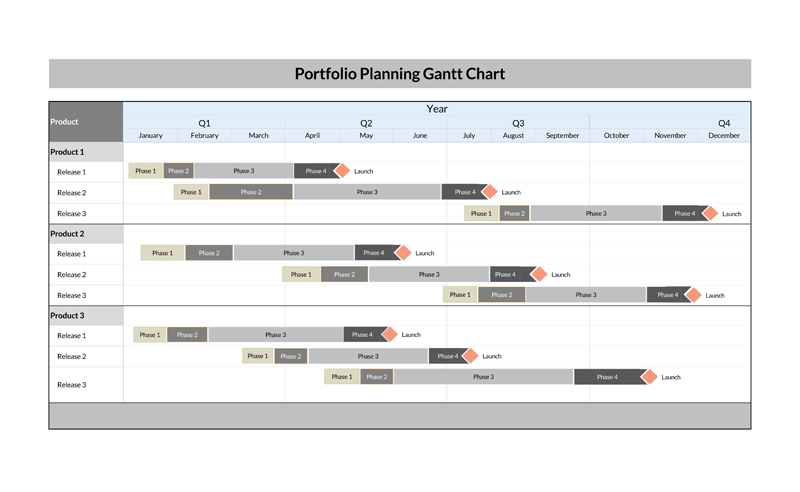
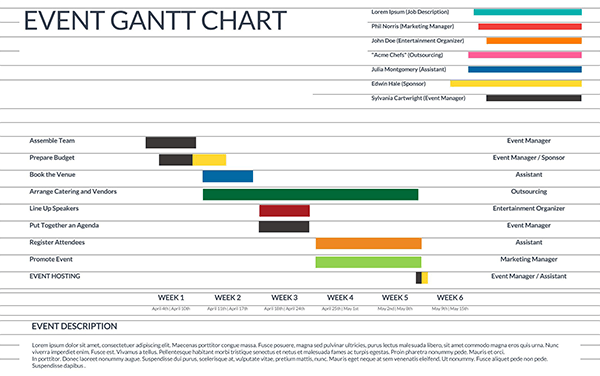
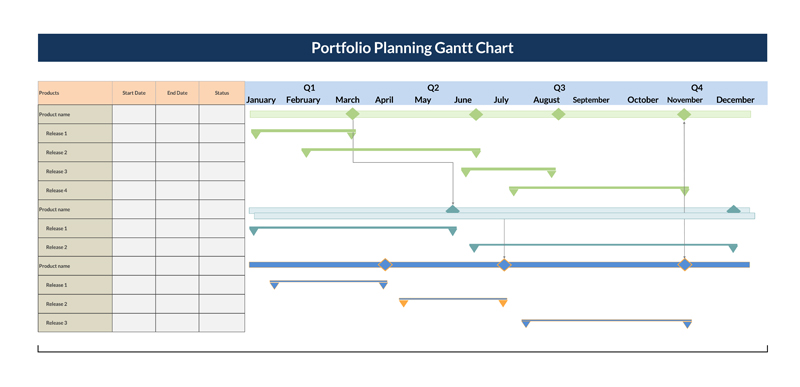
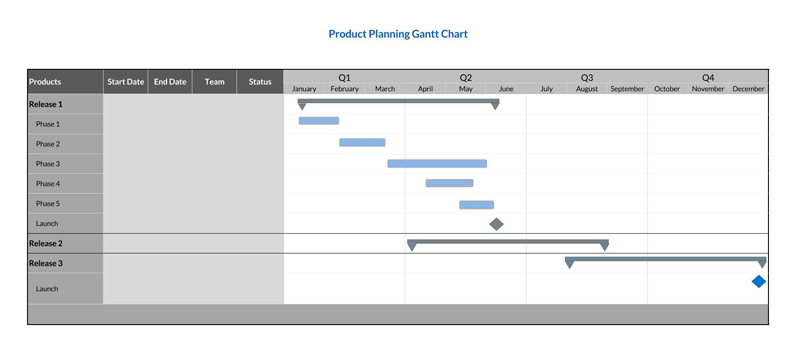
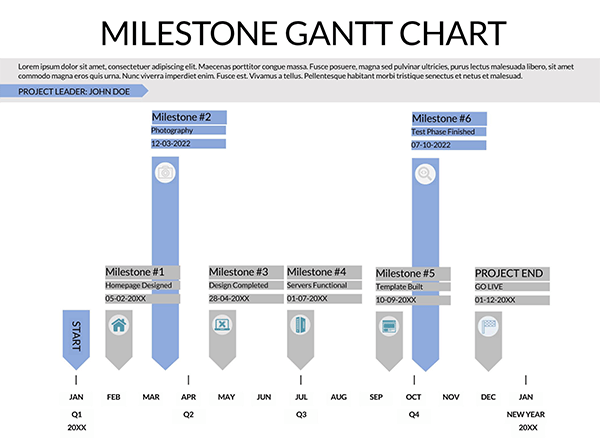
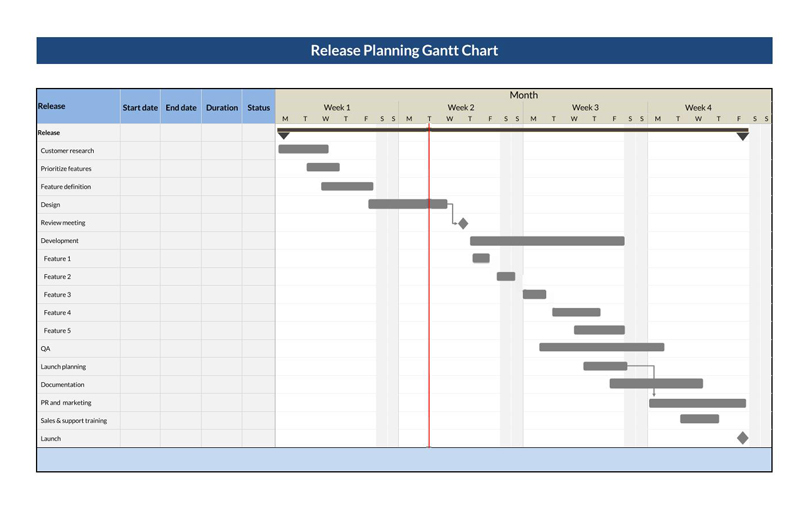
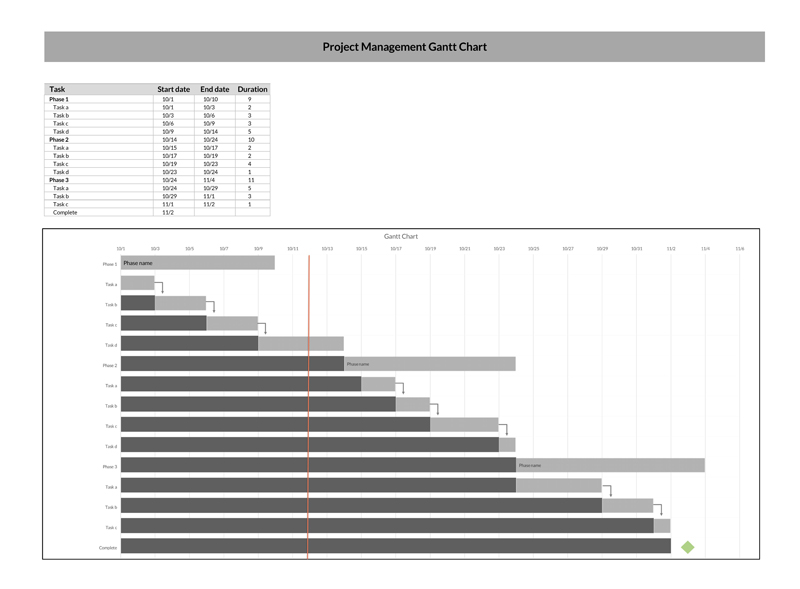
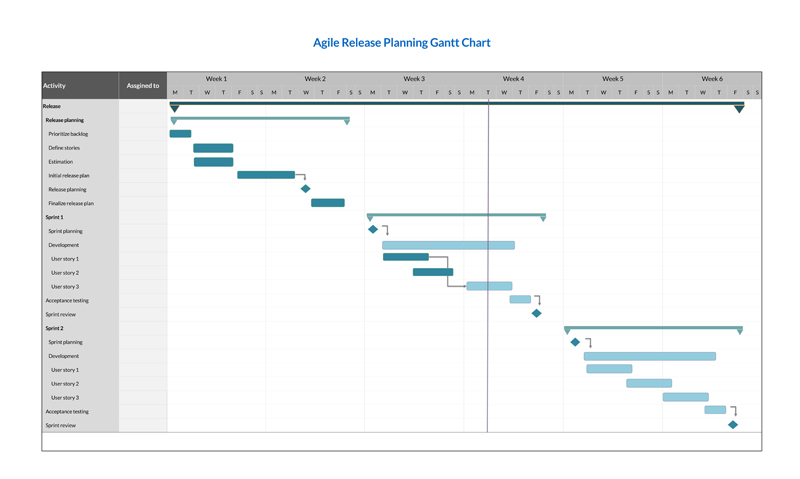
Gantt Chart Templates

How to Use a Gantt Chart?
Gantt charts are helpful for planning and control purposes, such as compiling a project activity list, creating a budget, or determining staffing requirements at each project phase. In addition, they provide a clear view of how tasks are related to one another in terms of timing and dependencies. As such, they can be used to control and prevent potential problems and bottlenecks in project scheduling.
There are two common types:
- Percent complete: This type shows the cumulative percent complete for each task. It is typically used to track actual progress against planned values.
- EVMS (Earned Value Management System): This one uses earned value data to represent cost and schedule performance graphically.
Gantt charts also enable managers and staff to visualize the tasks, resources, milestones, and timeframes involved in a project. They allow for the comparison of actual progress with planned items so that corrections or adjustments can more easily be made. By understanding how the work is accumulating, managers can determine which tasks take longer than expected and need to be re-assigned or re-planned.
There are several ways to accelerate project schedules; two of the most commonly used tools are Fast Tracking and Crashing. Fast-tracking is the process of bringing forward tasks or events that would typically be done later in a schedule, allowing earlier completion and, therefore, shortening the project duration.
For example, if there is available slack time within a schedule, this can be used to perform multiple tasks at once rather than waiting for each task to be completed in sequence. This approach should only be used when the tasks can be completed without impacting the quality of the product or introducing new problems.
Crashing is a more drastic measure where resources are added to a project to complete it sooner. This can be achieved either by adding resources to existing tasks or by re-sequencing the sequence of tasks that have not yet been done.
Gantt charts can also be used to identify the critical path- the sequence of tasks that results in the shortest total project duration if the schedule is not delayed or extended. The critical path is also known as the “path of least resistance,” since any delay along this route will cause the entire project to be delayed. Additionally, they can be used as a computer application or as a physical chart updated and redrawn manually. The updated version of the Gantt chart becomes the “Baseline” for making future projections against actual values.
How to Create a Gantt Chart in Excel
There are different ways to create templates for Gantt charts, but one easy way is to use Microsoft Excel. The following are steps on how to create an effective template for your projects using Microsoft Excel:
Step 1: Review the approved scope baseline
The first step is to review the approved scope. This means that you must already have a Scope Statement (ideally an approved one) and all the information related to the Work Breakdown Structure (WBS) and the WBS Dictionary in place.
You will have a complete picture of your project’s work by adequately identifying all this information. Also, you will be able to create the most appropriate labeling for your key components when creating the Gantt chart template.
Step 2: Identify essential tasks and create activities
The next step is to identify all the essential tasks—the basic steps in completing a project deliverable. These are the tasks that you need to know to complete your project. Once you have identified all these tasks, it is time to create activities for each task. To create each activity, you must provide a title for your activities.
Using the decomposition technique, you can then further break down each WBS task into smaller, more manageable tasks until you reach the level of detail required to populate your Gantt chart. This is an important step, as it will ensure that it is error-free and reflects the true status of your project.
It is also important to identify milestones and any dependencies between your activities. You can identify the milestones by looking at the task’s end date and determining what needs to happen before that point for the project to be considered complete. The dependencies between activities can be identified by looking at the precedence of relationships between activities.
To do this, go to the Excel sheet, click on “Insert,” and then select “Table.” From there, click on “OK” Once you are in the Table Formatting window, enter all your tasks into the table that will be created for you.
Step 3: Identify task dependencies
Once you have listed all your essential tasks and activities, it is time to identify their dependencies. Task dependencies are simply the relationships between the activities that must exist for one activity to begin and be completed before another can be initiated.
Identifying the task dependencies is a crucial step in creating a Gantt chart template for projects that are tracked in Excel. If you fail to identify the dependencies correctly, it will be impossible to complete your project. To identify all these dependencies, what you would have to do is list the predecessor(s), i.e., the tasks that need to be done before the current task can begin, and the successor(s), i.e., the tasks that come after the current tasks have been completed. Once you have listed all your predecessors and successors, it’s time for you to enter the remaining information in the table.
You can either use the “Insert” menu to insert your predecessors, successors, or dependencies to do this on Excel. Or you can use Excel’s built-in dependency feature that allows you to identify all these pieces of information. To enable this feature, go to the “Features” tab, select “Data Validation,” and choose “Dependents.” From there, you are now all set to enter the remaining information on the table.
Step 4: Sequence activities
Once you have listed all the essential tasks, dependencies, and activities for each task, it is time to sequence them from your task dependency table. Sequencing activities simply means arranging all your activities from top to bottom in the order they need to be completed. In addition, sequencing ensures that you consider all the dependencies between your tasks, i.e., which task needs to be finished before the next one can begin. With this information in mind, you will now have an easy time sequencing your activities from top to bottom.
Sequencing activities is a critical step in ensuring that your project is correctly sequenced and will be completed on time. When sequencing, it is important to be aware of the two different types of sequencing: sequential and parallel. Sequential sequencing occurs when one task can only be completed after the previous task is finished. It is often used in manufacturing, where each task is completed in a specific order.
Parallel sequencing allows for tasks to be completed at the same time. It is often used when there are multiple resources available to complete the tasks. Once you have finished sequencing, it is important to review your chart and make sure that all your activities are listed from top to bottom in their correct order.
- Finish-to-Start (FS) Sequencing: FS sequencing is the simplest and most common way to sequence activities. In this type of sequencing, you would finish your predecessor tasks before starting your successor task. This means that you would start your successor only after finishing your predecessor.
- Star-to-Start (SS) Sequencing: SS sequencing is a common way of sequencing activities, but it is not easy and simple compared to finish-to-start sequencing. In this type of sequencing, you would start your successor only after starting your predecessor’s task.
- Start-to-Finish (SF) Sequencing: Another popular way to sequence activities is to start your successor after starting but finish your predecessor before competing with the successor. In this type of sequencing, you would not be able to complete your successor until after finishing your predecessor.
- Finish-to-Finish (FF) Sequencing: FF sequencing is the most complex way to sequence activities because it requires that you have already finished your predecessor before completing your successor. This means that you would not be able to complete your successor until after finishing your predecessor.
To sequence your activities in Excel, you will have to use the “Insert” menu and select “Activity” from there. This will allow you to enter all your predecessors, successors, and dependencies into a table that Excel created for you. From here, make sure to sequence your activities from top-to-bottom, including all predecessor(s) and Successor (s).
Step 5: Input activities
Once you have identified all the essential tasks and all their predecessors, successors, and dependencies are listed in your task dependency table, it is time to input all these activities into your project schedule. You can do this by clicking on the “Insert” menu and selecting “Task” from there. This will allow you to enter all your essential tasks into a table that Excel created for you. From here, make sure to include all the dependent activities that exist between your tasks, as well as a start and finish date.
Step 6: Estimate resources
Once you have scheduled all your tasks, you can now estimate the required resources for each task. To do this on Excel, you will need to highlight your project’s tasks that require more than one resource and then, using the “Insert” menu, select “Resource” from there. This will allow you to enter all your task resources and their respective rates. Keep in mind that if you are planning to assign tasks to different team members, you will need separate resources for each member.
The duration of each activity needs to be estimated before assigning activities to different team members. Different techniques can be used for estimating durations, but the most popular ones are Analogous, Parametric, and Bottom-up (or expert) estimating.
- Analogous estimating is the most commonly used duration estimation technique because it looks at how long similar activities took to complete in the past. This is done by selecting a task that has already been completed and then using that data to help you estimate your current task’s duration.
- Parametric estimating is a technique that uses mathematical relationships to estimate the duration of a current task. This is done by taking the average time it takes for similar tasks to be completed and then multiplying that by the number of resources needed for your current task.
- Bottom-up (or expert) estimating is another popular duration estimation technique because it uses the experience of the individual completing the task to estimate the duration. This is done by breaking down the current task into smaller components and estimating how long each component will take to complete.
- Three-point estimating is a technique that uses three different estimates to predict the resources required for a current task. This is done by first multiplying your high estimate by your medium estimate and then again by your low estimate.
Step 7: Estimate durations
Estimating your task durations is one of the most important parts of creating a project schedule. It will allow you to determine when certain stages in your project will be completed. This is especially important if you are planning to complete tasks in a time-sensitive manner, as you will be able to add all your tasks into one schedule and then determine when the entire project will be completed.
To estimate task durations, start by highlighting all your project’s tasks that require more than one resource. From here, you can use your knowledge of the task to estimate how much time it will take. For instance, if one of your activities is to create a technical support manual, but you do not know how long this task should take, you can research other manuals that were created by similar companies or individuals and then compare the length vs. the effort required.
To add an estimated duration on Excel, you can use the “Insert” menu and then choose either “Duration” or “Timeline.” This will allow you to enter all your task durations into a table Excel created for you.
Step 8: Develop a schedule
Once you input all your task durations, it is time to place them into a schedule. You can do this by using the “Insert” menu and then selecting “Gantt Chart” from there. This will allow you to enter all your essential tasks, along with their predecessors, successors, and dependencies, into a table that Excel has created for you. From here, you can select and drag tasks into the correct order and move milestone markers around once they have been set.
Response plans and schedule contingencies should also be taken into account at this stage, as they will help you to stay on track if any unexpected problems arise. A good way to address schedule contingencies is by adding a buffer to each task. A buffer is an activity with no resources or scope attached to it that can act as a protective barrier for more important tasks.
For instance, if you had to create an activity that would take 10 days to complete with no additional requirements but your project was scheduled to be completed within 9 days of the original deadline, you could add an 11th day to the end of this activity and then use it as a buffer. This would ensure that your original deadline is still met, even if something unexpected happens.
Resource optimization techniques such as resource smoothing or leveling can also help keep your project schedule on track. Resource smoothing is the process of evenly distributing the workload among all resources, while resource leveling is the process of evenly distributing the start and finish times of tasks across all resources.
Step 9: Assign tasks to your team members
Once all your essential tasks are listed in a Gantt chart along with their respective start and end dates, you can now assign them to your team members. To complete this step, highlight the tasks that you want to assign to all your team members and then place them into a different colored section (i.e., mark them with “red” for yourself or “yellow” for John).
Once they are marked, select them all and drag them down as far as you can. You will also need to keep in mind that you cannot drag these tasks any further because of the way Excel performs its calculations. Once they reach the bottom line, Excel will not allow you to drag them any further. Additionally, if you want to remove a task from your schedule marked with your team member’s name, you will need to right-click on it, select “Hide Task,” and drag it up.
Step 10: Set milestones
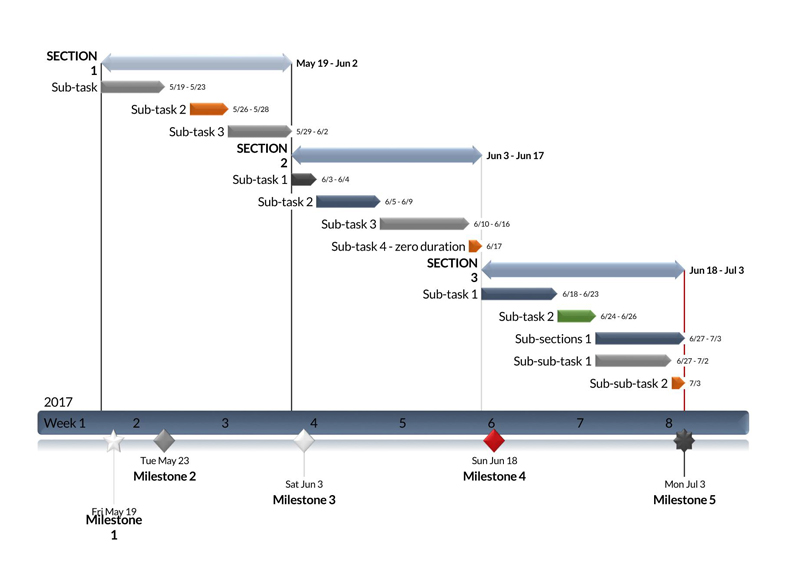
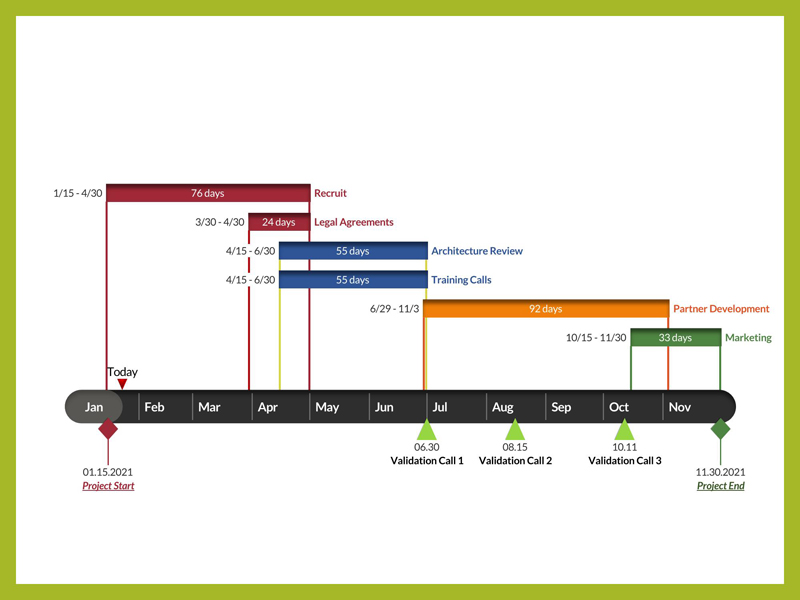
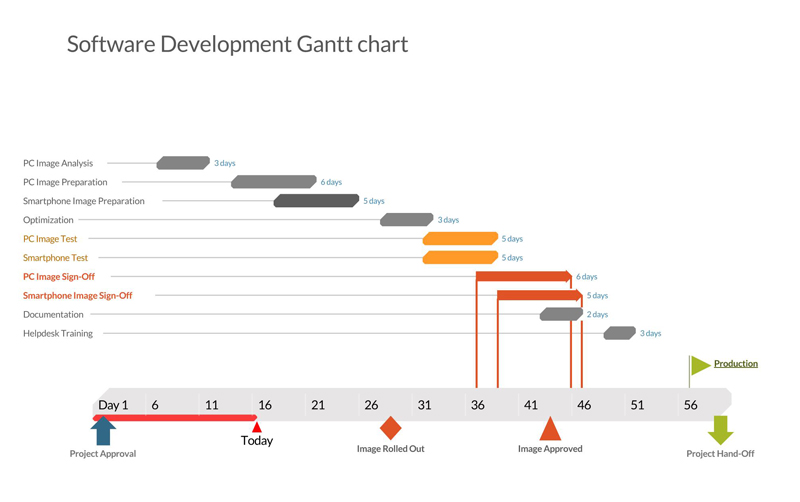
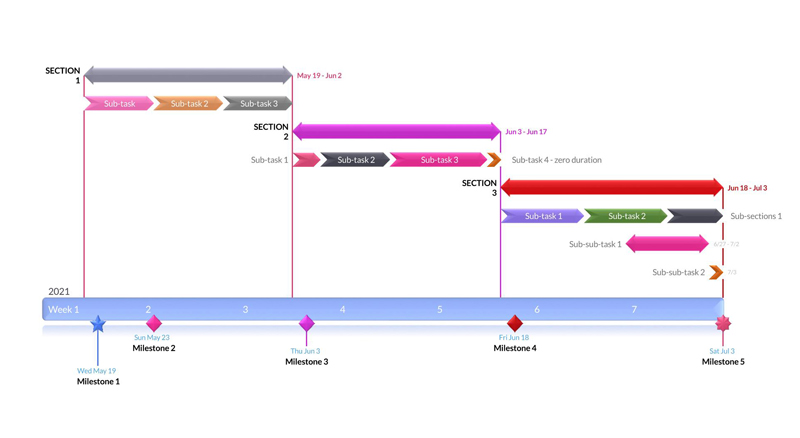
Now that all the tasks are assigned, you can go ahead and set some milestones in your schedule. A milestone is an activity that is used to mark the completion of a specific section of work, task sequence, or phase of a project. They are usually represented by a diamond-shaped symbol in a Gantt chart. Milestones are usually fixed dates or important dates that cannot be moved, and they should not have any duration associated with them.
To do this on Excel, highlight the tasks that represent the milestones that you would like to include in your project schedule. You can also assign a milestone marker by right-clicking on the task, selecting “Insert Milestone,” and then setting your marker.
Step 11: Chart progress
To chart the progress of the tasks within your schedule, highlight all the tasks that are complete, right-click on them, and select “Hide Task.” All the tasks that are still in progress should be shown, but you can also hide these by right-clicking on them, selecting “Hide task,” and then dragging them up to the completed section of your schedule. From here, you can chart the progress of each task in your schedule by dragging them across the timeline.
Step 12: Review and update the schedule
Once you have completed all your tasks, you can review your entire project to check for errors or areas that need improvement. From here, you will be able to update any parts of your schedule that are necessary to complete your project successfully. You can also create a new one by right-clicking on the sheet, clicking “Add” then “New Sheet,” and lastly, selecting “Summary” from the dropdown menu to quickly update any existing projects in Excel.
Pros and Cons of Using a Gantt Chart
There are several benefits to using a Gantt Chart, but some drawbacks must also be considered before using this tool. Here is a list of the pros and cons of using one.
Pros
Some pros of a Gantt chart are as follows:
- it is a great project management tool for planning and visualizing your projects. You can use it to visualize the different stages of your project, along with its timeline, which will help you manage all tasks more efficiently.
- It can help visualize the different tasks and milestones that you need to complete. With a Gantt chart, you can see the project schedule briefly, which will help identify any problems or issues before they even happen.
- they can be used for future planning or to make changes to your projects along the way. This is most useful when you need to make changes or updates at the last minute.
- Gantt charts assist in time management, which will help you prioritize your tasks and plan out your day more efficiently.
- It is a great collaboration tool that allows you to share your projects with others, clients, or teams involved in the project.
- It can help you track the progress of your project from beginning to end. This will allow you or your managers to make any necessary last-minute adjustments.
- It can help you identify and report any problems or issues to your managers and clients.
Cons
Listed below are some of the cons of a Gantt chart that one should consider before making one:
- A Gantt chart is a great project management tool, but it can be hard to create one from scratch. This is specifically true if you are new to this type of project management tool.
- Since the template will be directly linked to your projects, you might not be able to update it later. This is most true if you have already sent or distributed the project schedule to other stakeholders.
- Since the timeline of your projects will appear within this tool, it can be time-consuming and might not be ideal for short-term projects or tasks that need to be completed daily.
- If the timeline is not appropriately managed, it can lead to problems and issues that might be challenging to manage or repair.
- Since this tool focuses more on the task than the people responsible for completing it, you might find it hard to track individual progress within your projects.

Final Thoughts
Overall, a Gantt chart is a great project management tool that can assist you in planning and managing your projects. It can also be used for many reasons, such as time management, tracking progress, and providing reports to managers or clients at any given time. It can also assist you in visualizing your projects and the different milestones that have been completed. However, there are some downsides to using this tool, especially when creating one from scratch. This is why you will need a good template that you can use as a starting point for your projects.
About This Article