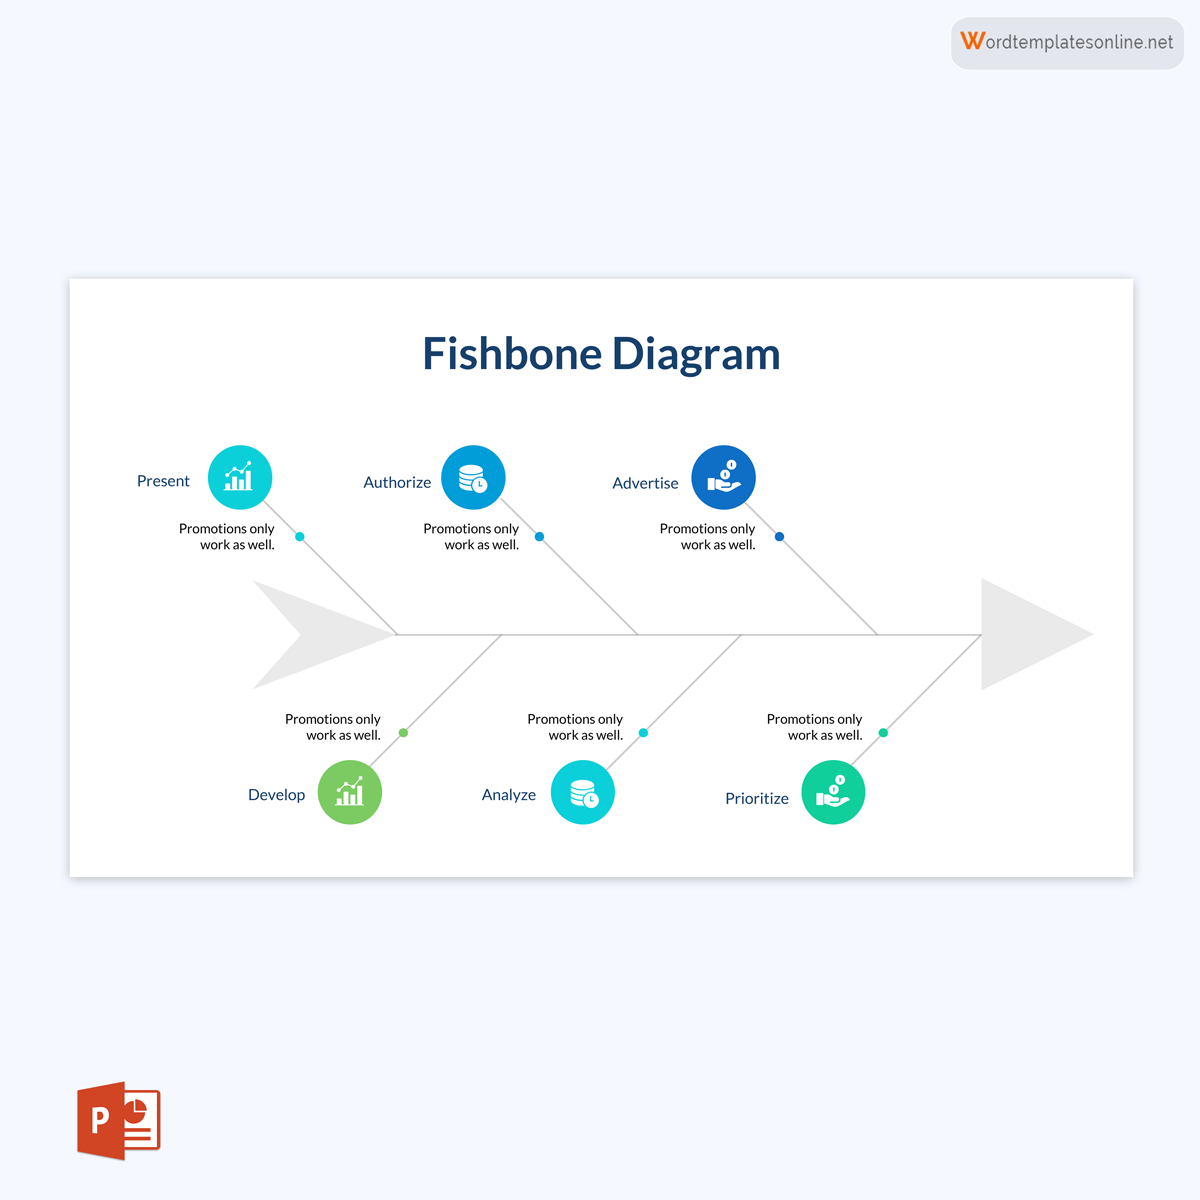
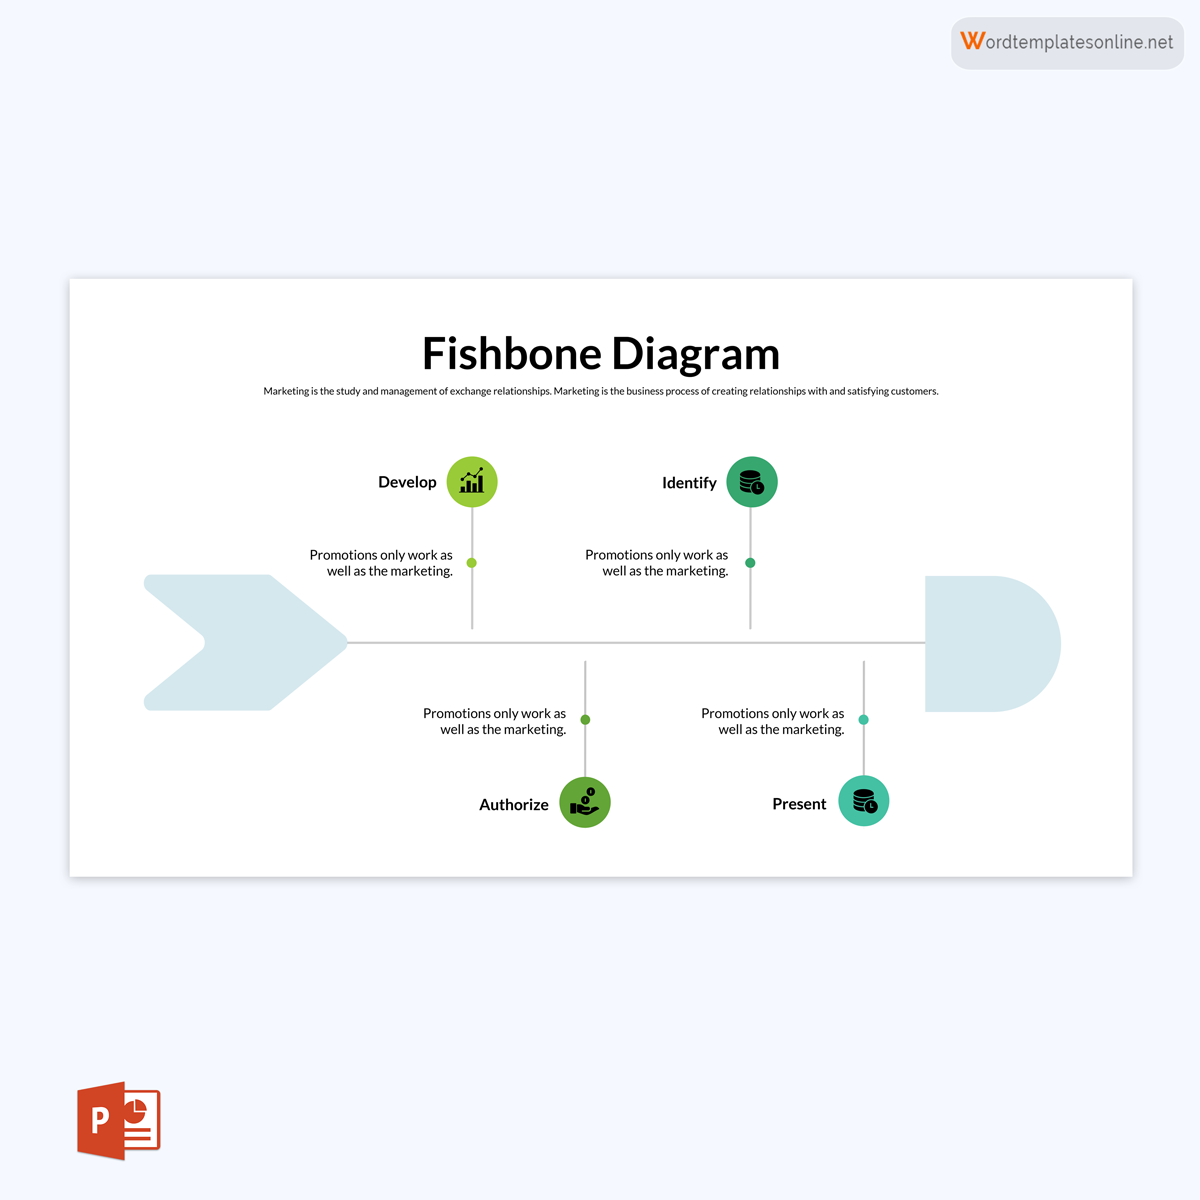
A fishbone diagram is a visual analysis tool used to categorize all the possible causes of a problem or effect.
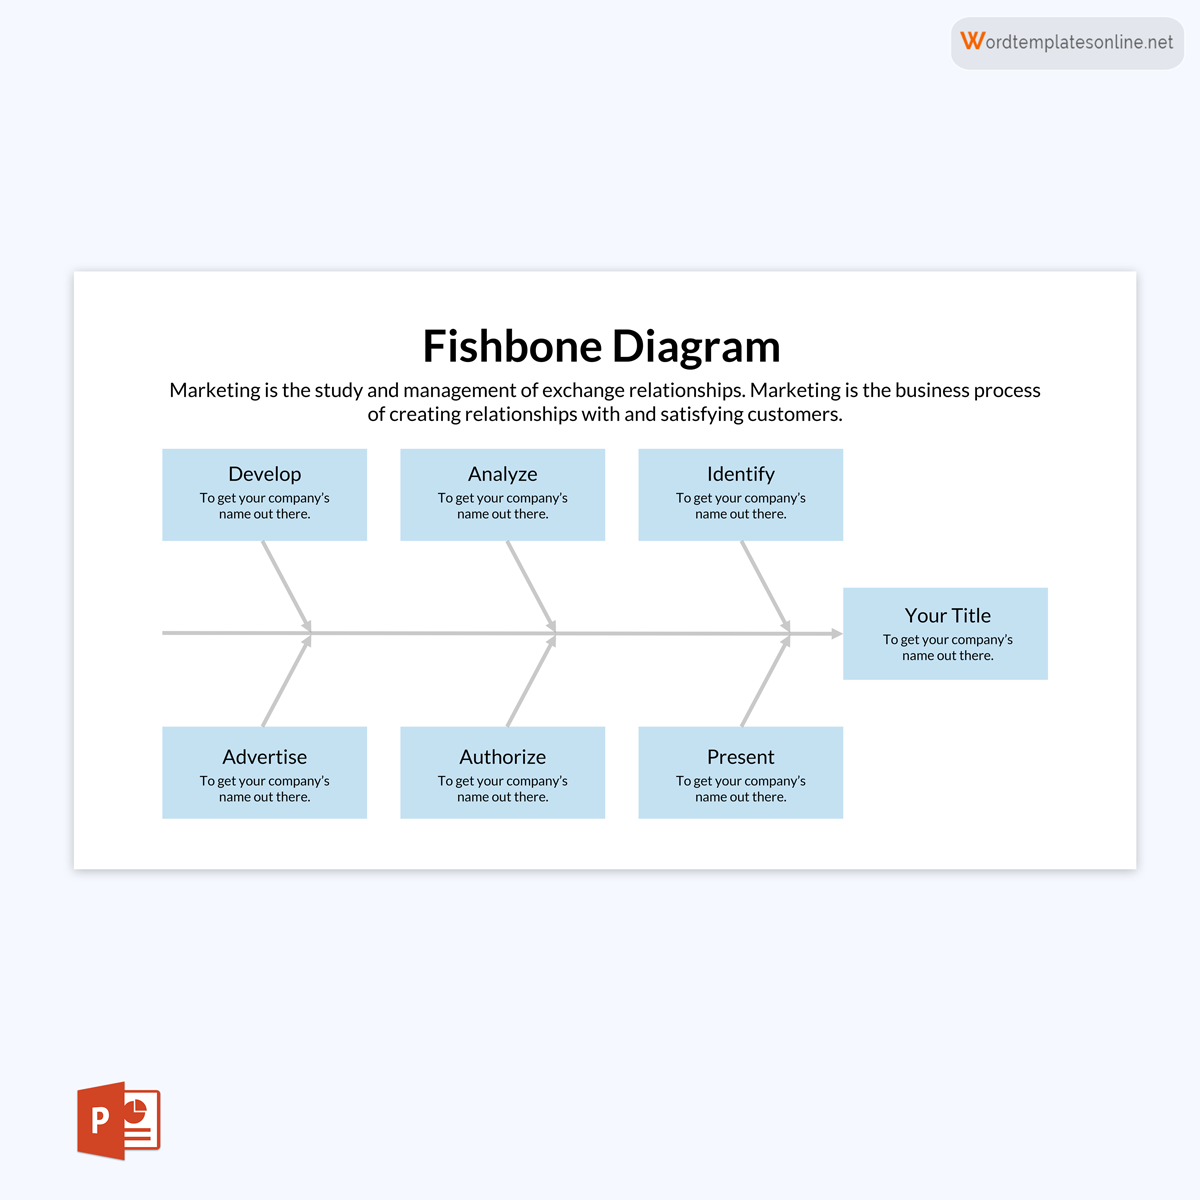
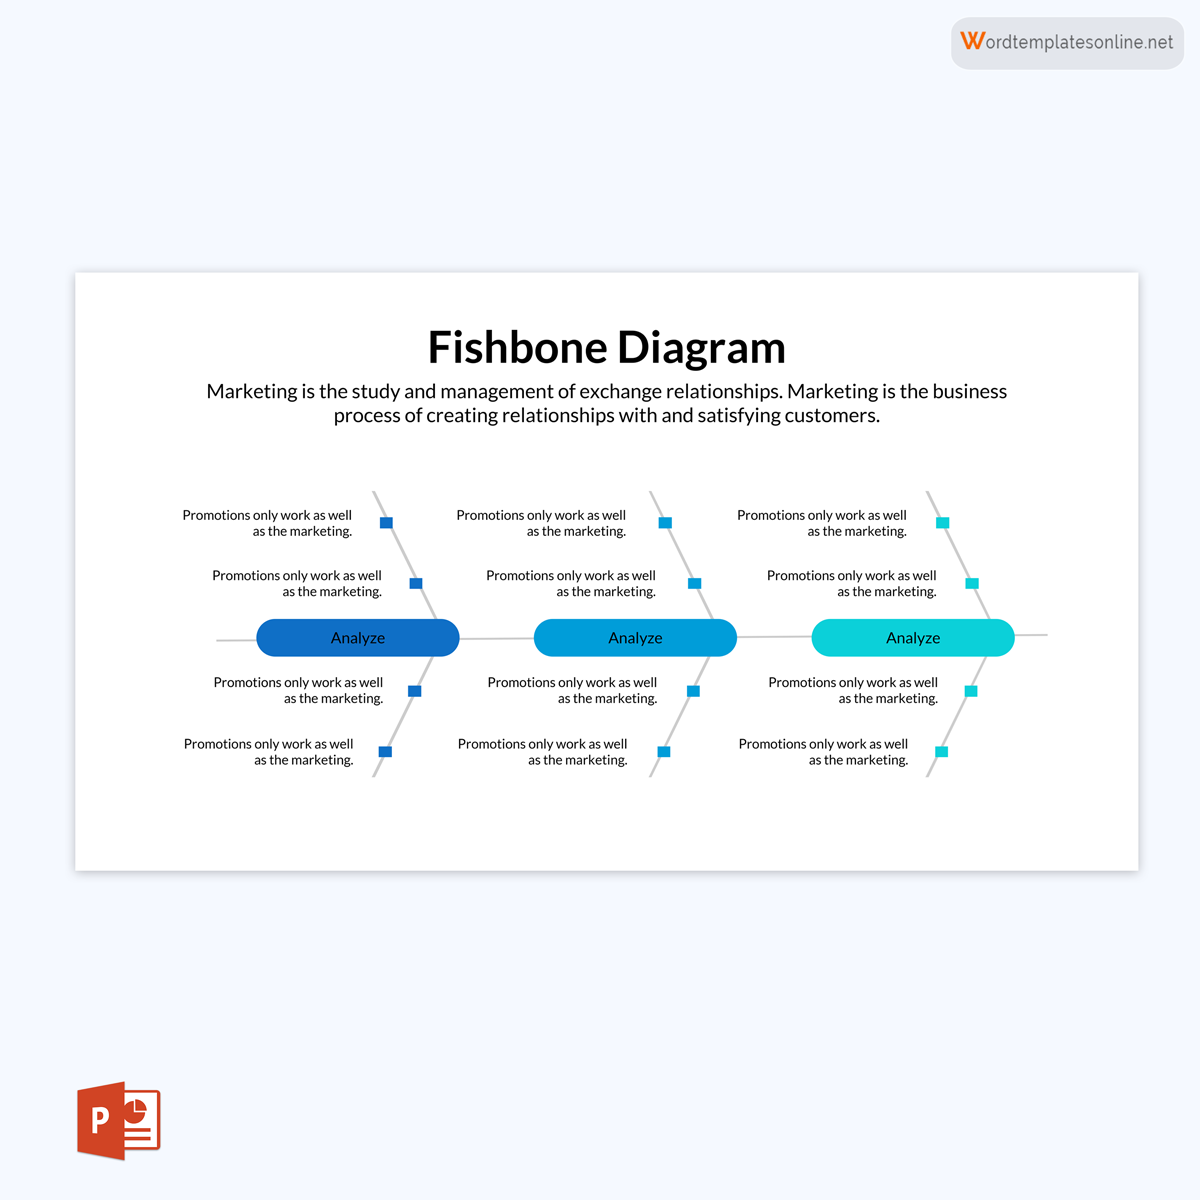
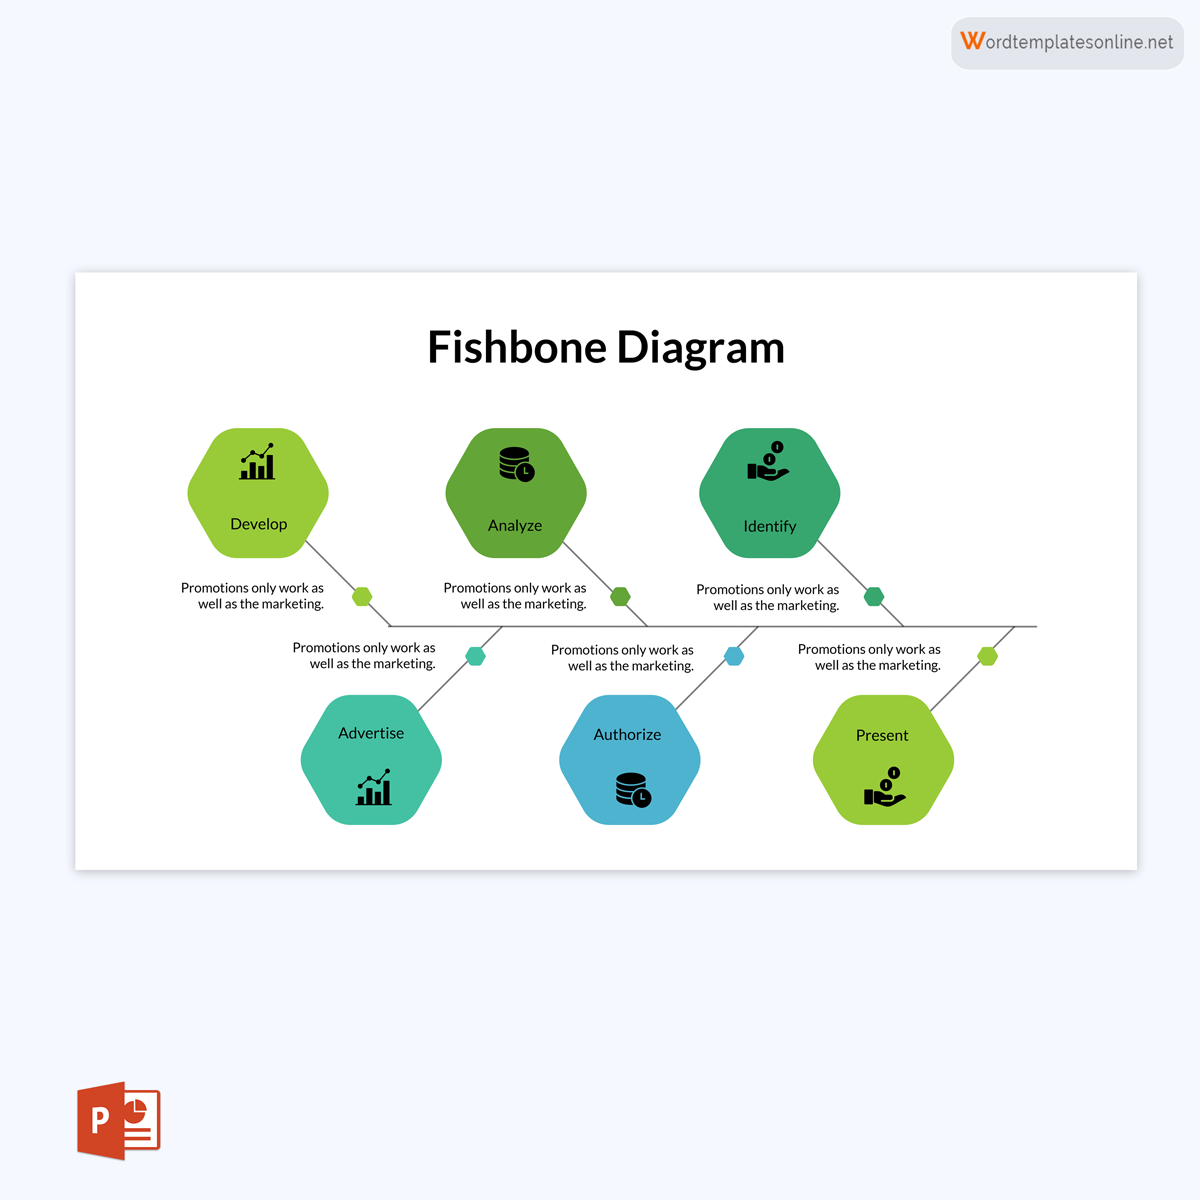
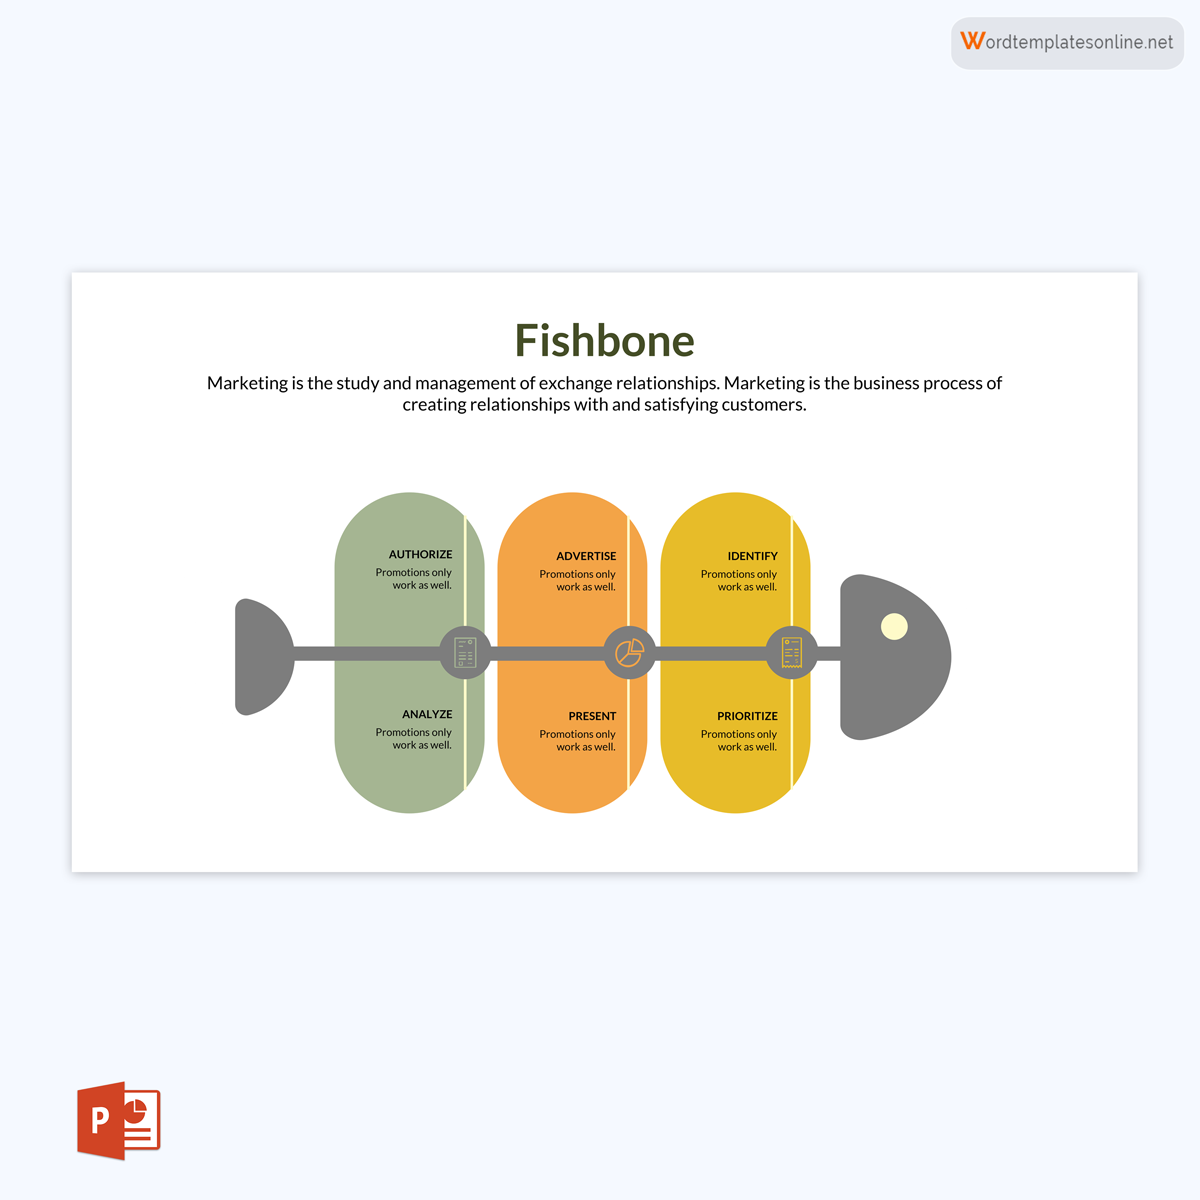
It identifies and breaks down the root causes that potentially contribute to an effect within a process. It visually mimics a fish skeleton facing right, hence the name “fishbone” diagram. The fish’s head represents the problem/effect, and the skeleton bones represent the causes. The ribs represent the major causes of the problem, while sub-branches represent the root causes. The diagram can have as many branches as necessary.
The diagram will typically be used to identify the main causes of a problem or effect. Therefore, it is best to identify factors that affect a problem rather than the problem hence helping the team focus on the causes, not the problem. It is also used to collect extensive information on a process, thus establishing key relationships between variables and probable causes or problems. It can be used to develop theories on the causes of an existing problem; therefore, it can be used as a quality control tool.
The primary purpose of the diagram is to help the team locate the root causes of any problem. The team can therefore brainstorm and prioritize which causes to address first. This way, recurring problems are resolved.
The fishbone diagram is also known as:
- Cause-and-effect diagram
- Ishikawa diagram
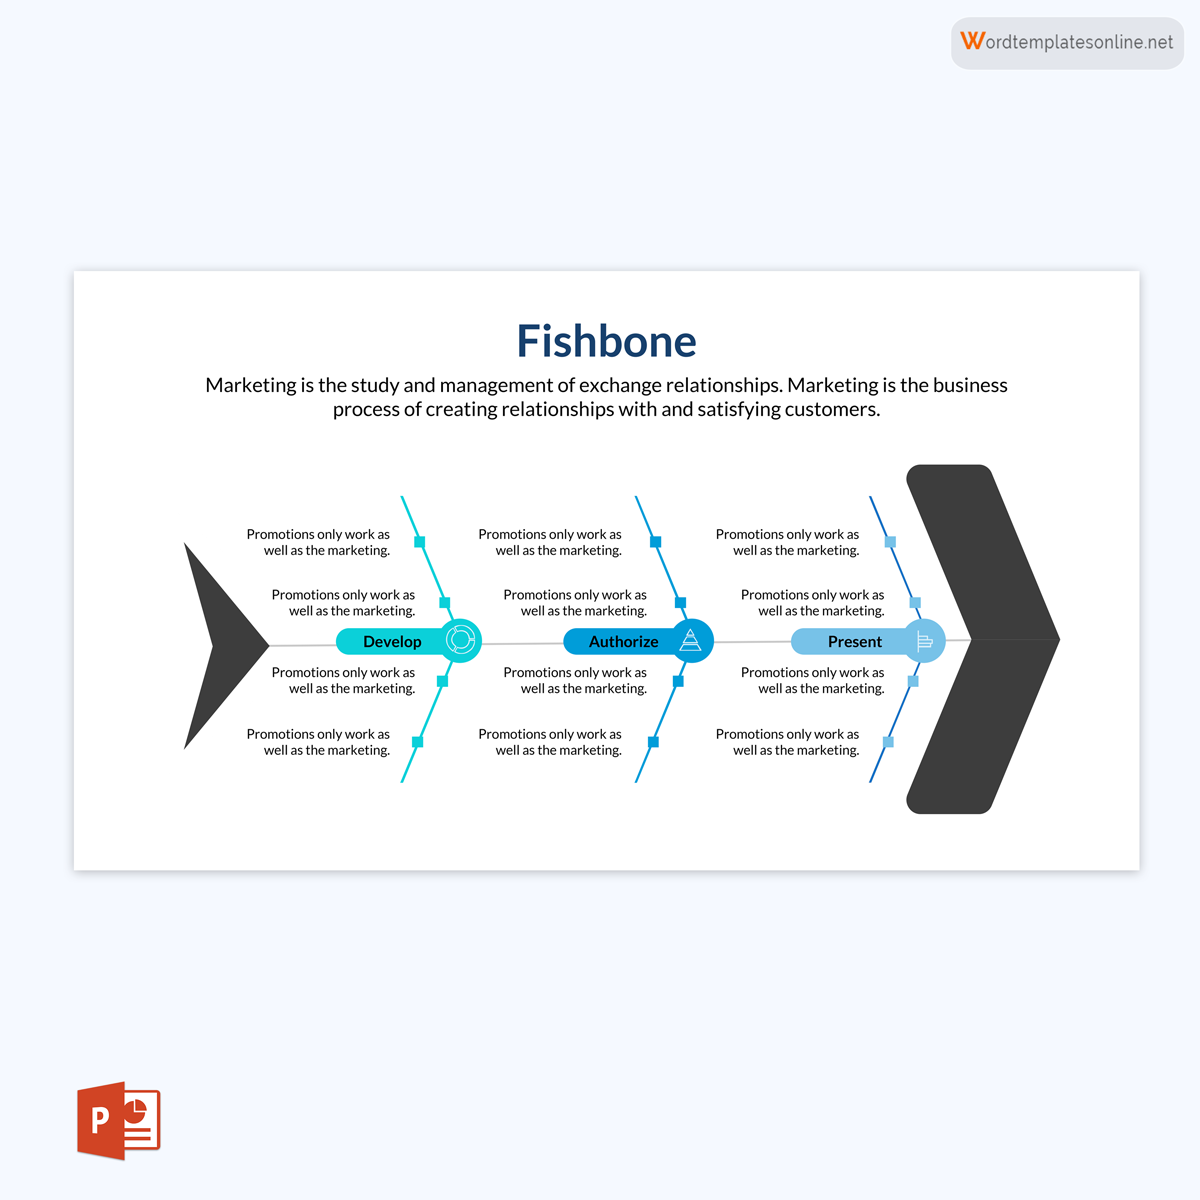
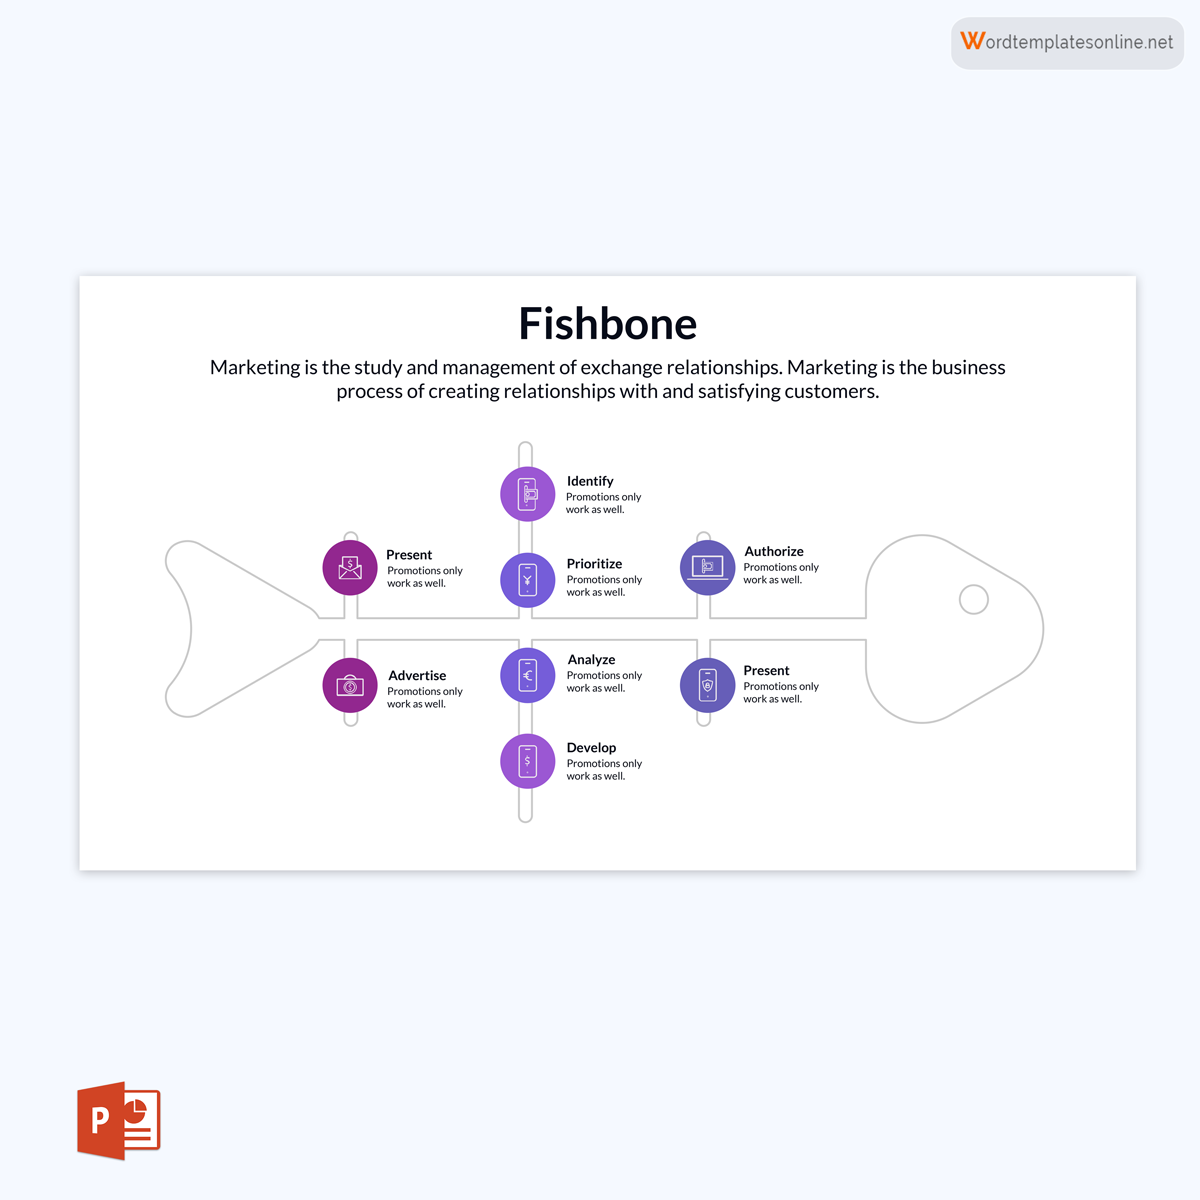
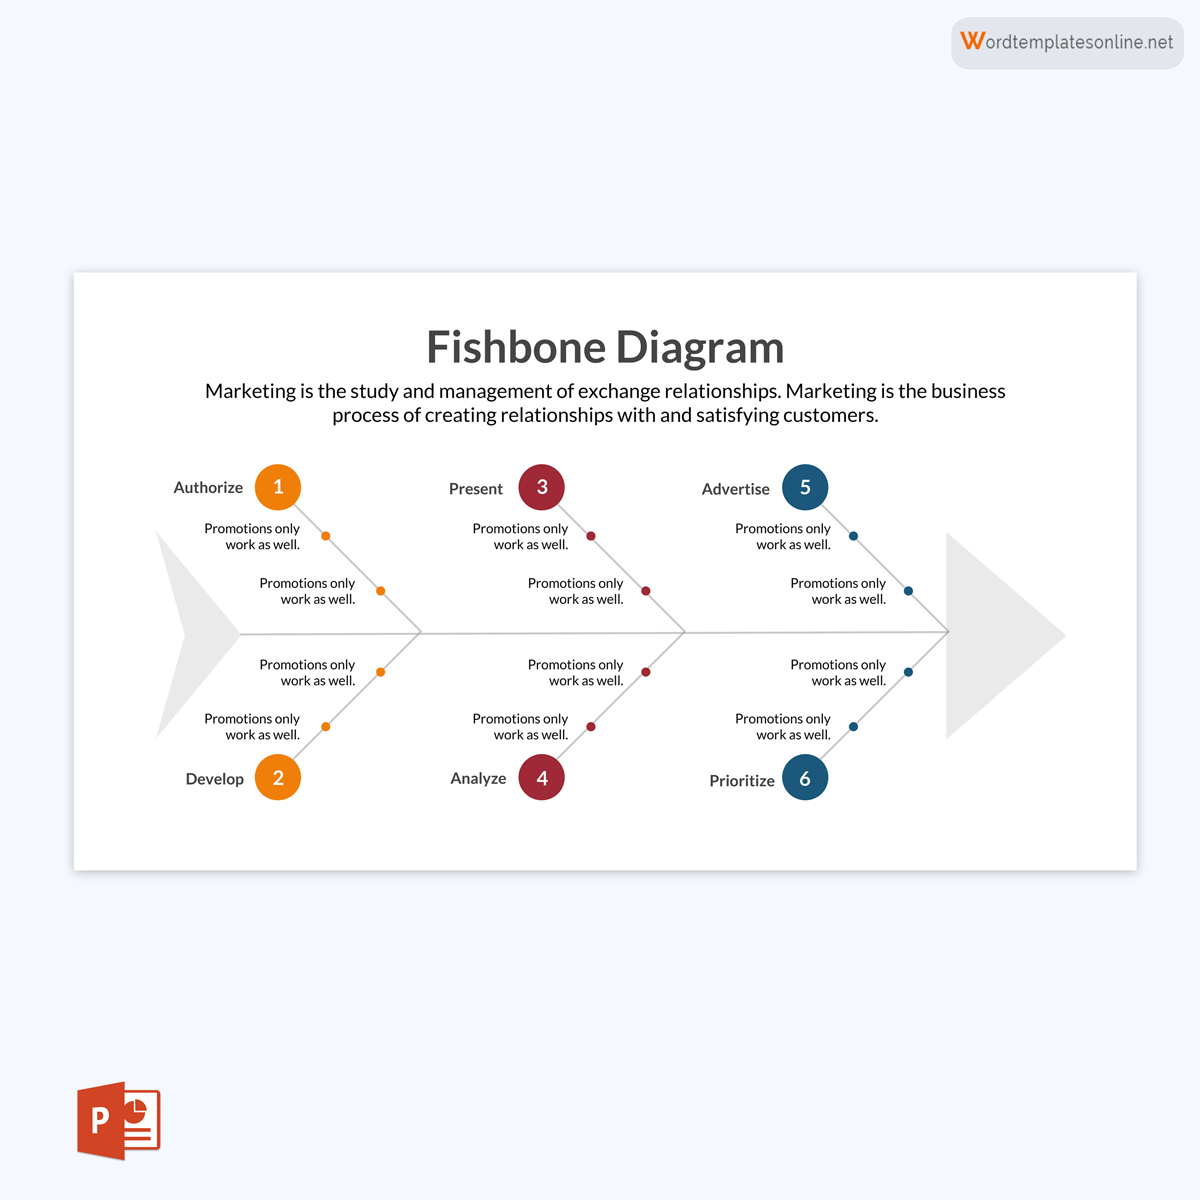
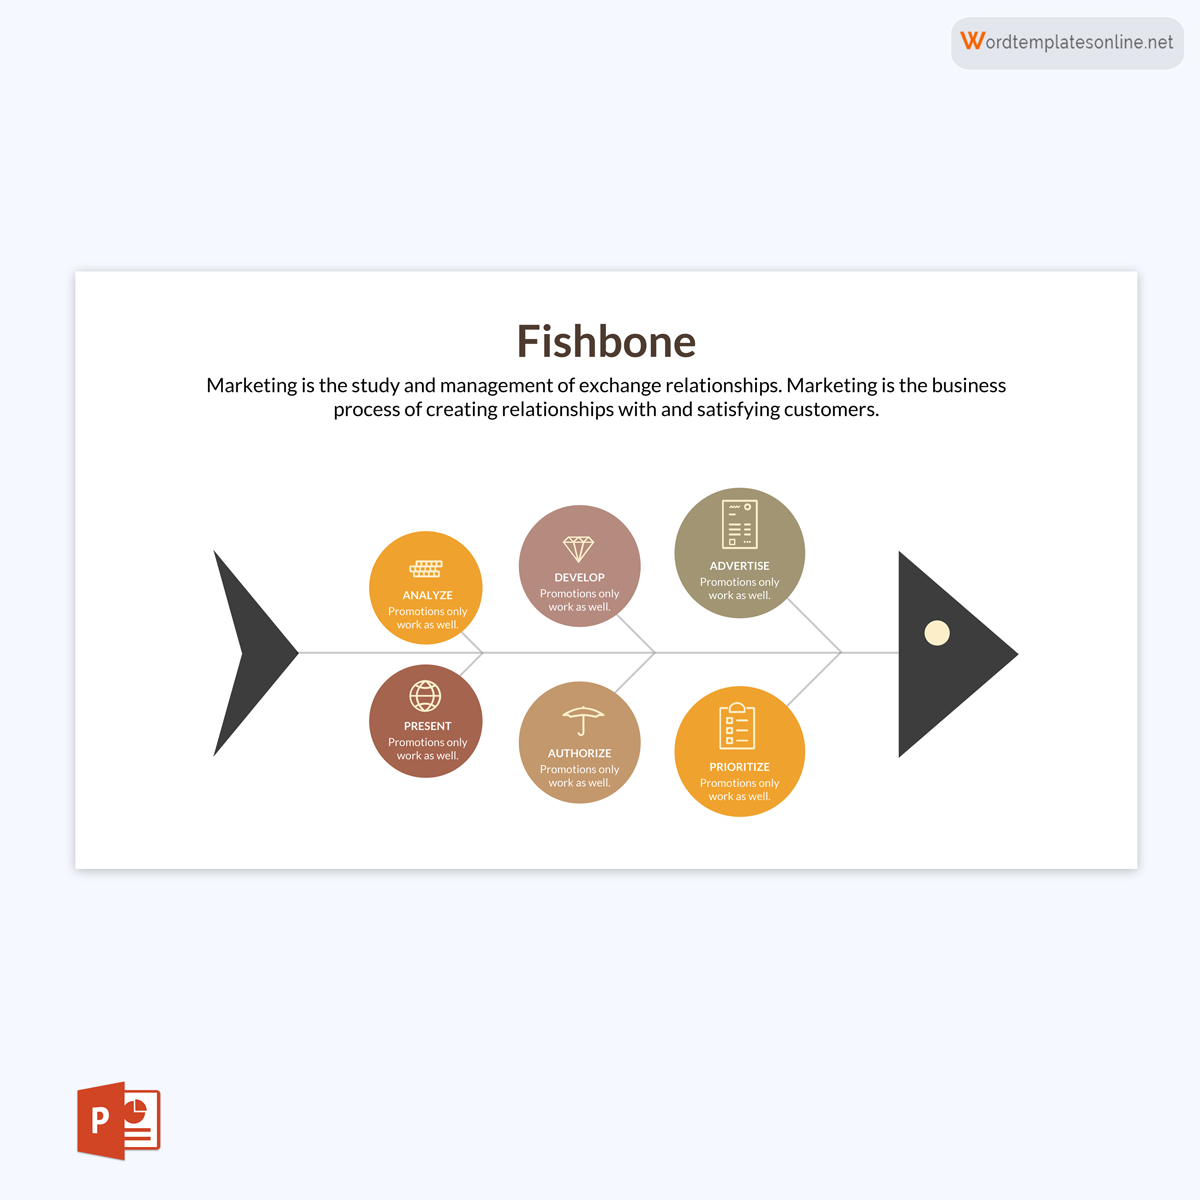
Fishbone Diagram Templates

Why You Should Use a Fishbone Diagram
The diagram can be implemented in various sectors. Below are some of the reasons why teams should aim to use the diagram:
- The diagram helps teams prioritize the significant causes of a problem and identify any other potential causes of a problem.
- It promotes brainstorming within a team when they identify potential causes of a problem.
- The diagram helps teams work together and efficiently discover the causes of a problem. The diagrams promote teamwork rather than working independently.
- It is used as a quality control tool to track the progress of a project. Risk managers can also use the diagram to identify any causes of concern within a project or system and determine ways to avoid or mitigate the causes.
- In the event of an accident, the diagram can be used to analyze the incident report to identify the root causes and measures to put in place to avoid repetition of the incident.
Different Types of It
There are different forms of the diagram. The variations are generally based on applying the cause and effect diagram. Some of these types of fishbone diagrams are described below:
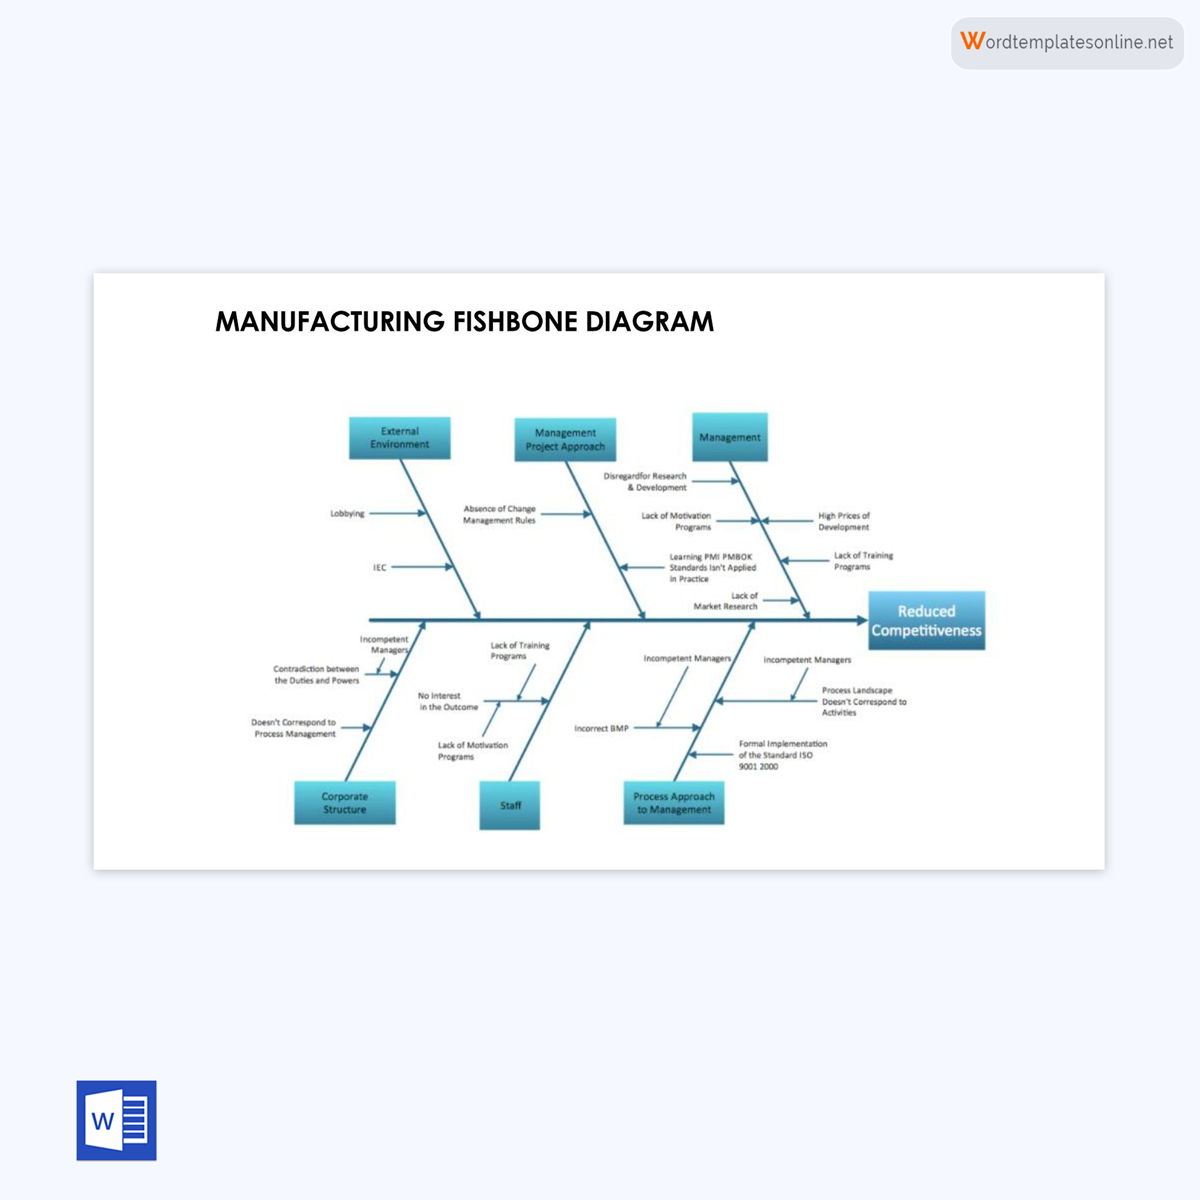
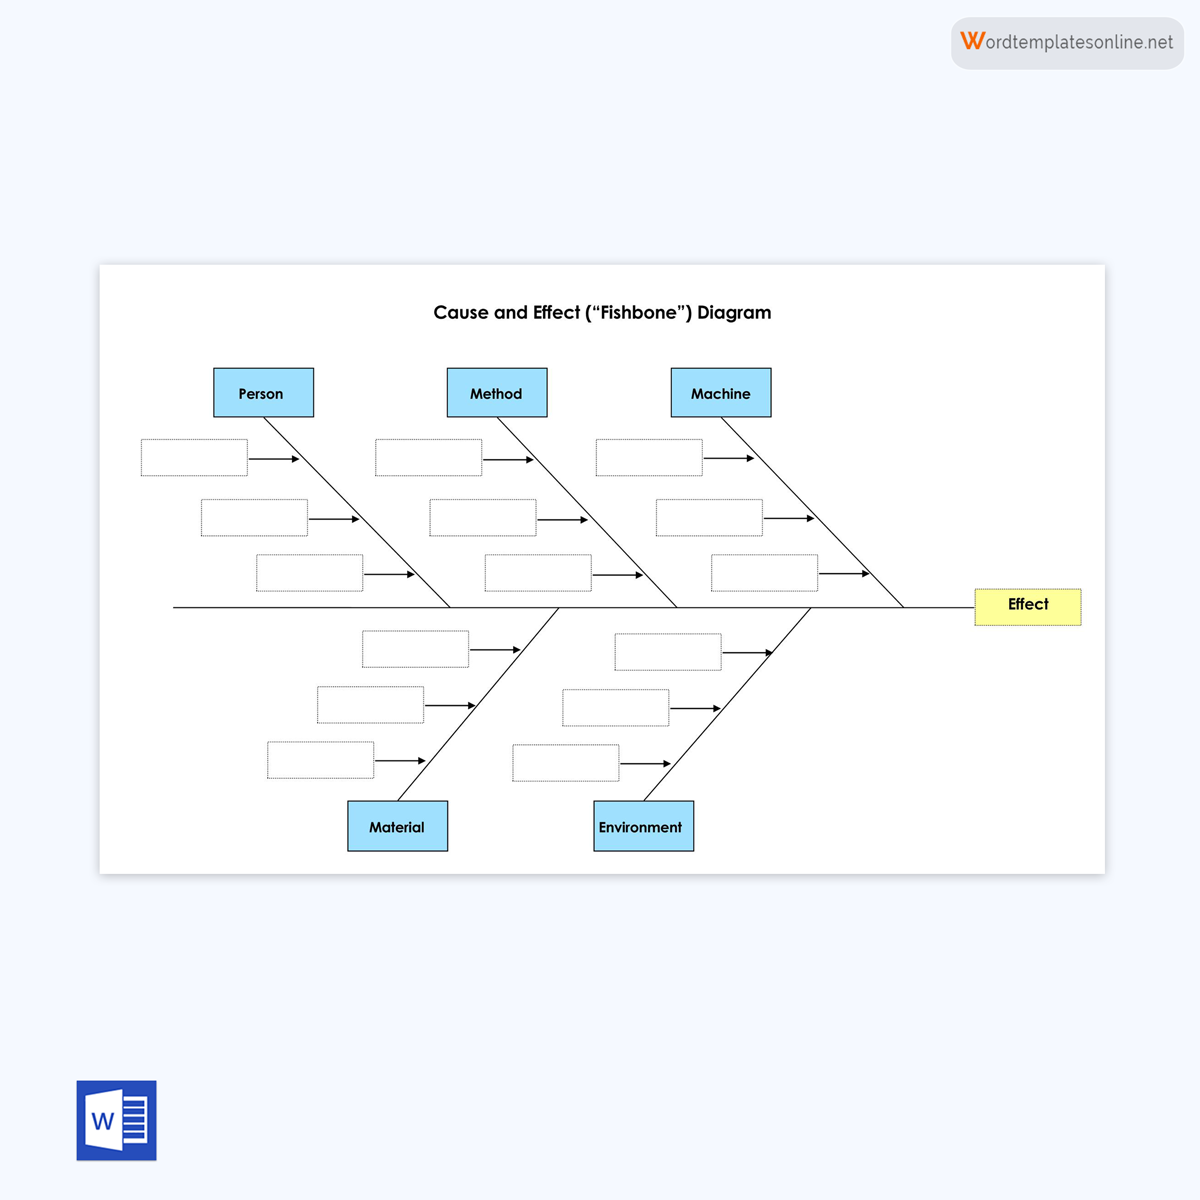
Manufacturing Fishbone Diagram Template
An Ishikawa diagram used for analyzing manufacturing processes is referred to as a manufacturing type of diagram. This type has six categories of causes representing the 6 Ms of manufacturing; Man, Machine, Material, Method, Measurement, and Mother Nature/ Milieu (Environment).
Download: Microsoft Word (.docx)
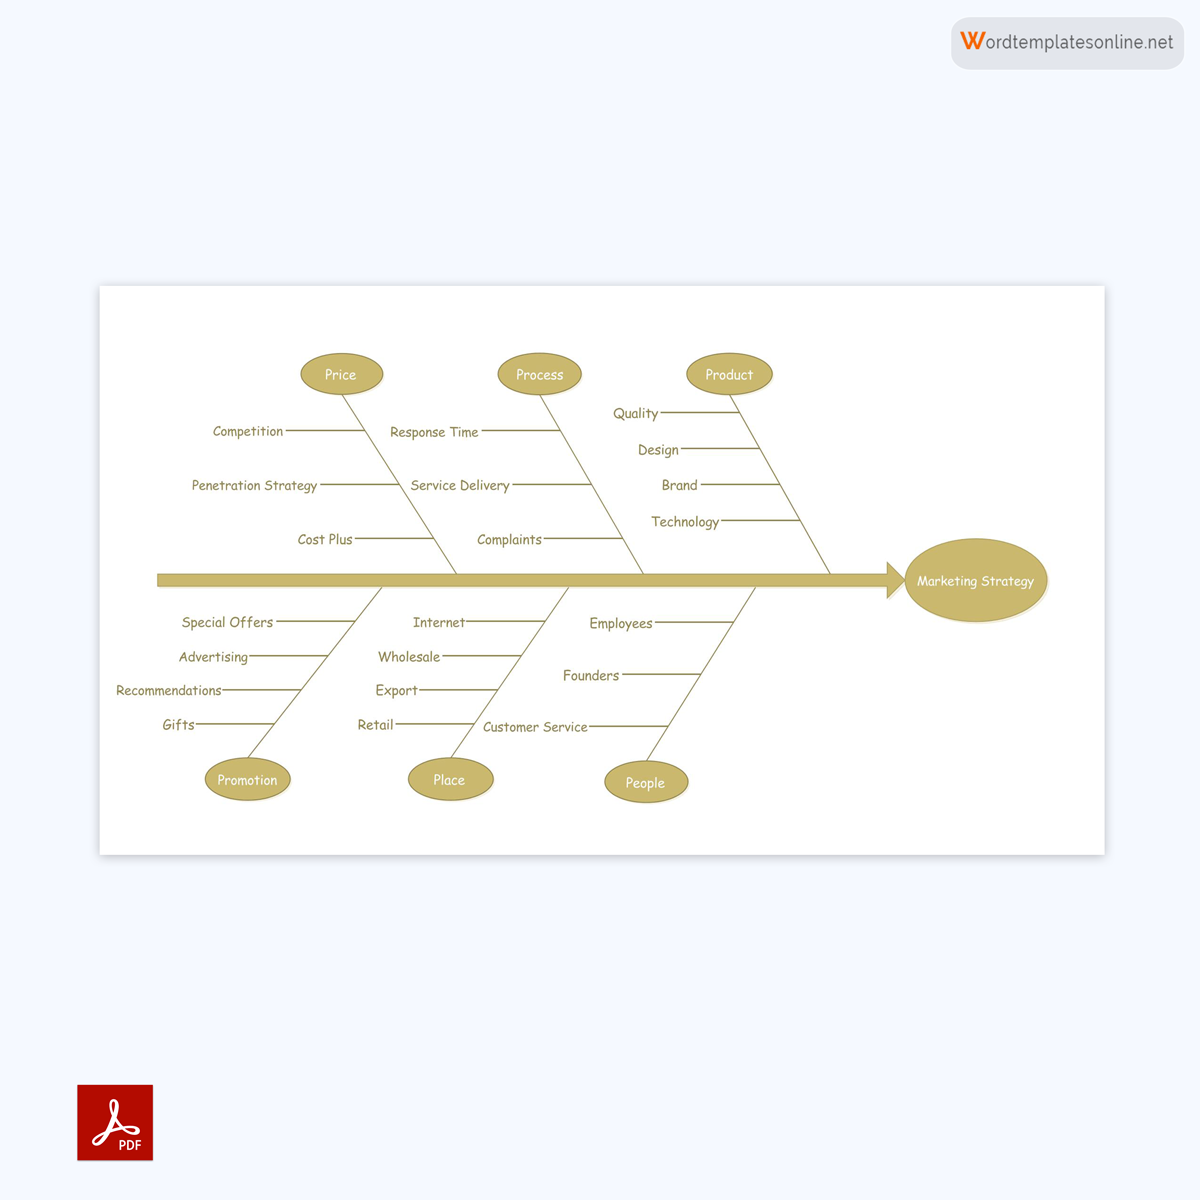
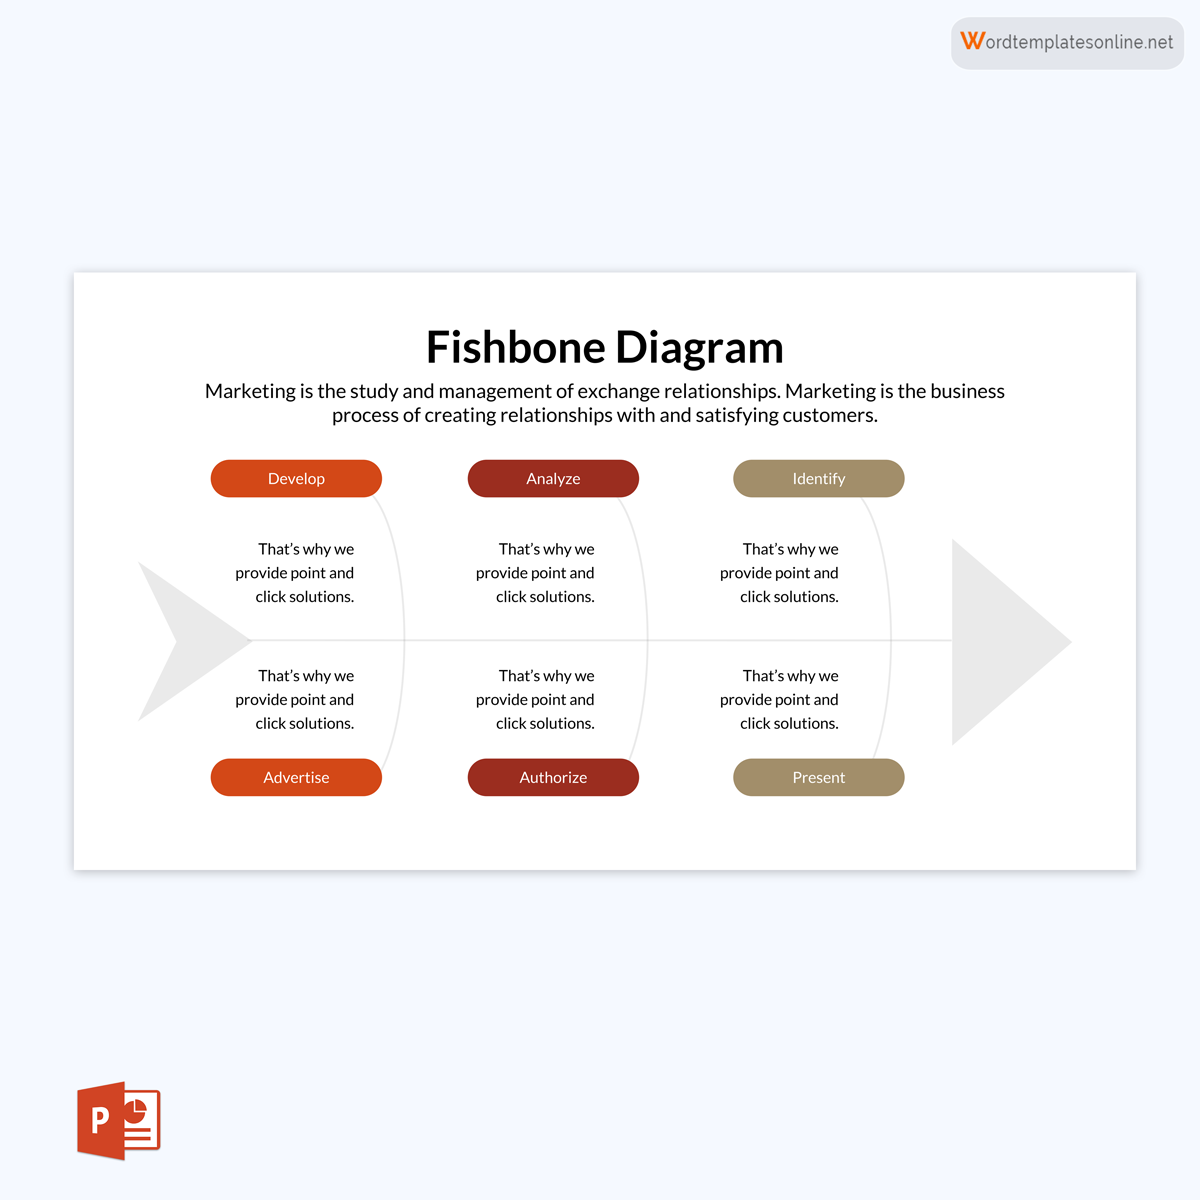
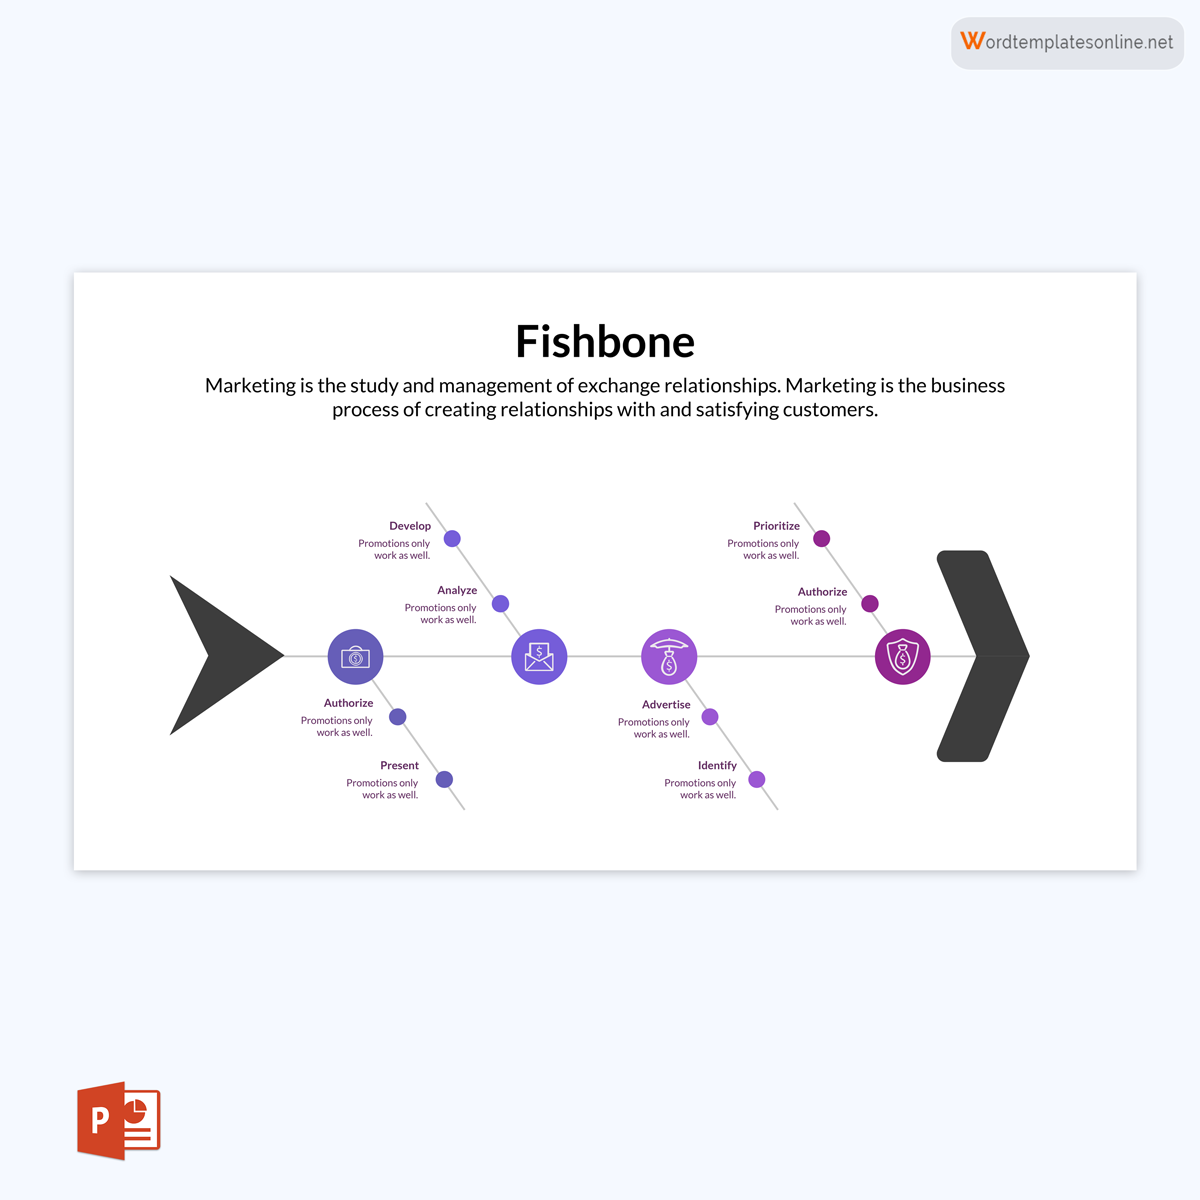
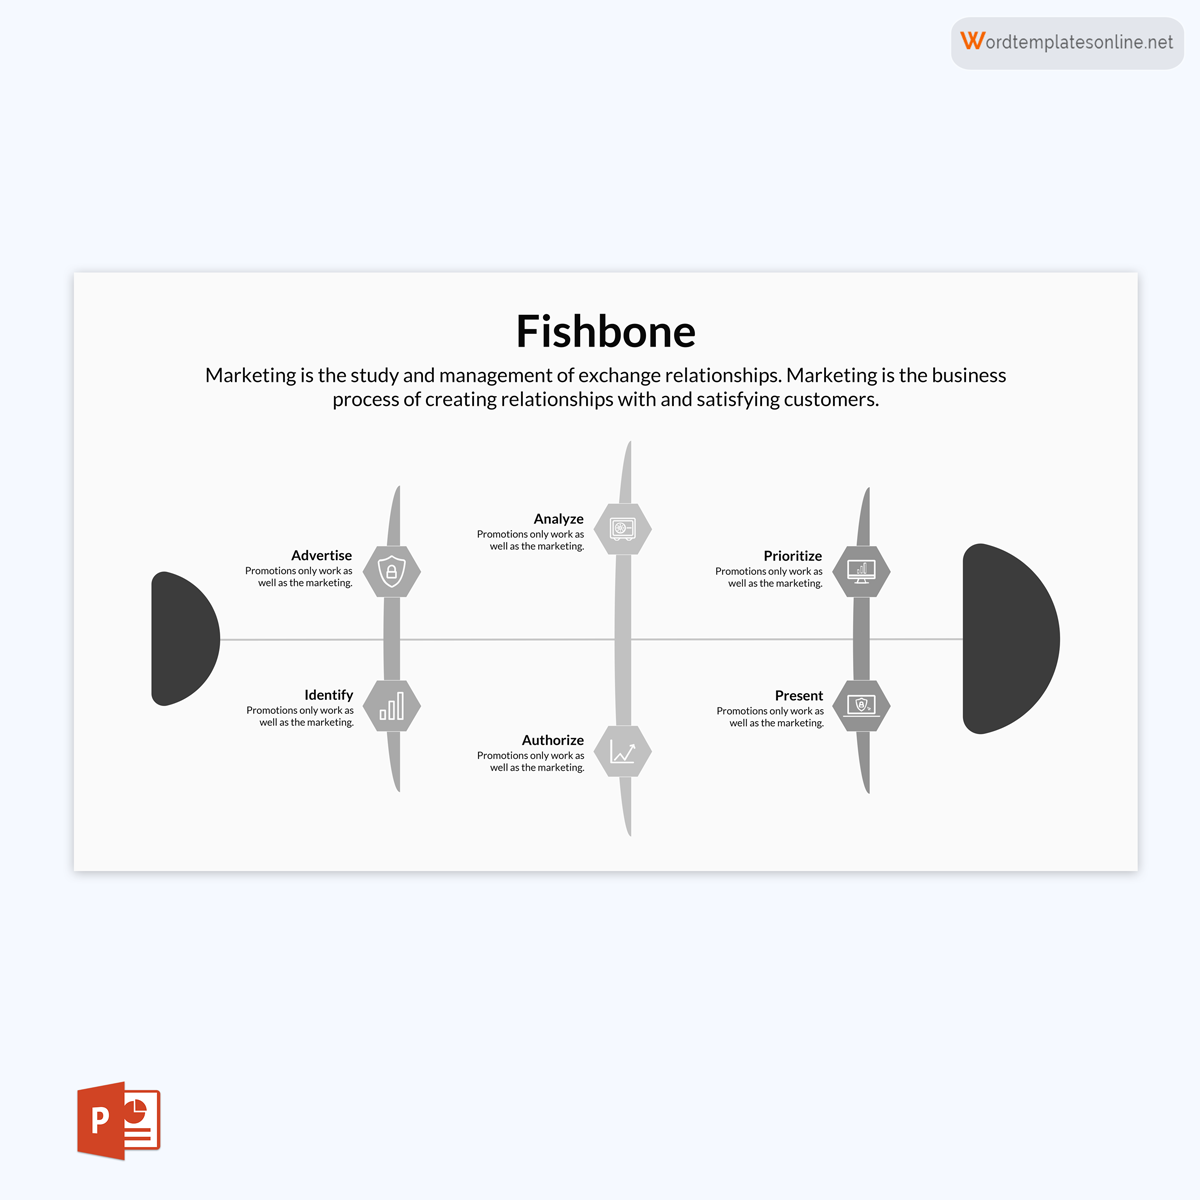
Marketing Fishbone Diagram Template
A marketing type is used when analyzing marketing processes. Marketing is a wide scoped process, and identifying the root causes of problems can be difficult without visual tools like an Ishikawa diagram. This type typically has seven categories or ribs to denote the 7 Ps of marketing; Product, Price, Place, Promotion, People, Positioning, and Packaging. Service industries use 5 Ss instead; Surroundings, Suppliers, Systems, Skills, and Safety.
Download: Microsoft Word (.docx)
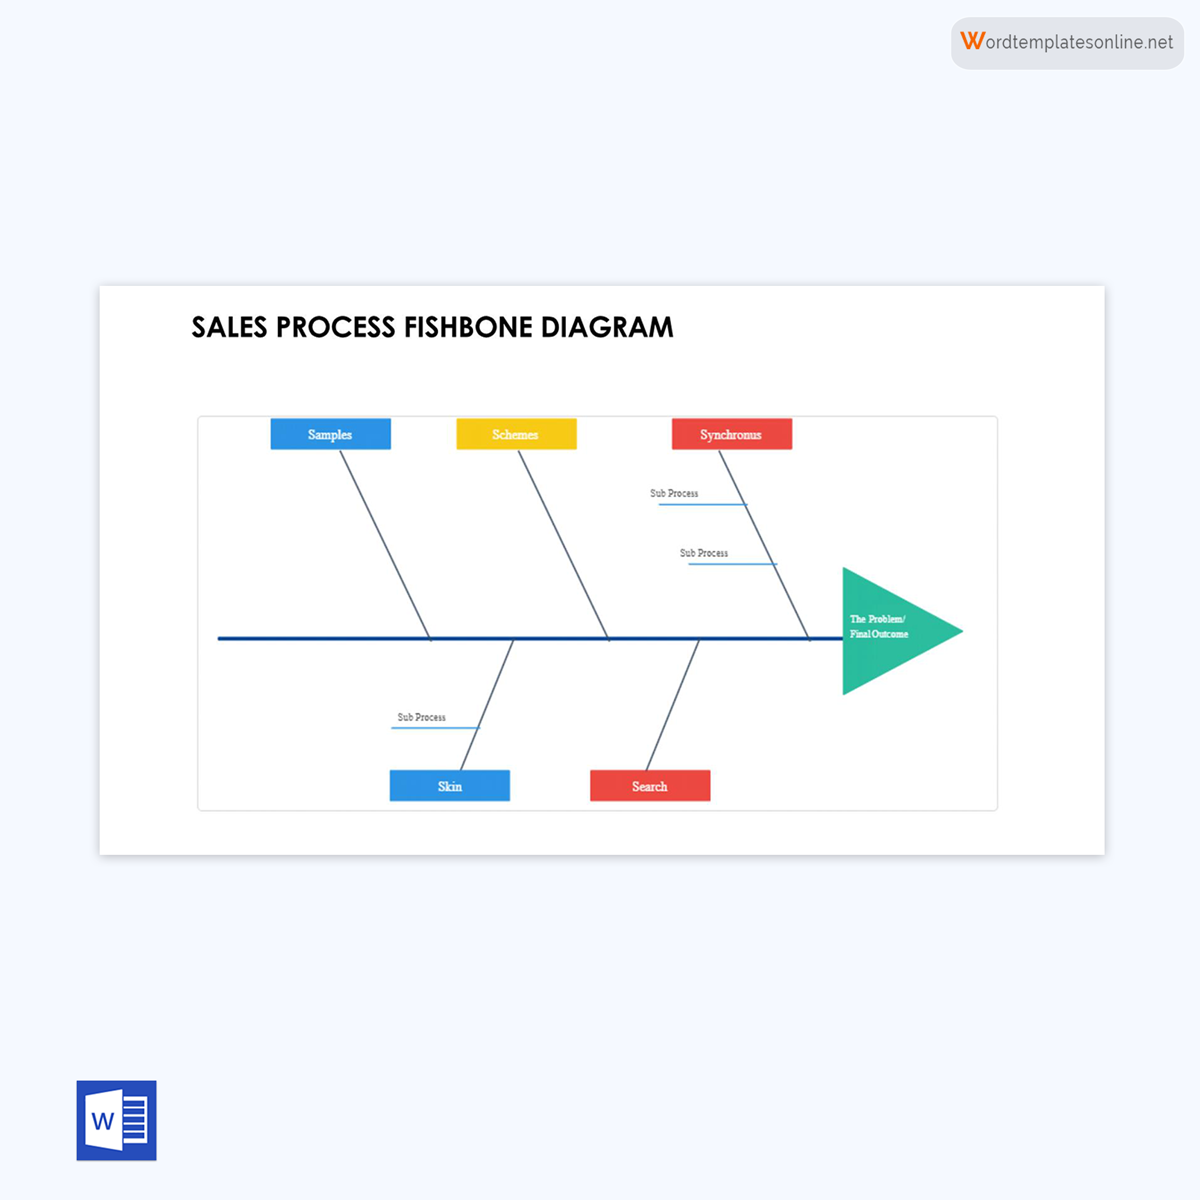
Sales Process Fishbone Diagram Template
A company’s sales team uses a sales diagram. It has five categories based on the 5 Ss of sales, namely; Samples, Synchronous, Skin, Schemes and Search.
Download: Microsoft Word (.docx)
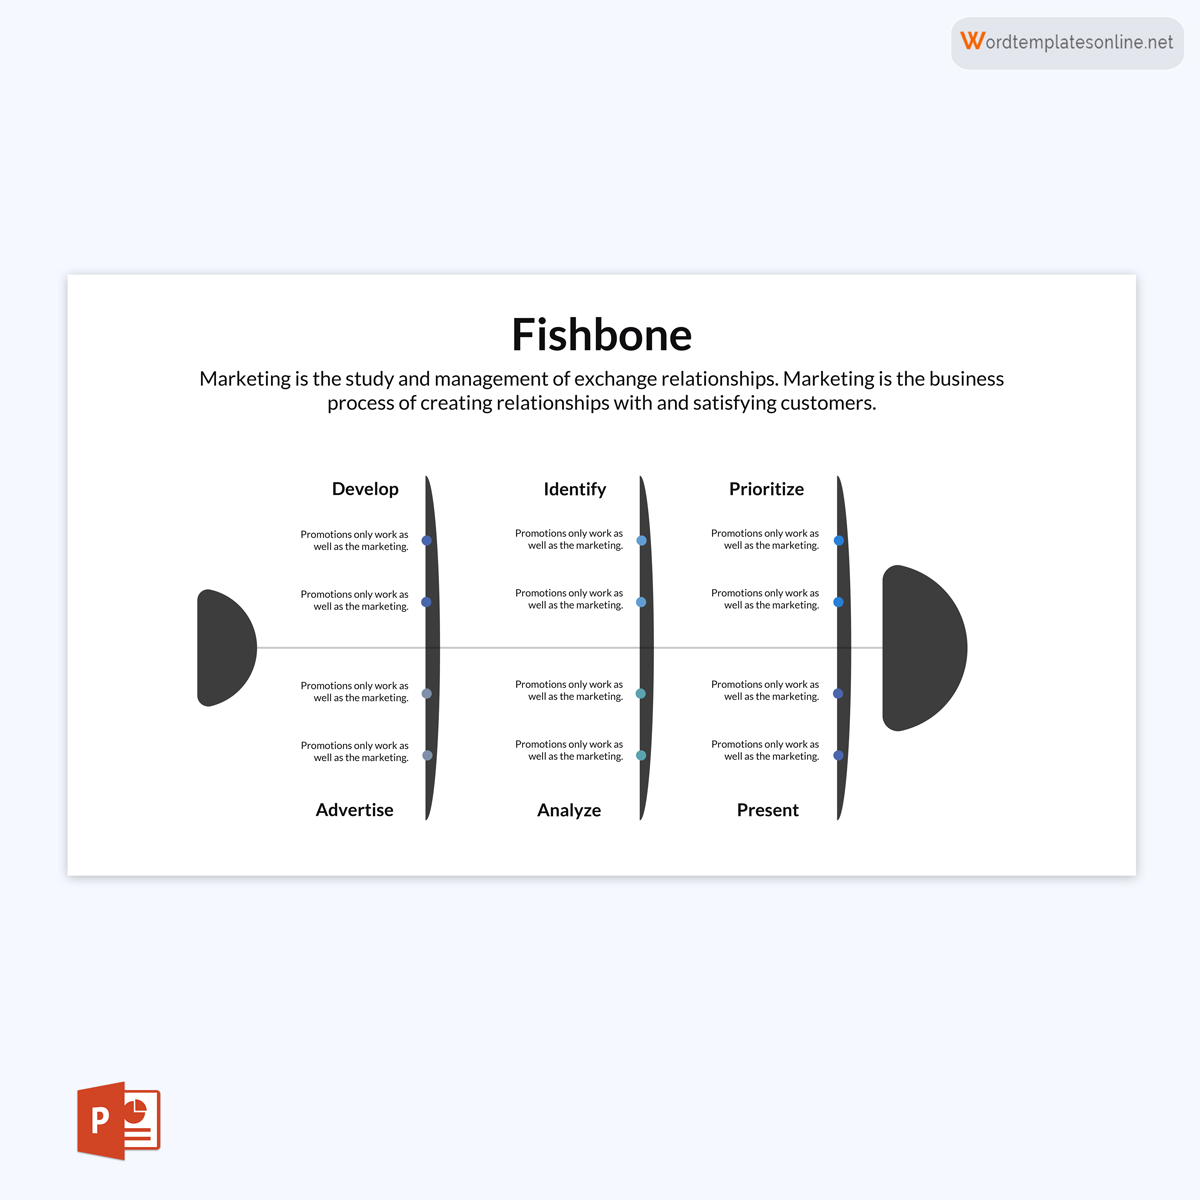
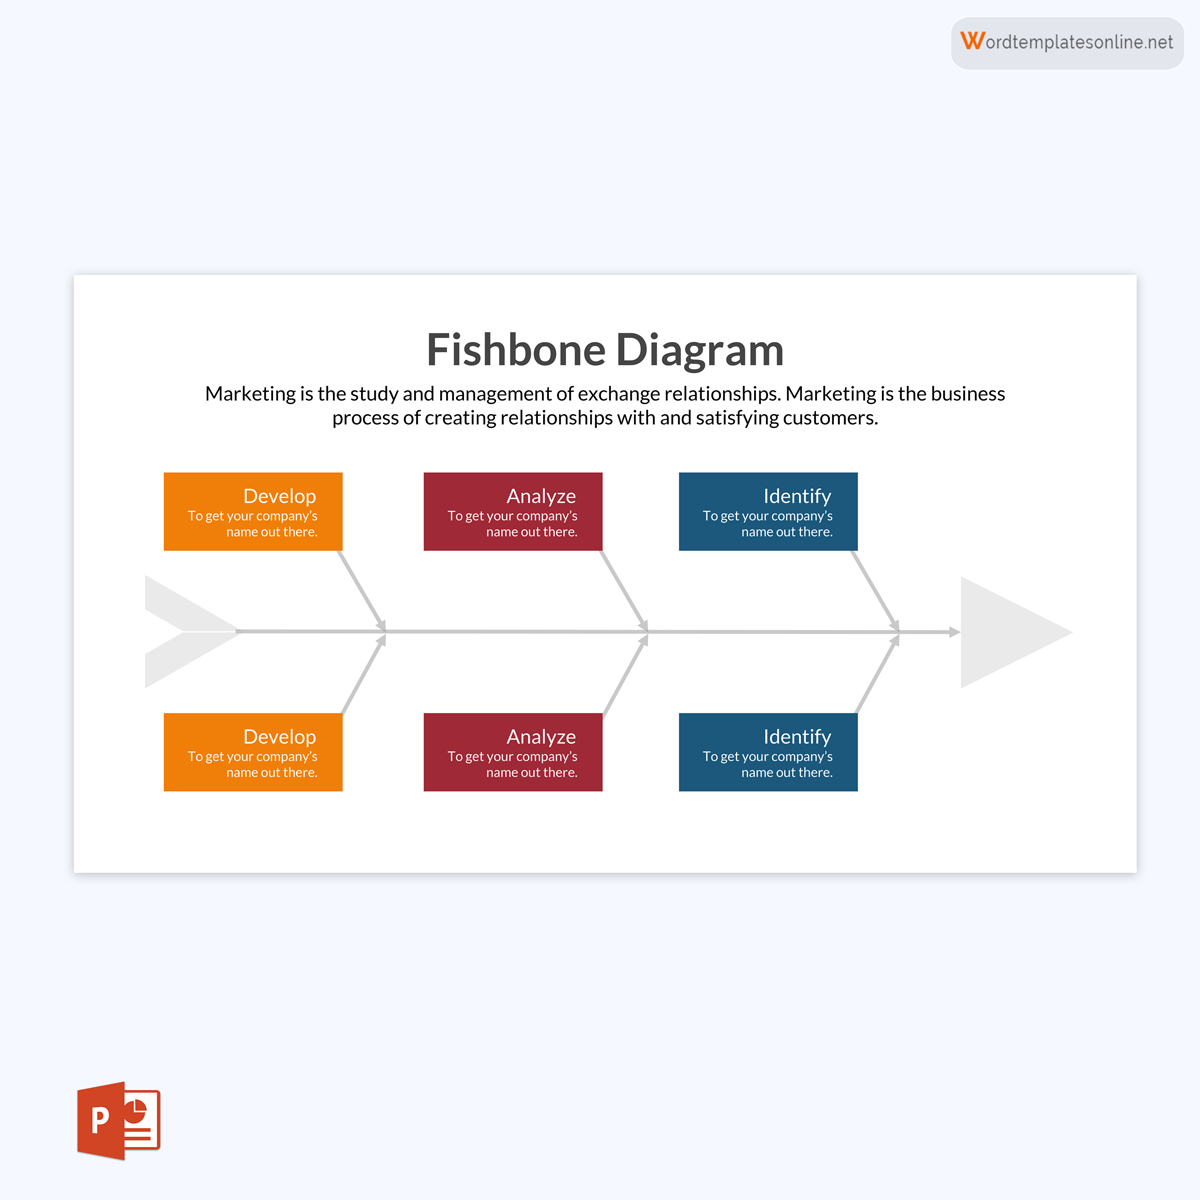
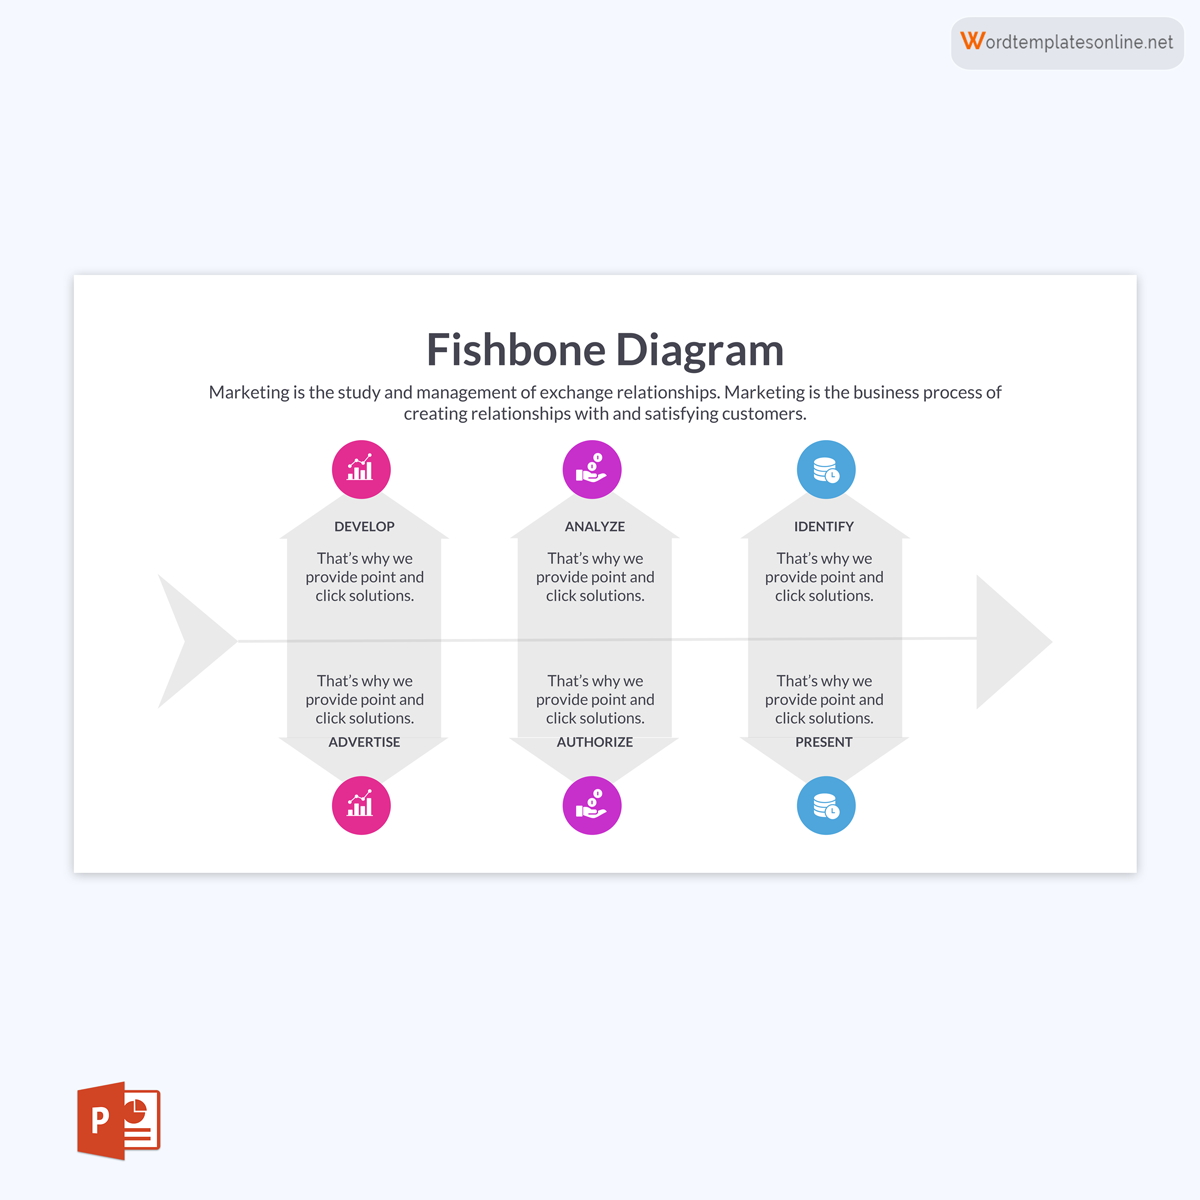
Ishikawa Diagram for Presentations Template
Presentations are summary tools for conveying information that fuses the text and visual aids. An Ishikawa diagram for presentations is used to relay the problems and proposed solutions based on a comprehensive analysis of the possible causes. In addition, it shows how the solutions were arrived at.
Download: Microsoft Word (.docx)
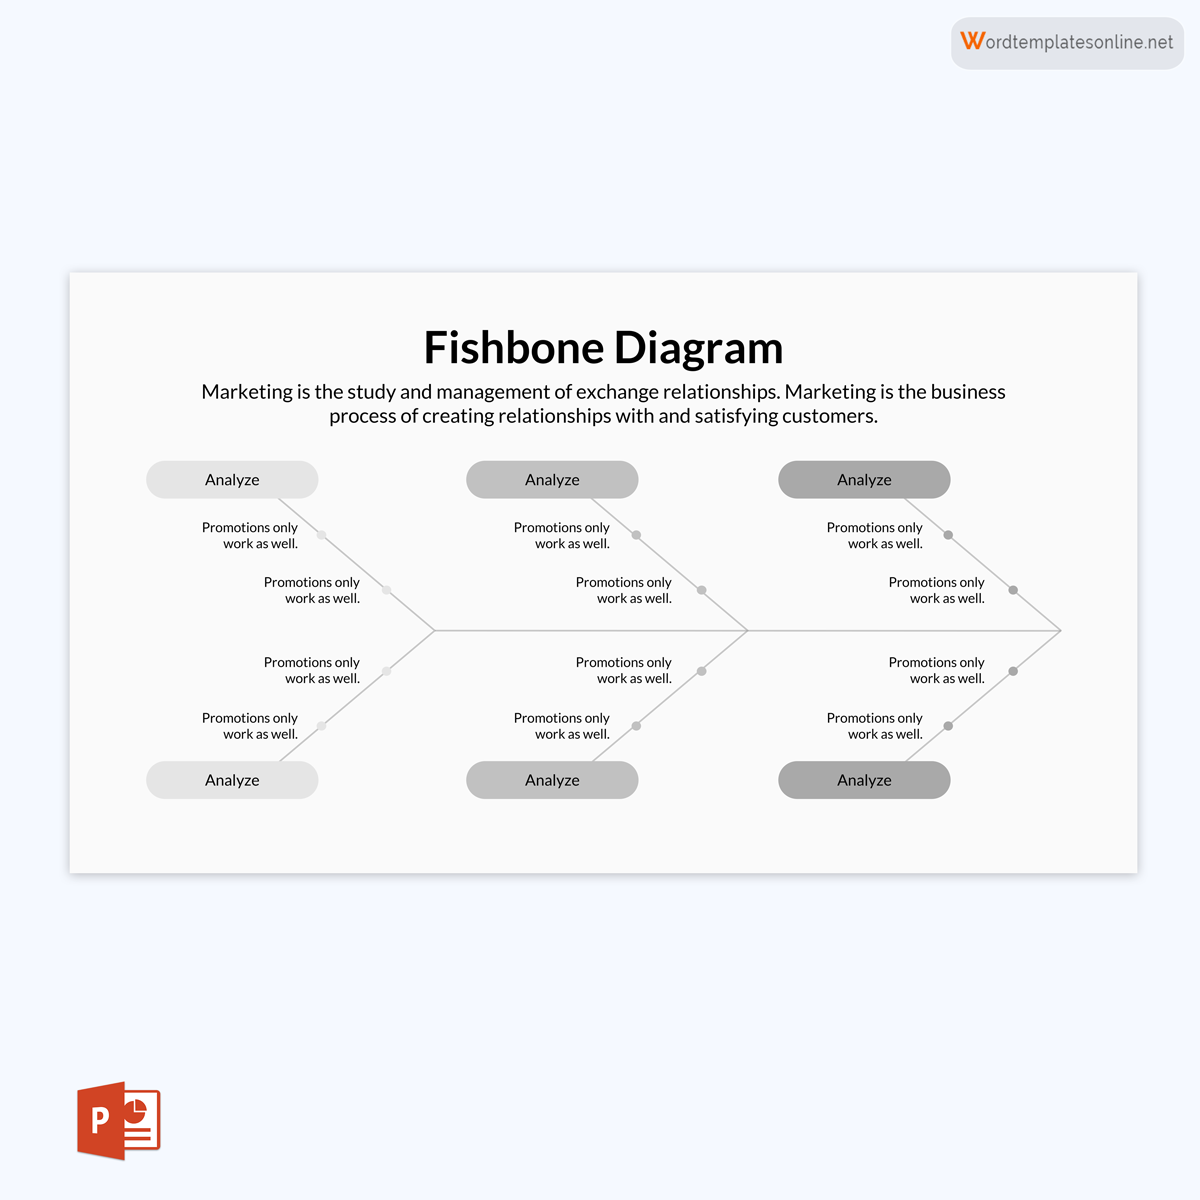
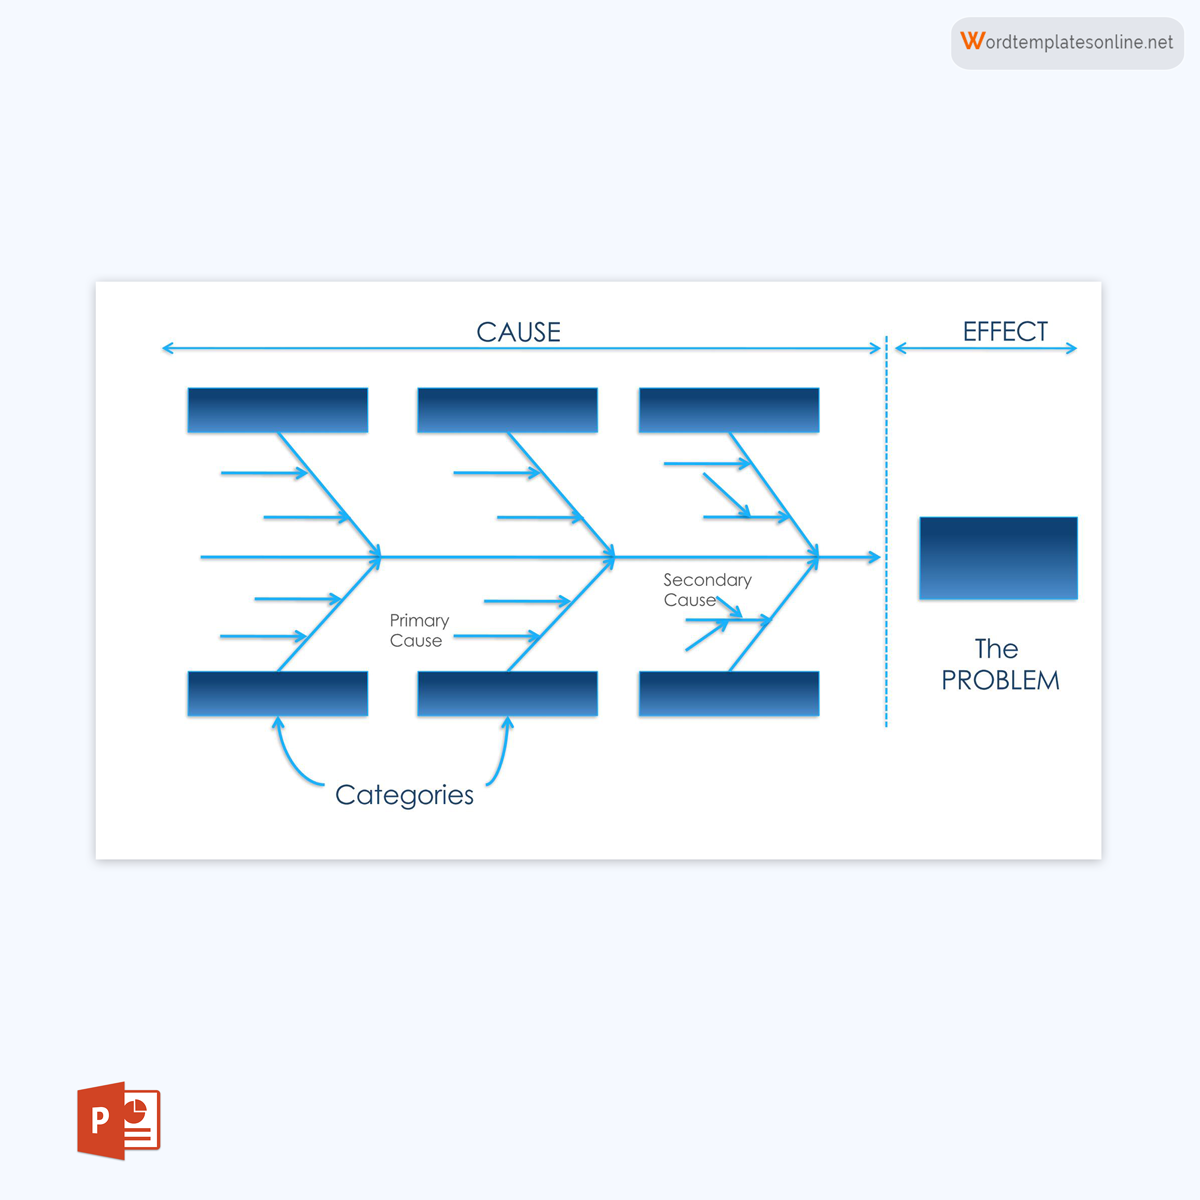
Cause and Effect Diagram Template
A cause and effect diagram is a general Ishikawa diagram applicable to different industries and departments/processes. It is not limited to one or two applications. It identifies the effect/problem and highlights all potential causes, and categorizes them accordingly.
Download: Microsoft Word (.docx)
But, How to Use It?
The procedure for using a cause and effect diagram is straightforward. This article will look into this process step by step.
They include:
Gather your team
The first step is to gather the team to be involved in the process. This is inclusive of all stakeholders who can provide insight into the problem. Since the team is remote or distributed, they should all decide on the online fishbone template that can be used.
Define the problem statement
A cause and effect diagram will typically be worked backward. Therefore, the problem ought to be defined next through a problem statement. The problem statement should state the problem and how and when it occurs. The problem statement forms the head; a horizontal arrow pointing to the head should be drawn.
Identify the root cause
Next, brainstorm to determine significant categories of causes of the effect or problem. For example, the causes can be categorized as methods, methods, machines, materials, systems, equipment, and environment. The causes should be branches from the “backbone” or central arrow.
Uncover new potential causes
After identifying the leading root causes, brainstorm to determine the leading causes’ potential causes. The sub-branches from the ribs represent these causes. To execute this process, examine the following factors; the people, procedures, policies, and plant for each main problem.
Analyze the diagram
Once all the potential causes of the leading causes have been identified, the team should analyze the diagram to have a conclusive outcome. Use tools such as 5 Whys, surveys, and investigations to investigate the problem or effect further. Note down the potential cause(s) identified to be contributing to the problem.
Agree on next steps and outcome
Lastly, once you have completed the diagram, the team should indicate the actions and responsibilities proposed to mitigate or eliminate the problem. The diagram can assign tasks to each team member and allocate deadlines.
Important Considerations
Several things have to be considered to ensure a good cause and effect diagram is prepared, and every team member is involved in the preparation and analysis of the diagram.
They include:
Communicate the objective
Each team member must be informed of the objective of the meeting beforehand. This ensures everyone comes prepared and informed on the subject matter. This way, team members can have more to contribute to the meeting.
Show a fishbone diagram example
At the start of the meeting, a well-crafted fishbone sample should be presented to the participants. Let everyone have an idea and understanding of the expected outcome of the meeting. The sample can be used for reference.
Include the potential causes
Ensure that all possible causes of the problem are brought forth. Try to cover as many potential causes as possible and practice inclusivity; all members should be allowed to brainstorm and propose any potential causes they can identify. Then, list the potential causes or have each member write their individual causes on sticky notes and stick them on the whiteboard.
Highlight and explain potential causes
Potential causes should be explained, not just listed. It is best to have each member explain any cause they highlight as they will usually be most suitable to give a background for their reasoning and perspective.
Manage time
Observe time. Practice proper time management by allocating each member specific timeframes to discuss their potential causes. Time allocation can be allocated based on the relevance of the causes; high-priority causes should start.
Frequently Asked Questions
The diagrams can be drawn on a whiteboard or infinite canvas. Alternatively, they can be drawn using templates that typically come pre-designed.
In the diagram, the head represents the problem or effect. Each rib (branch) from the spine represents the leading cause of the problem. Each sub-branch represents causes that initiate the leading causes. Ordinarily, the diagram will be facing right and must be written from right to left.
About This Article