Weight directly impacts a person’s health. It also influences how people feel about themselves and thus must be monitored frequently. So, people embark on a weight loss journey whenever they gain too much or when their weight begins to fluctuate around a certain level.
It is an entire journey that requires a lot of discipline and dedication. A weight loss chart from that point becomes an essential tool to keep track of the results from exercising, dieting, and other practices.
This chart is a written log that outlines your weight management (both diet and exercise) routines. It also tracks how much you have lost, your current weight, and how long you have exercised. It helps one to be accountable for their overall lifestyle and what they consume in their diet.
Sticking to your journey is challenging if your diet plan is not working for you and your lifestyle does not motivate you enough. Therefore, you need to track the progress of your plan to ensure you are headed in the right direction. Diet is a significant factor in it.
Your calorie intake regulates weight. You gain weight if you consume/take in more calories than you use. If you consume fewer calories than you use up, you lose weight. Weight loss thus involves consuming calories within your limits and burning the required calories simultaneously.
However, you need to take additional measures other than observing your calories to achieve a better and positive outcome overall. You need to have a balanced diet in your plan and make healthy choices like avoiding foods that lead to more health complications, such as blood sugar and high cholesterol.
This article discusses how to create a weight loss chart, its use, and tips on how to make the chart effective.
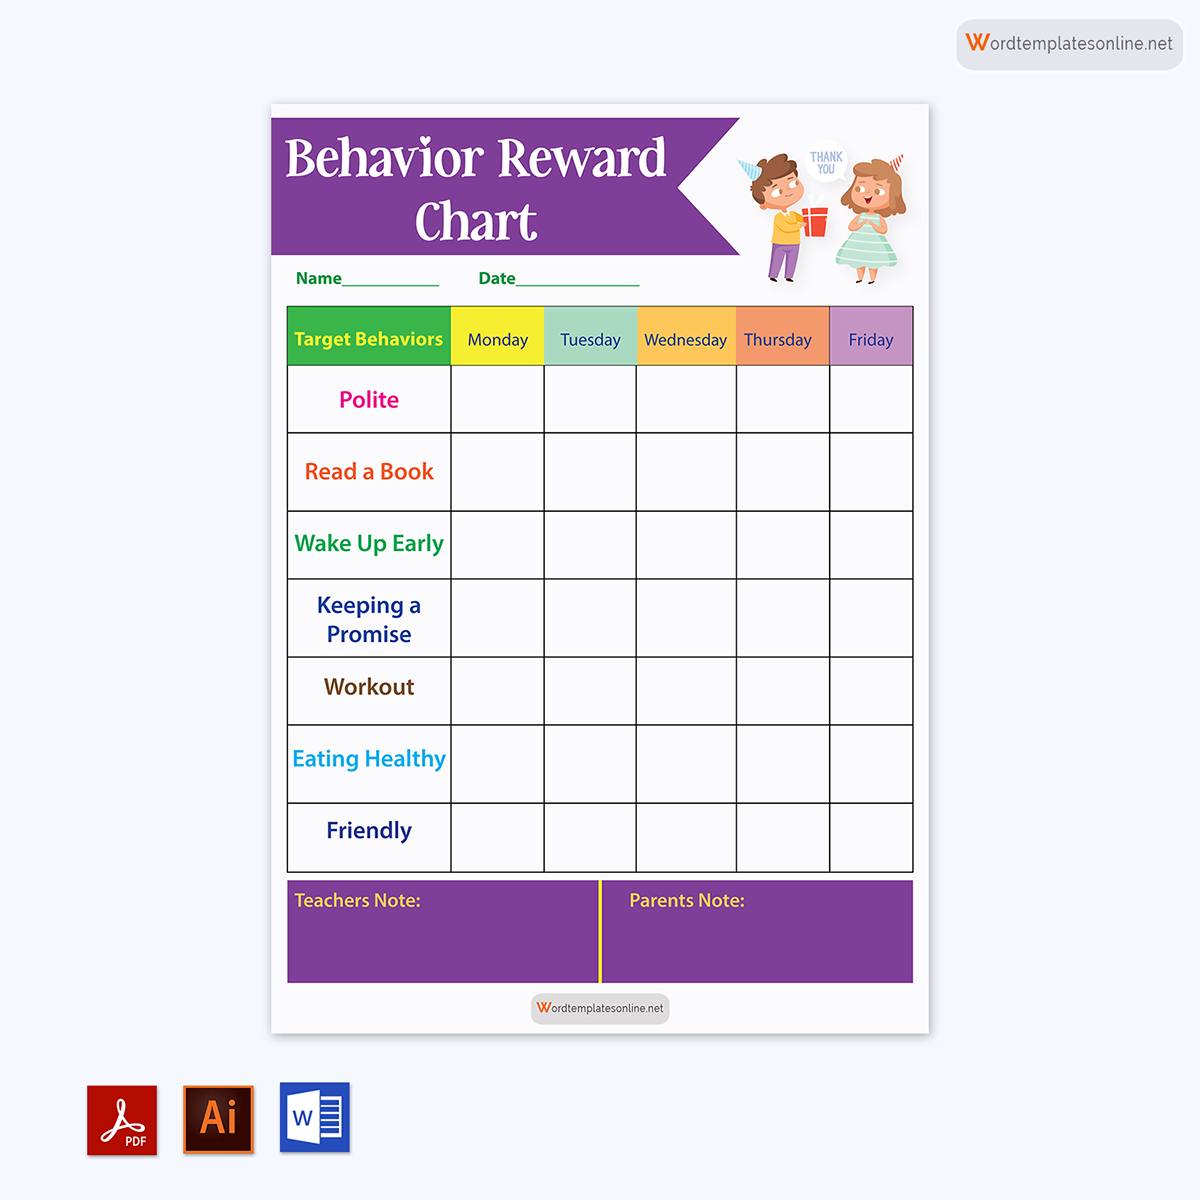
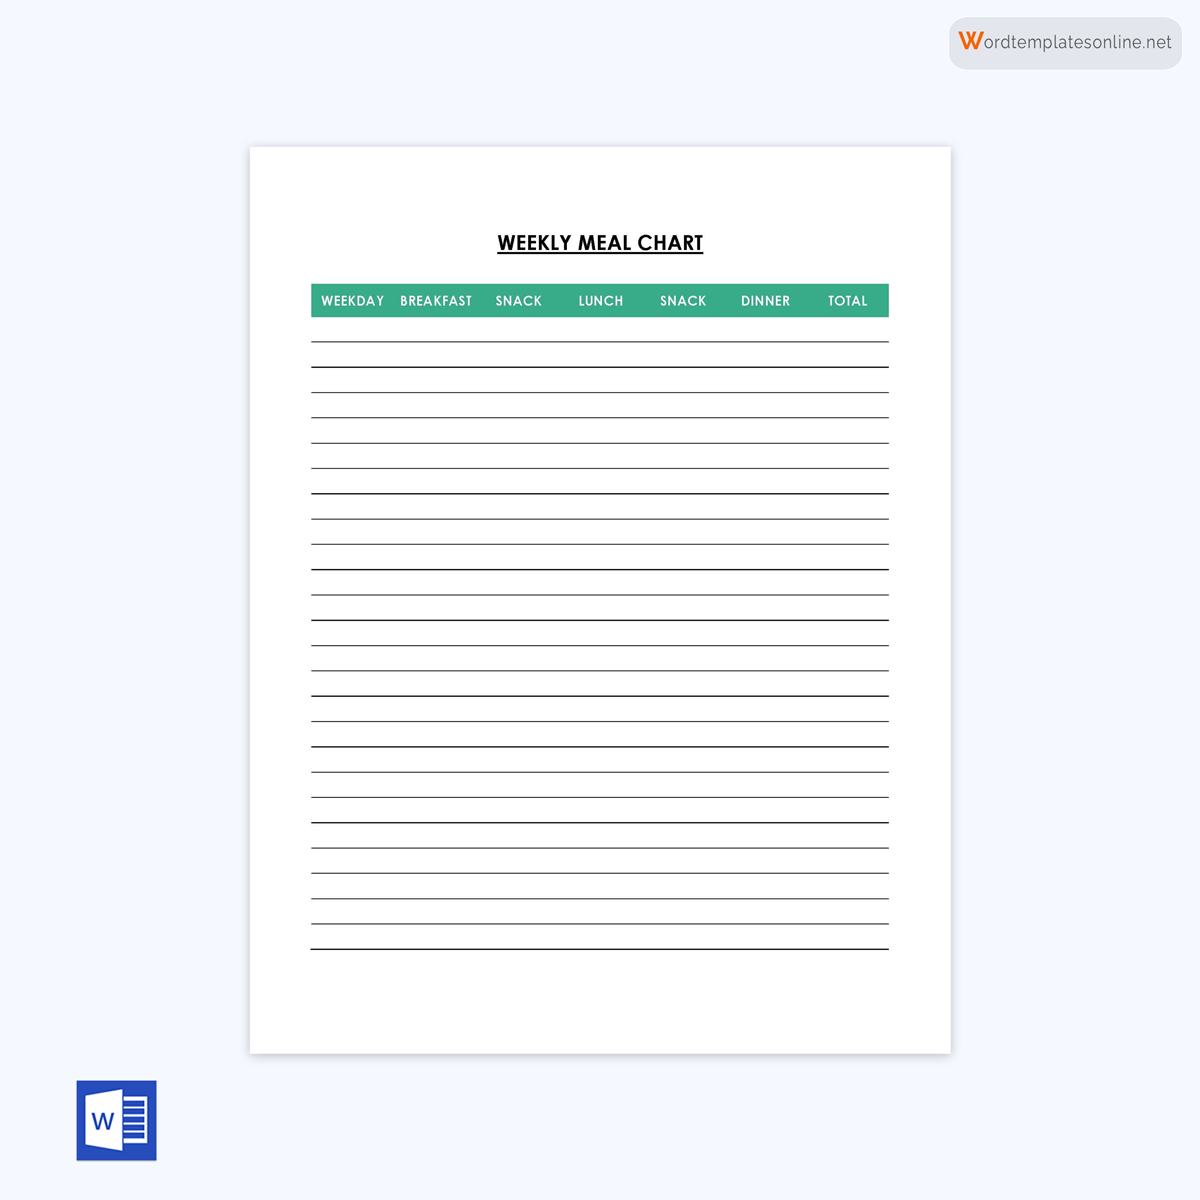
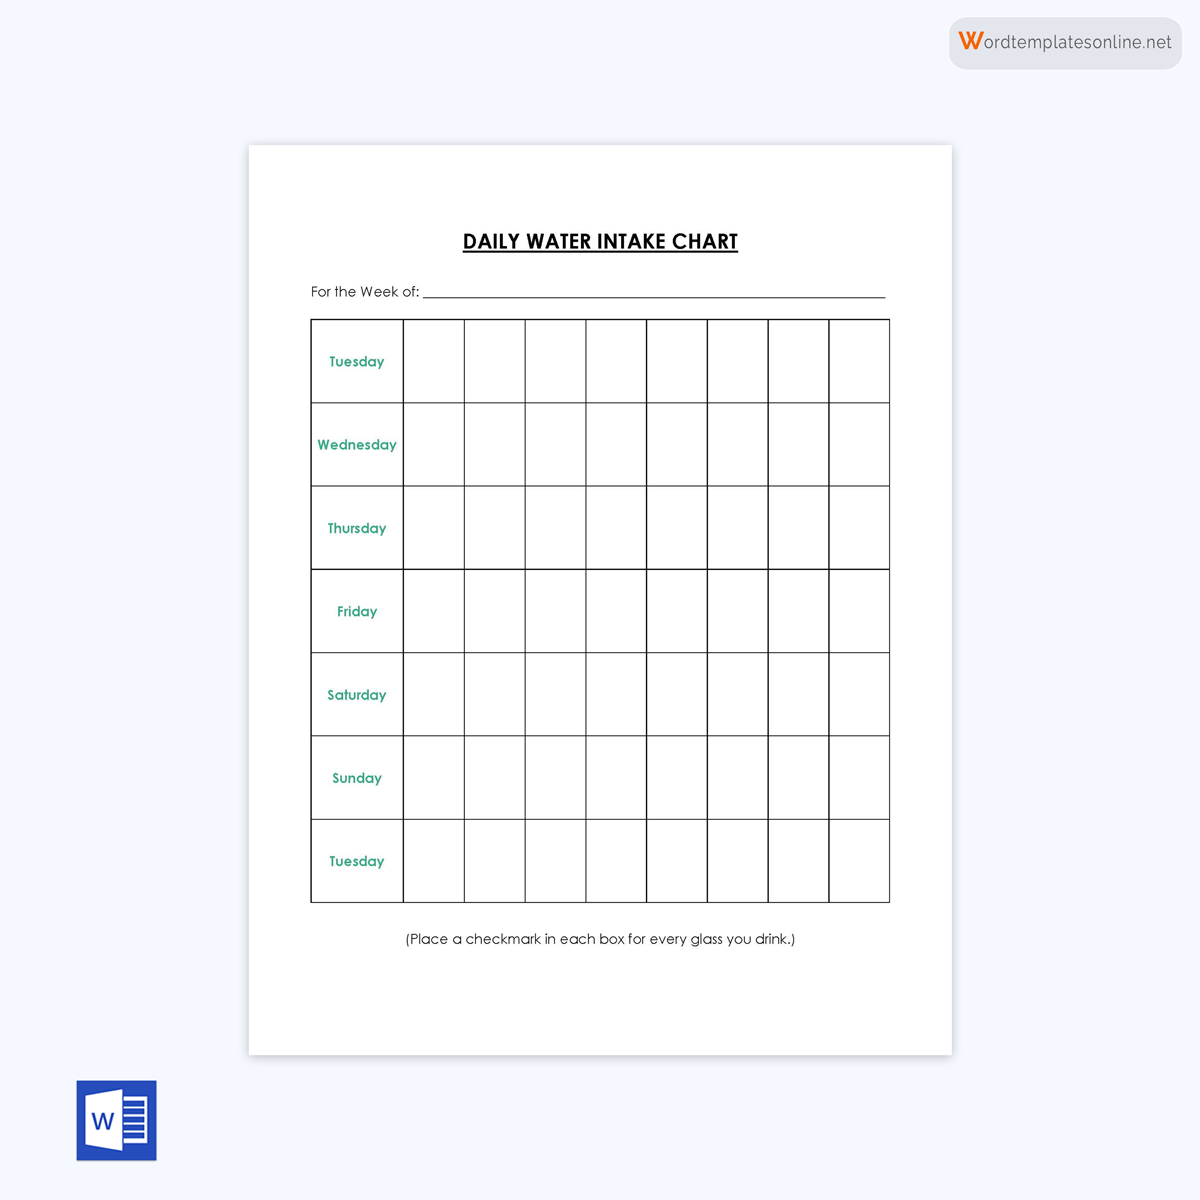
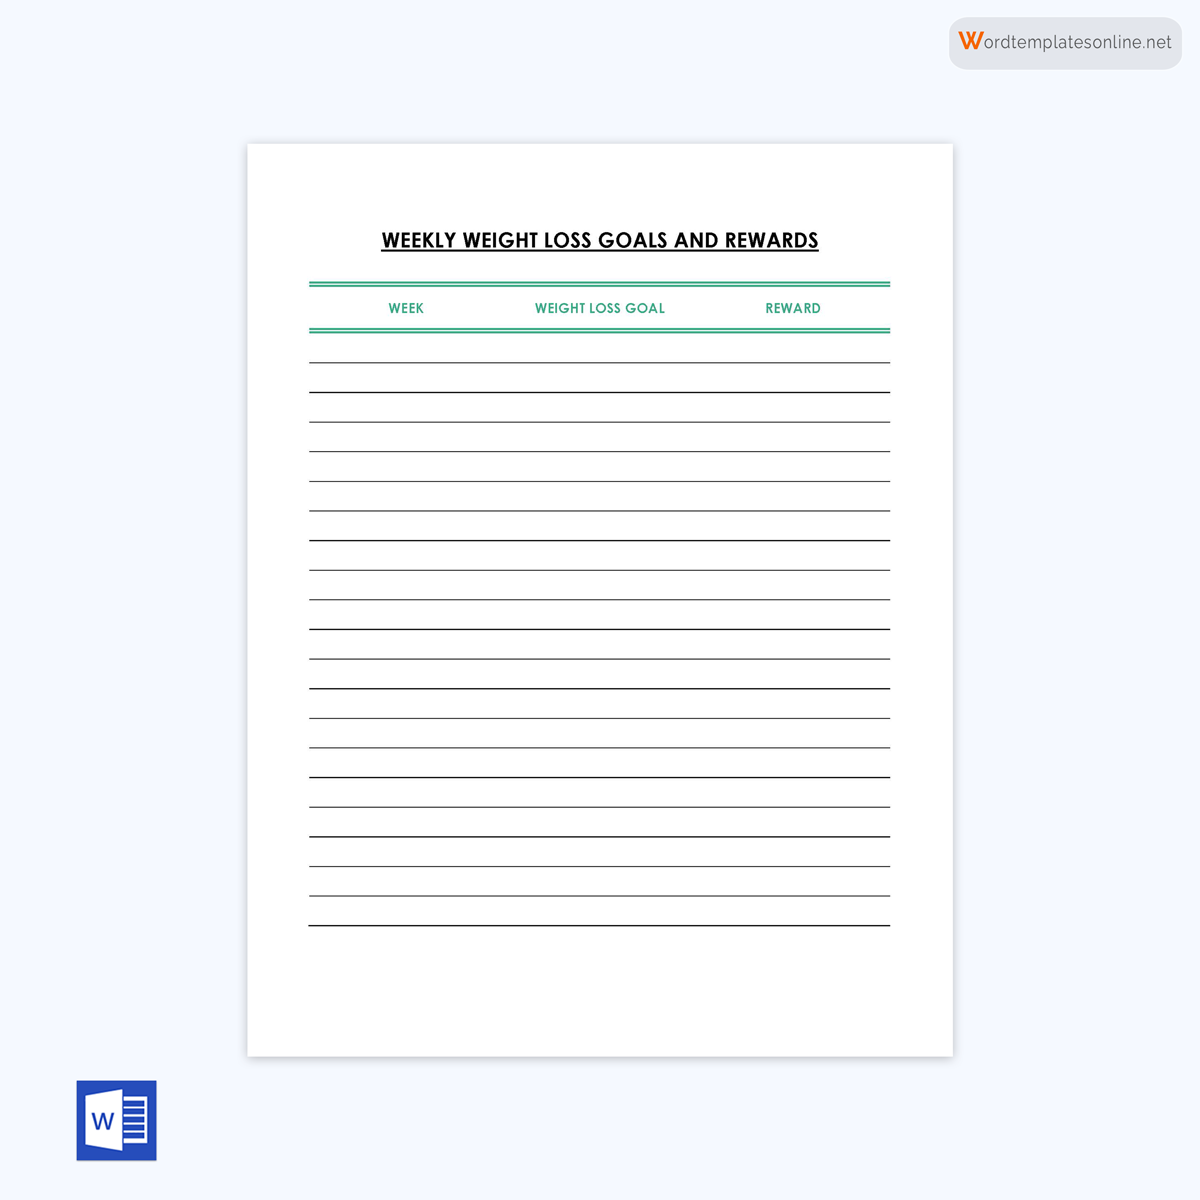
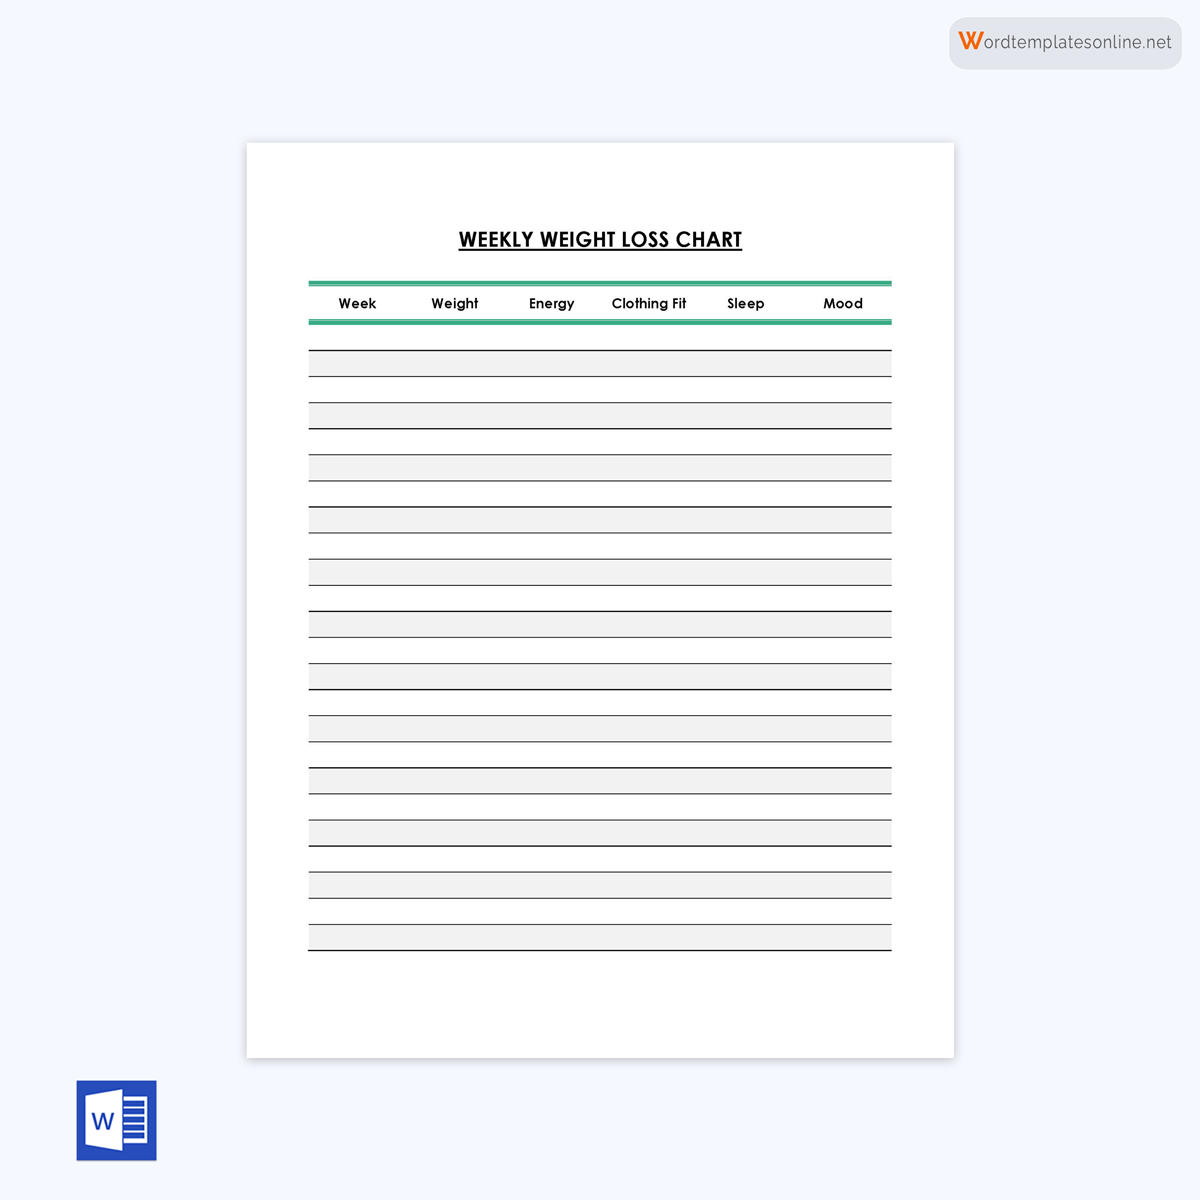
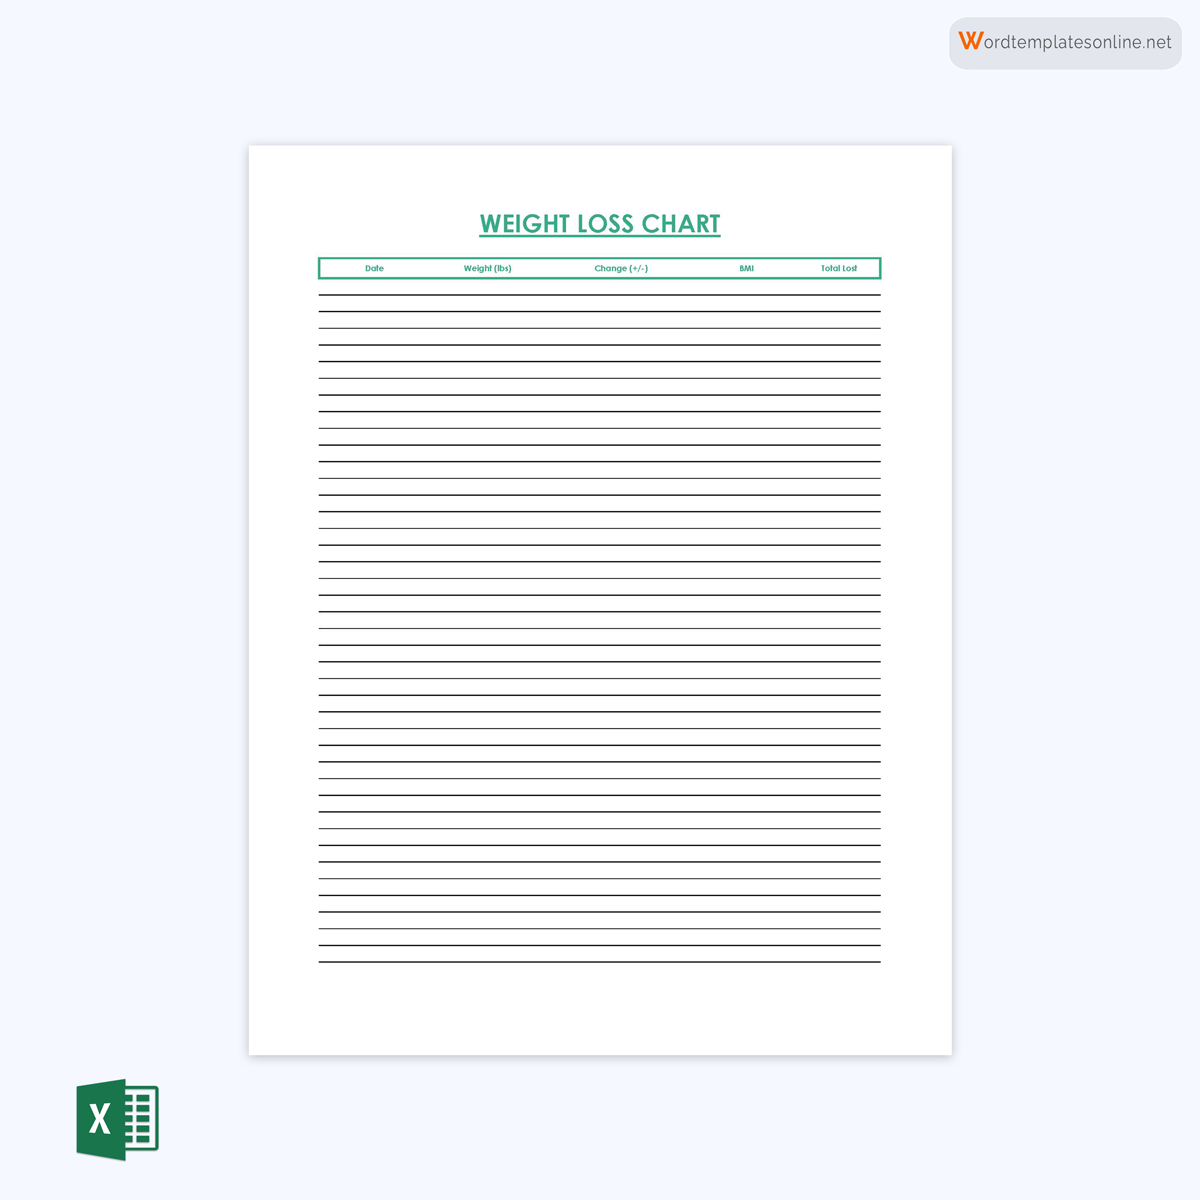
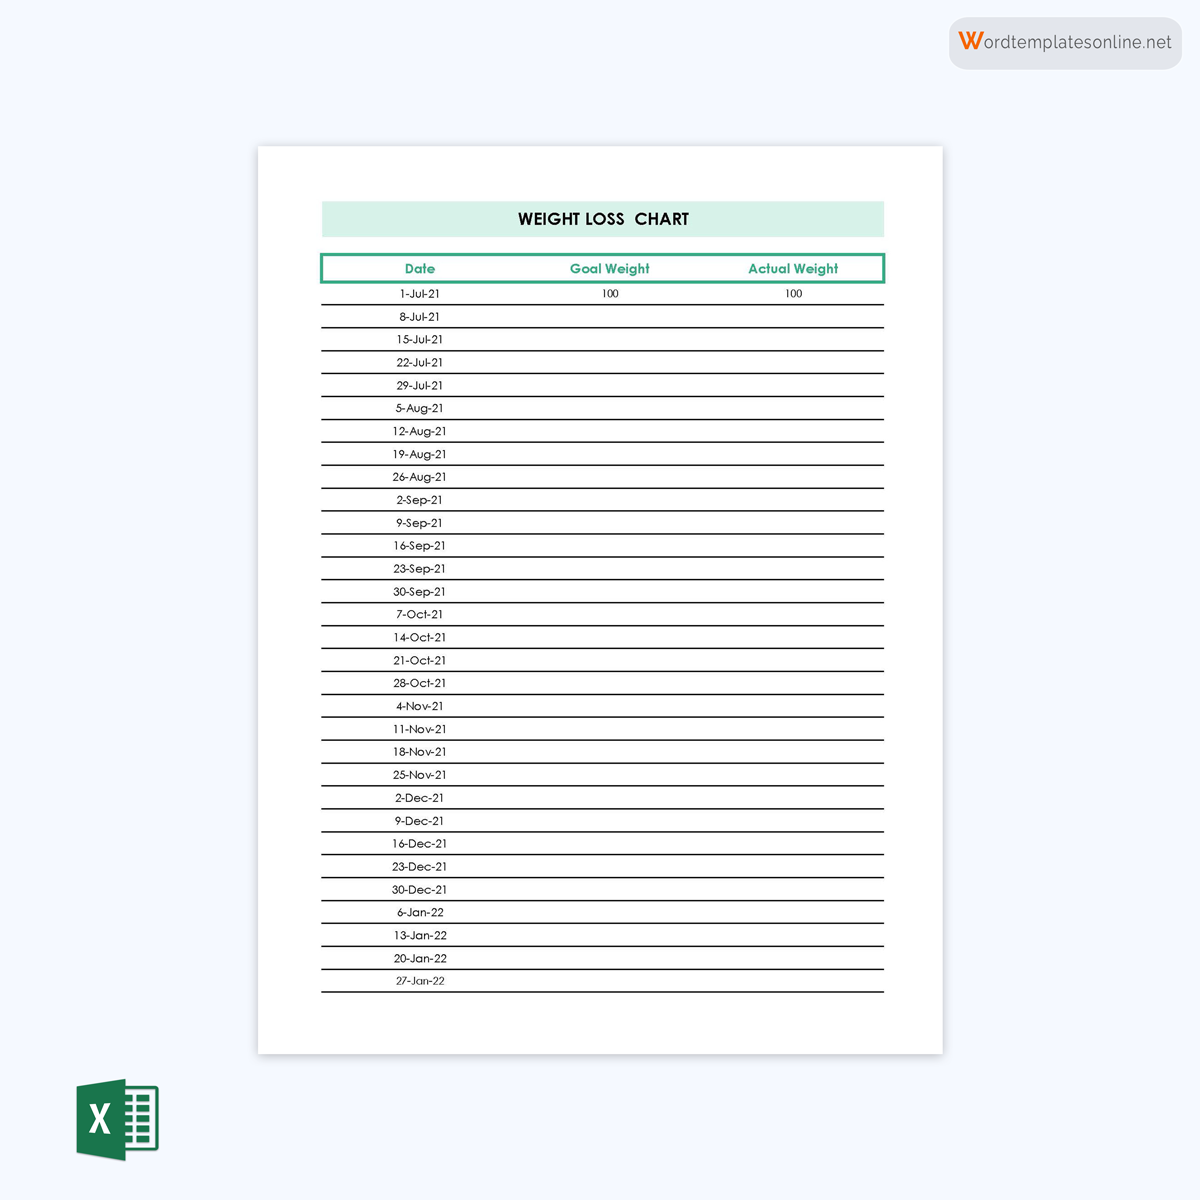
Weight Loss Chart Templates
You can download the following free templates:
Why Does Weight Loss Chart Help?
A weight loss chart will help you to arrange all your activities in one place, where you can monitor them effectively. This way, you can plan your exercise and diet routine. The chart tracks different measurements such as weight, body fat percent, and sizes of different body parts such as the waist, hips, upper arms, chest, and thighs.
You can also use the chart to note details such as your emotions, the most productive period in a day, observations, etc. The chart will thus serve as a journal of your journey by showing what you did, your experiences, good and bad choices, and your progress over time.
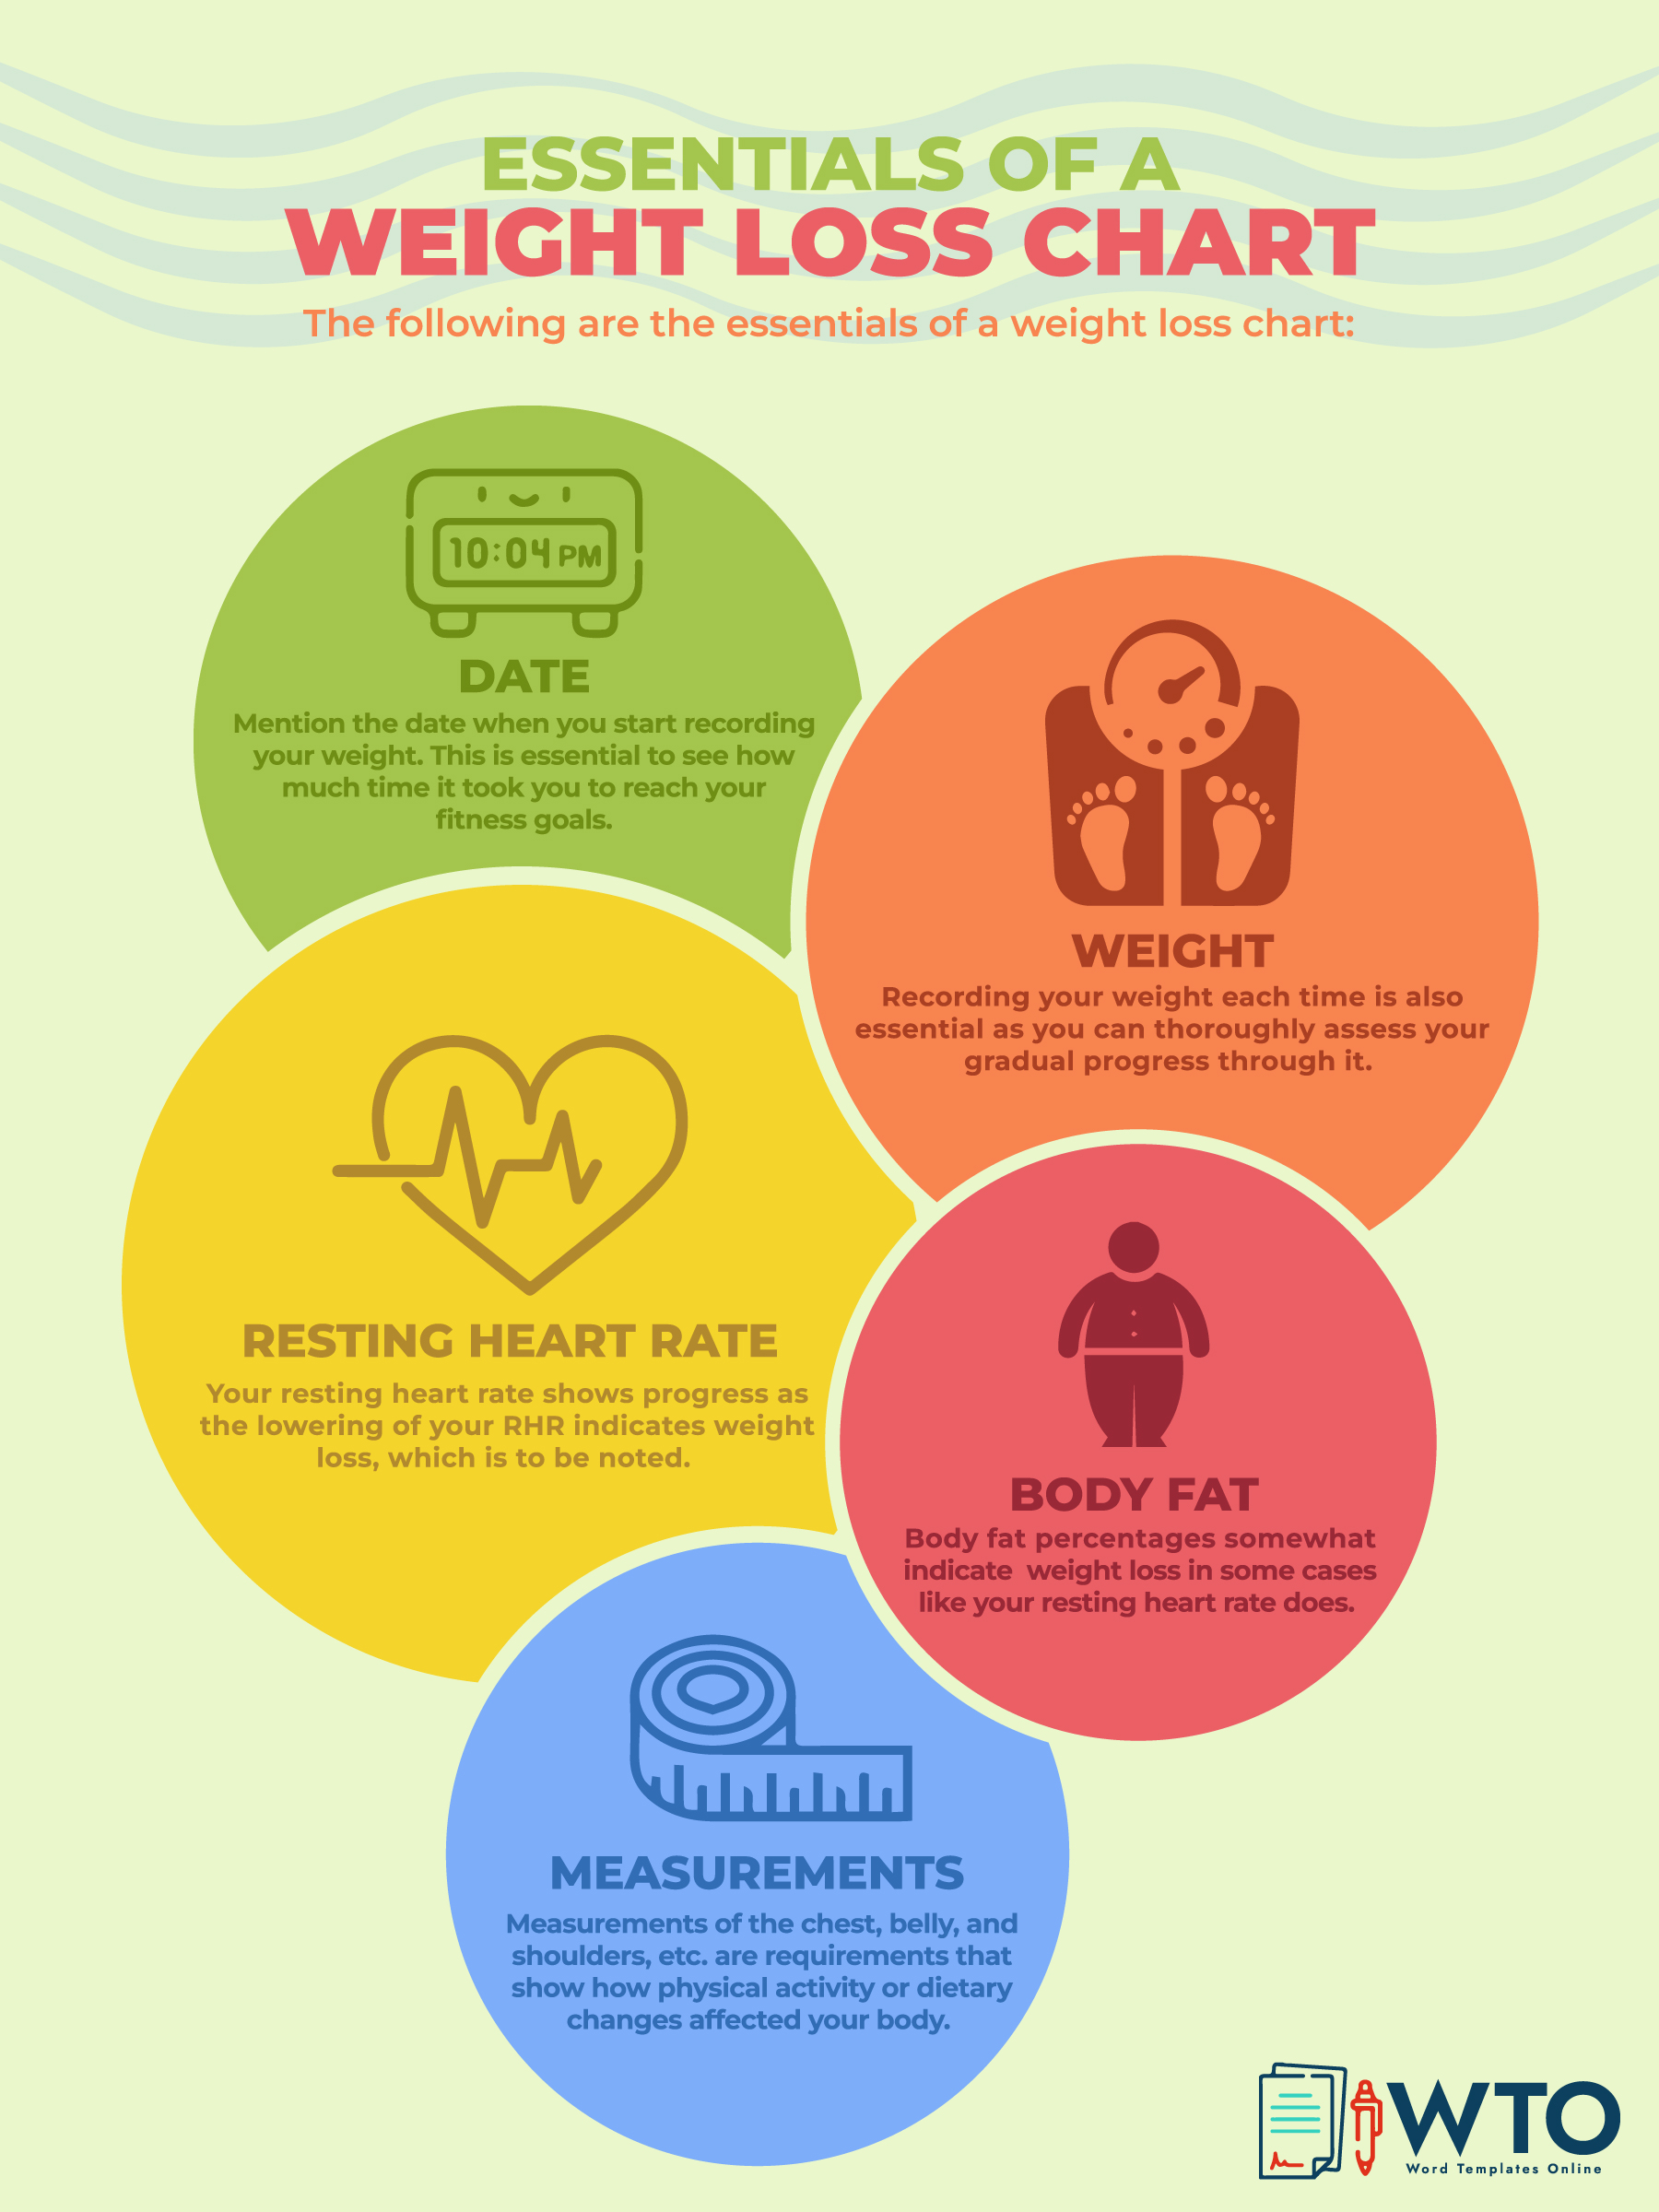
What Should be Included in Weight Loss Chart?
The chart must be designed carefully to maximize its effectiveness. The chart should outline every activity or measure you will undertake to lose weight and achieve your goal. It can thus be a simple or detailed log. You can create a simple table with the date on top, your name below it, a column for weights and measurements, an area for exercise done in a day, a diet followed, and an area for notes on emotions, etc.
This is simply a basic outline of what the chart must contain. The following are essential sections to be completed as you collect them through your journey:
Date
Your chart should allow you to record the dates when you undertake different activities in your plan, such as taking measurements. Often the weight is measured daily, but it can be done weekly, and measurements will typically be taken every four weeks. You will also be able to record the date you began your plan and the completion date.
It helps you to reference the data later and to see how long you have been working on losing weight. Dating each entry is also essential in understanding how much of your plan has been achieved through your efforts since the last entry.
Weight
Weight is a fundamental aspect of the chart and should be noted as you weigh yourself. You should enter the measurement and the date to avoid confusion while referring to the chart later. In addition, you must remember to include your target measurement to see how much progress you have made over time.
Resting heart rate (RHR)
Resting heart rate (RHR) is essential to your overall health. The average human heart beats about 50 to 100 times in one minute. The RHR should get lower as you lose weight. So, lowering your RHR should be an objective of your work plan.
The RHR should be measured in the morning before engaging in any activity or 1 or 2 hours after ample rest from a rigorous activity, such as exercise. The RHR should be measured five days consecutively to obtain an average. The heart rate (RHR) is measured by counting the number of pulses/heartbeats per minute.
Body fat
Body fat percentage is another important metric to note in the chart since it directly influences your body functions, appearance, metabolism, and overall health. You can effectively track your body fat percentage using a body fat calculator, through your trainer’s assistance, or have it measured in a university lab by an expert.
In addition, body fat percentage is a significant indicator of weight loss. This is because sometimes you may lose fat and gain muscles and since this fat loss cannot be evidenced on the scale, measuring the body fat becomes a more reliable way of determining if you have lost weight.
Measurements
It is imperative to take measurements of the waist, hips, chest, and thighs with a scale or tape measurer before and after each measurement interval to increase the effectiveness of the weight loss chart. Measurements are essential because they track how your body changes over time. This way, you can plan changes in the future to achieve your goal faster.
These measurements are measured as follows:
- Waist: The waist size is measured using a tape measure. Wrap the tape around the waist and record the measurement. The waist is considered one inch above your belly button or the narrowest part of your trunk. Note that the tape should not be wrapped too tightly or too loosely.
- Hips: Hips are measured by putting your heels together and measuring around the widest part of your hip area.
- Chest: The chest measurement is taken by measuring the fullest part of your chest.
- Thighs: This measurement is taken by measuring the upper thighs. The measurement should be taken beneath where the buttocks transition to the back thigh.
This infographic is about the essentials of a weight loss chart.
How to Create a Weight Loss Chart in Excel?
When creating your chart, besides the essential elements, you can add sections to record information on other aspects of your life, such as your emotions, work, sleep, diet, etc. Charting will help you stay aware and motivated throughout your weight-loss journey.
If you want to create a weight loss chart in Excel, use the following steps:
Open an Excel sheet
- Create a new Excel worksheet and name it.
- Create columns for the metrics you will be measuring.
- Label the first column as “Date” and the second as “Weight.” Then, using a simple chart, you can proceed with these two columns. For a more detailed chart, add columns to record other details, including resting heart rate, body fat, and waist, chest, hips, and thigh measurements.
- Fill in the required information accordingly.
TIP
You can also use Google Sheets if you do not have Excel. Google Sheets are available online and at no cost.
Create a line graph
To make the weight loss chart effective, consider using a graph to assist in interpreting the data you will input as you implement your plan.
You can create a line graph as follows:
- To create the graph, select Insert, go to Charts and Line Graph, and click on the dropdown menu. Next, select the “marked” line graph option.
- Next, you need to label the X and Y axis. To do so, navigate to the “Select option” in the menu bar or right-click the graph and go to “Select Data.” Name the axes appropriately.
- You can also define which columns you want to track at this stage. Once selected, the line graph will be created with the data in the selected columns.
Customize your chart
Create columns for additional information you want to track, such as emotion/mood, notes on observations, blood pressure, etc. As needed, you will refer to these columns to evaluate your progress.
Creating Weight Loss Chart by Using Template
You must keep track of your exercise and diet when trying to stick to your plan. You can use templates as a tool for creating a weight loss chart.
Use the following steps:
Select a template
There are many templates available on the internet. It is recommended to download one that suits your needs and preferences, as not all templates are designed similarly. Professional templates have been provided on this website. You can assess the different templates. Select the most suitable one and download it. You can create a chart using a template and modify the sections based on your needs.
Add the required information
After selecting a suitable template, you must input the necessary information. This includes the date, weight, body fat percentage, resting heart rate, height, etc.
Update regularly
As you progress, you must update the chart regularly and monitor your data against the goals you set for yourself, such as a specific target weight. Once you have achieved your goal, keep your charts for future reference. In addition, you should review your previous charts when creating any new weight-loss plan or if you need the motivation to continue your efforts.
Try the Tips to Stay Healthy Along with Weight Loss Chart
While weight tracking is a necessary aspect of your plan, other things such as food, sleep, physical activity, and emotional health also play an essential role.
Below are tips on remaining healthy:
Opt for 5-6 meals a day
Rather than limiting your food intake to three large meals, try to get at least 5-6 small meals throughout the day that include snack times per your hunger and schedule. You must consider adopting a schedule with regular intervals, as this prevents acidity and bloating. Also, you must ensure you are eating healthy snacks, not junk food.
Have an early dinner
Your body’s metabolism usually slows down during the night. Therefore, having meals during the night can lead to weight gain, as most food will not be metabolized. Therefore, it is recommended to have an early dinner, before 8 pm.
Drink as much water as you can
Water should be an integral part of your diet. This is because it curbs your hunger between meals and does not add calories to your body. Take 6-8 glasses a day. Additionally, water helps flush toxins from the body and helps maintain a healthy weight. It also prevents constipation, which may be triggered when you start dieting and exercising.
Eat a lot of fiber
Focus on increasing the intake of foods rich in fiber, as it plays a vital role in digestion and keeping your heart healthy. The recommended fiber intake is 15gm per day. Some fiber-rich, healthy foods are apples, broccoli, lentils, oats, flax seeds, etc.
Wrapping Up
A weight loss chart is a diary of your plan to reduce weight. It helps you monitor your body and changes as you implement your plan. This way, you can make well-versed decisions about your plan that lead to positive outcomes. The chart should be updated regularly to ensure the data collected is consistent enough to determine if progress is being made.
Continuously track your weight loss using a chart to stay motivated. Then, after achieving the initial goal, use the information you collected throughout your plan to adjust your diet and workout routine to stay fit and in shape. It would be best to make minor adjustments/changes so that you can see how they translate into permanent long-term changes. Alternatively, you can resolve to take a break from the program. Finally, you can create your chart using Excel or templates. Both approaches can develop an effective chart that befits your needs.
About This Article