The decision-making process has to be objective and rational and can be complicated, especially when there are multiple alternatives. A decision tree is one tool used to simplify this process. It explores the probable decisions and the associated outcomes that can be made from a single situation when a decision has to be made. Decision trees factor in the cost, benefits, and probabilities to evaluate probable outcomes. These are some of the highly prominent factors of overall decision-making at work or in personal matters.
What is a Decision Tree?
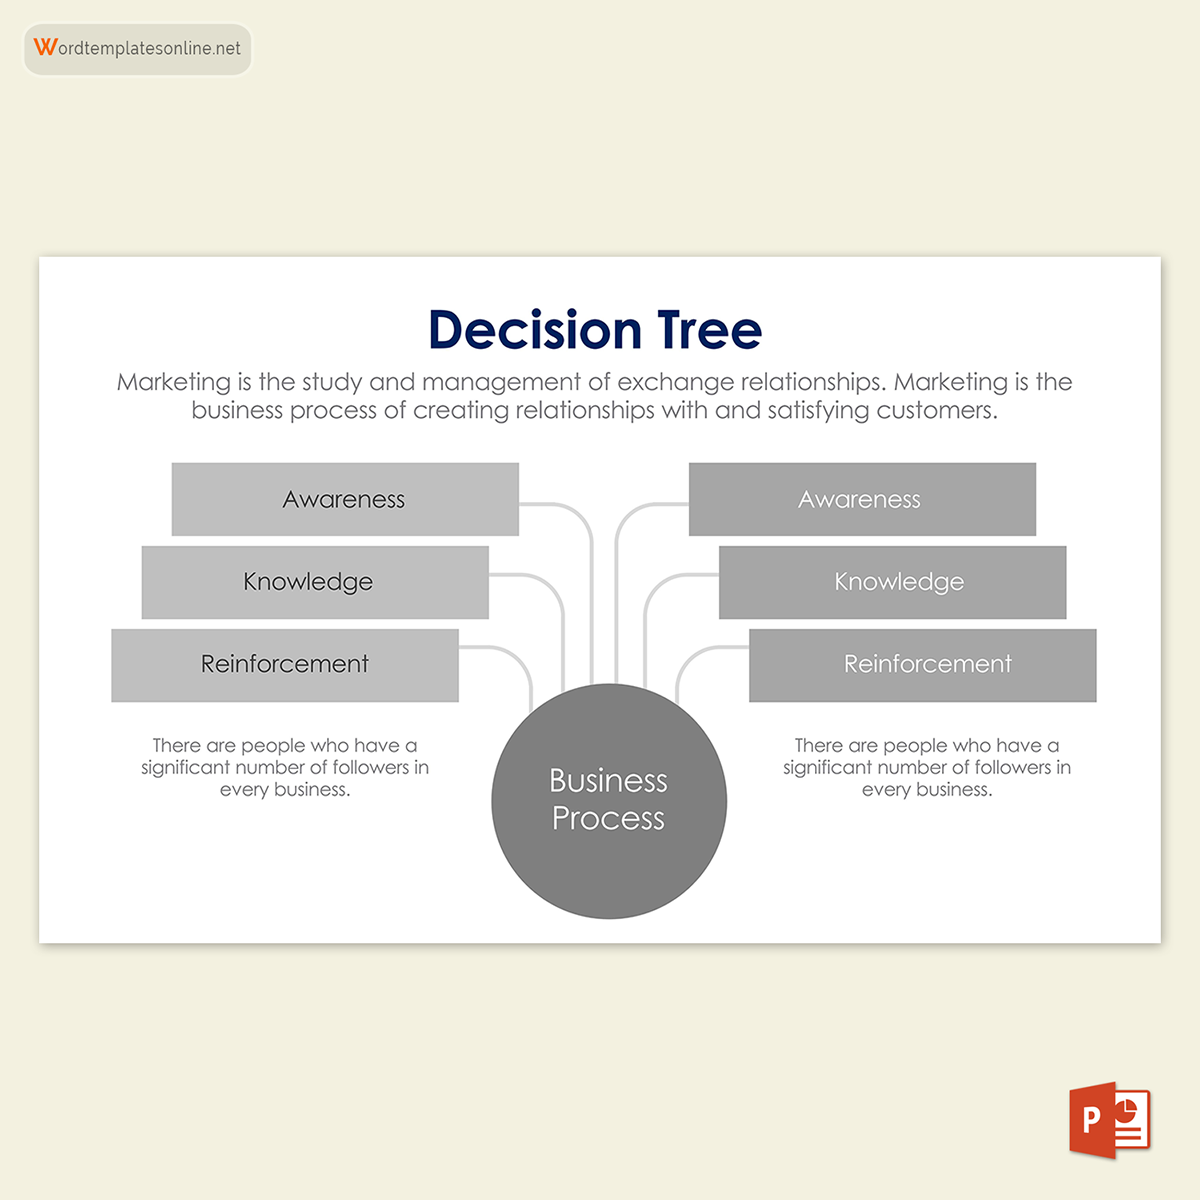
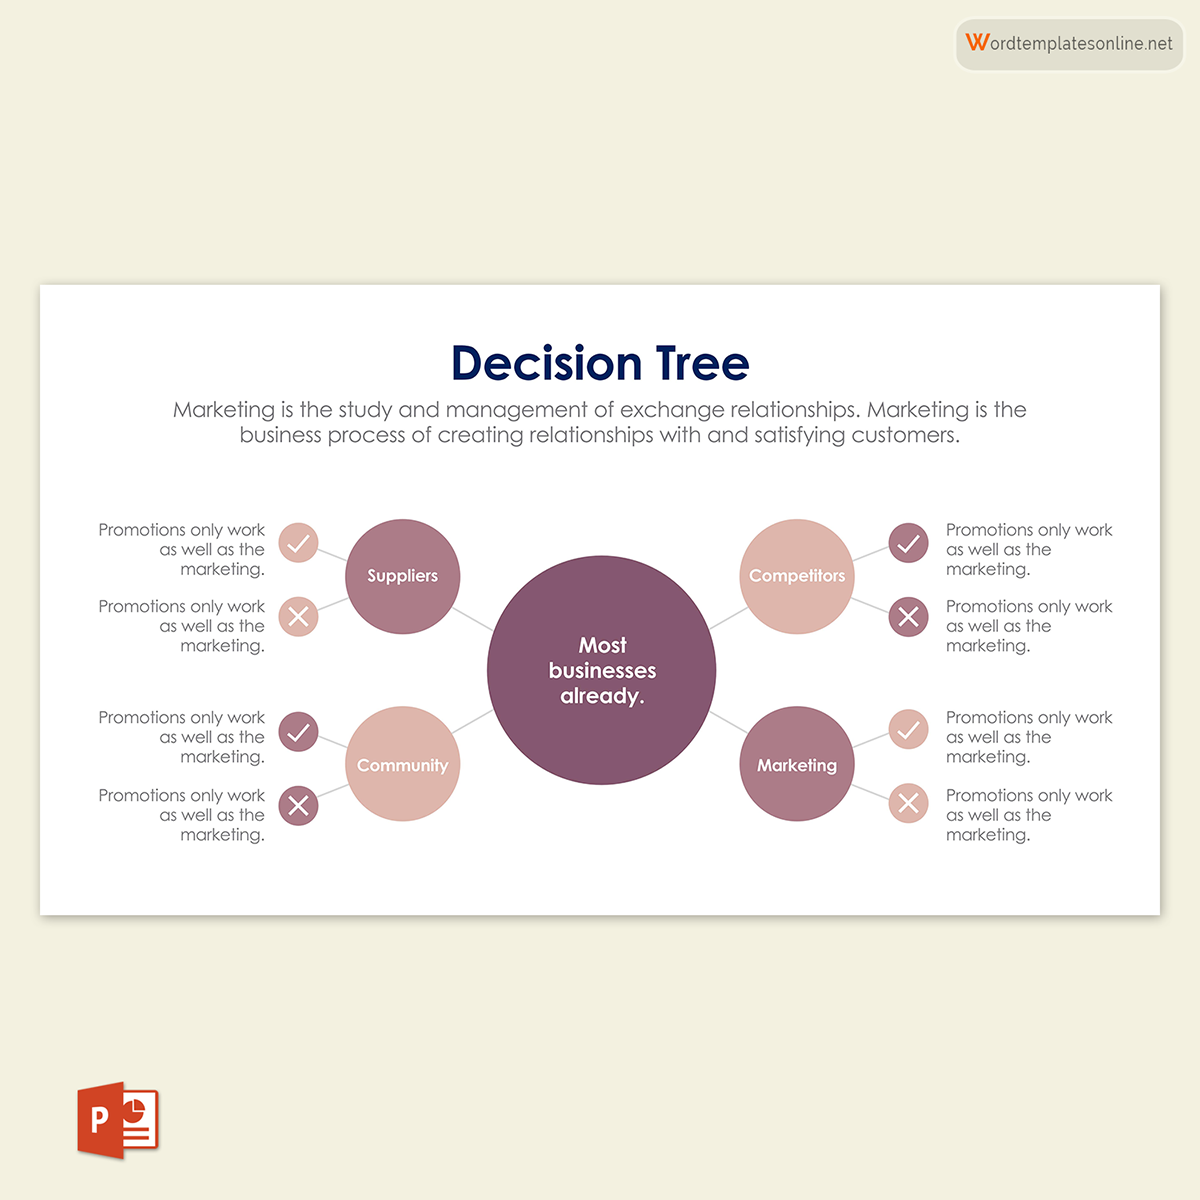
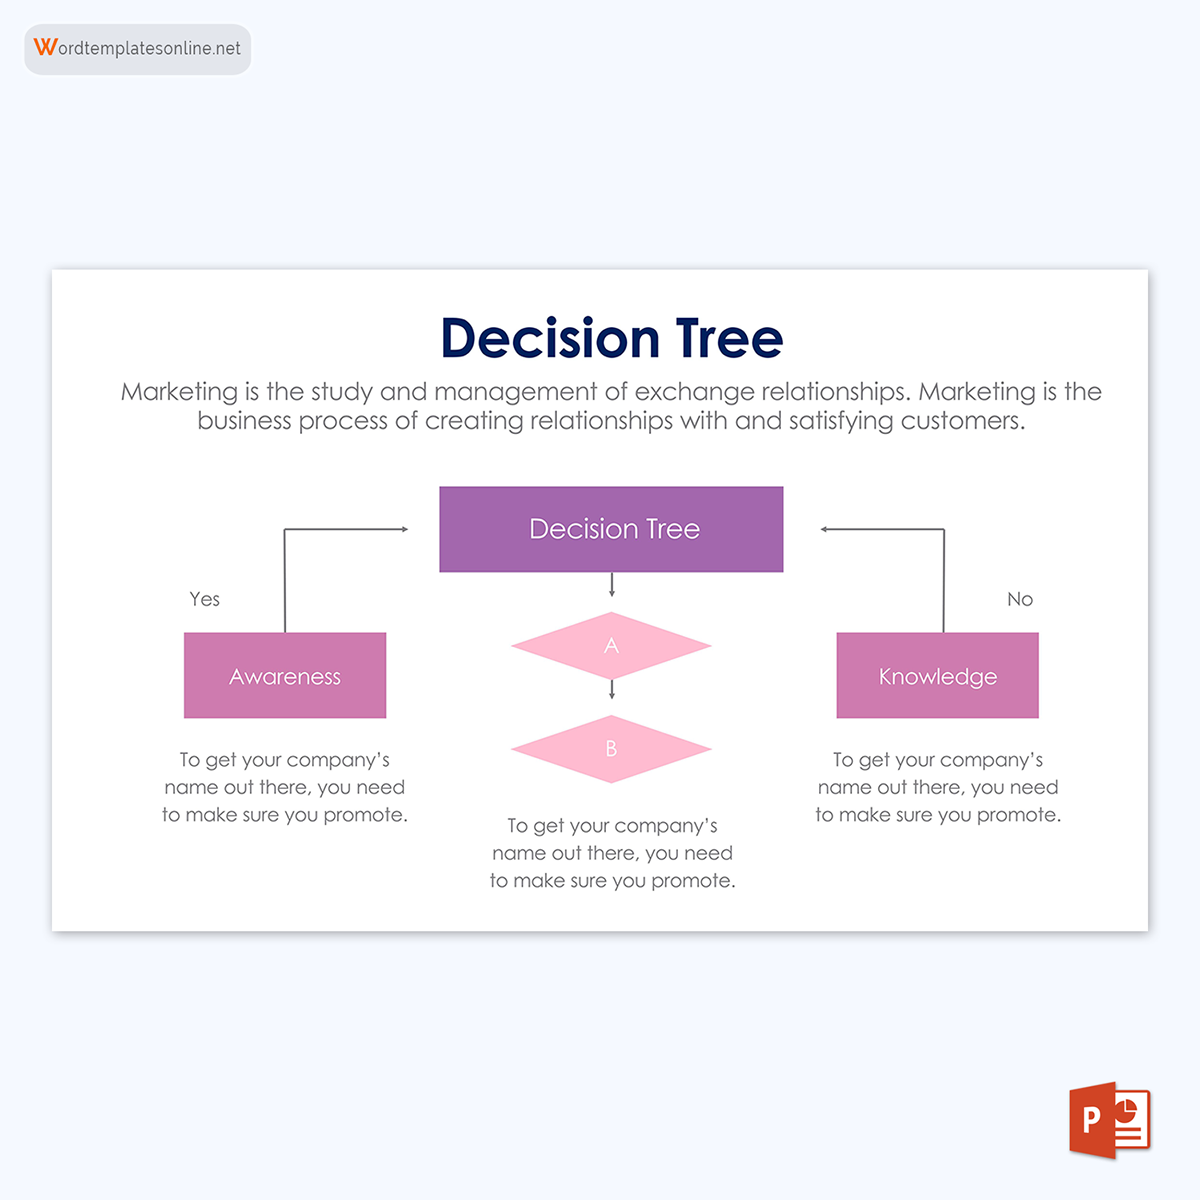
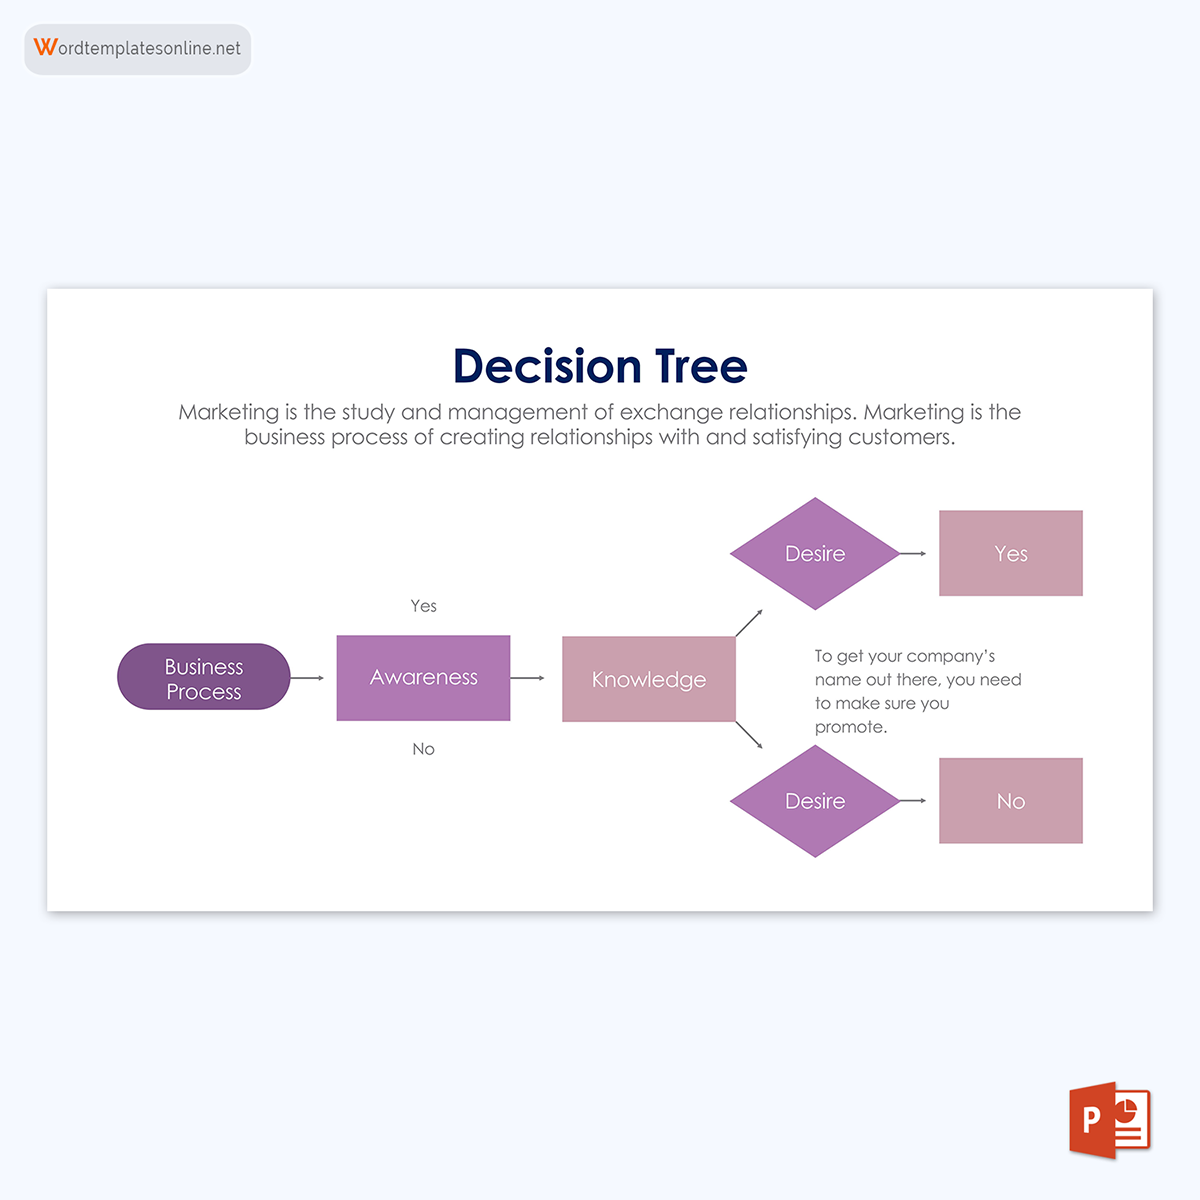
It is a decision-making tool used to analyze and map out the likely outcomes (possibilities) of a single event or decision and the intermediary choices that lead to each different outcome. It visually represents all the alternatives available to the decision-maker in the form of a tree-like diagram.
It takes the shape of a tree where the branches represent probable outcomes, and the leaves signify class labels. Decision trees are used as an algorithm for arithmetic prediction of the best choice available and to drive informal discussion during decision-making.
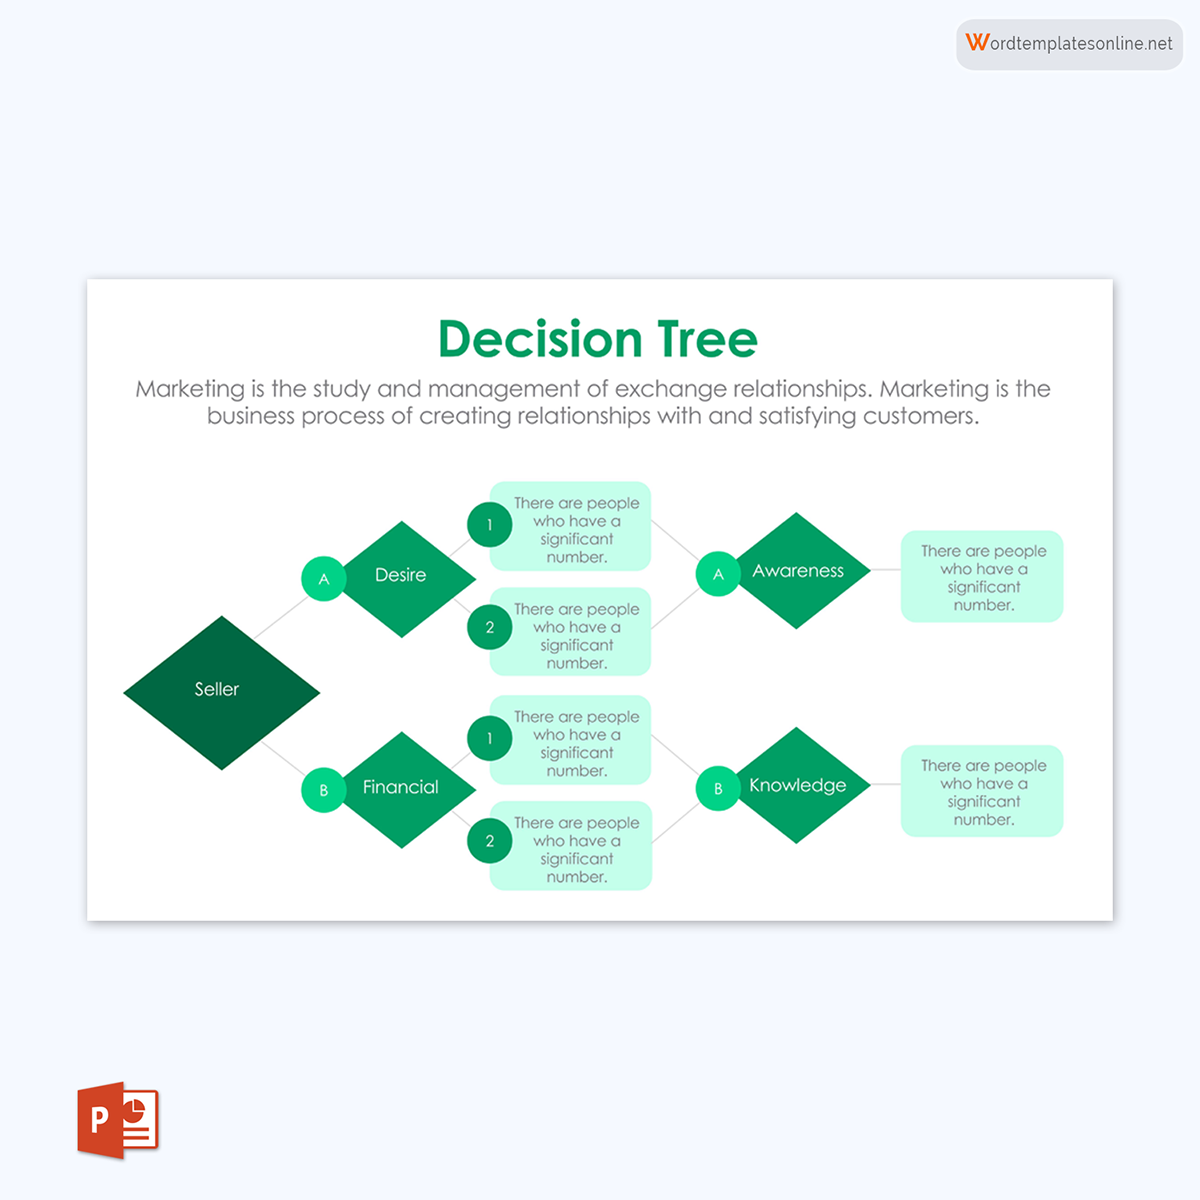
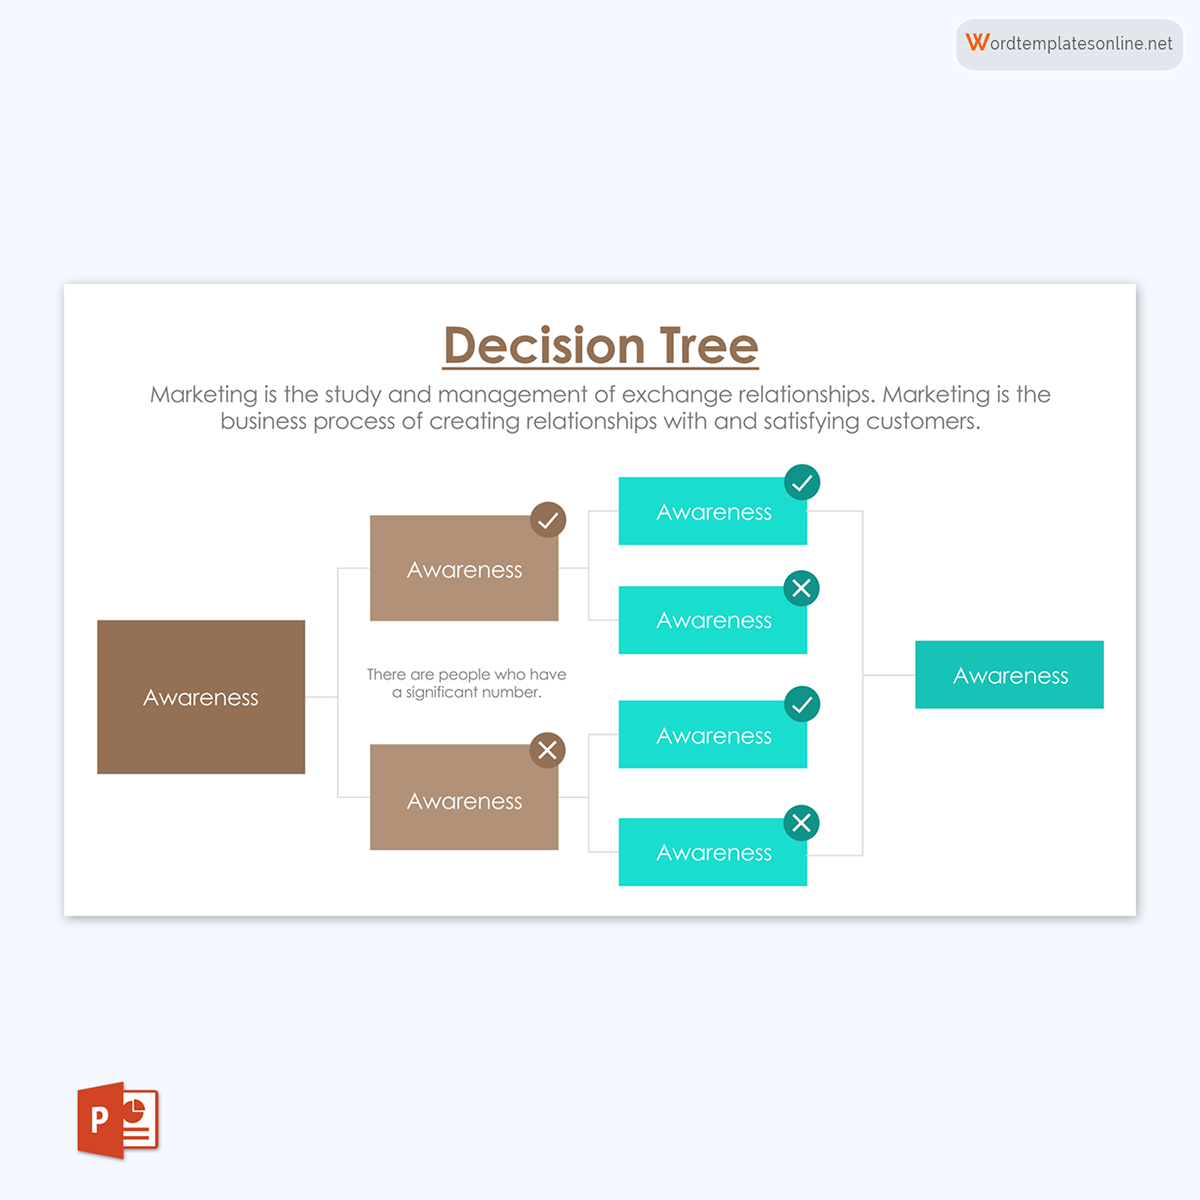
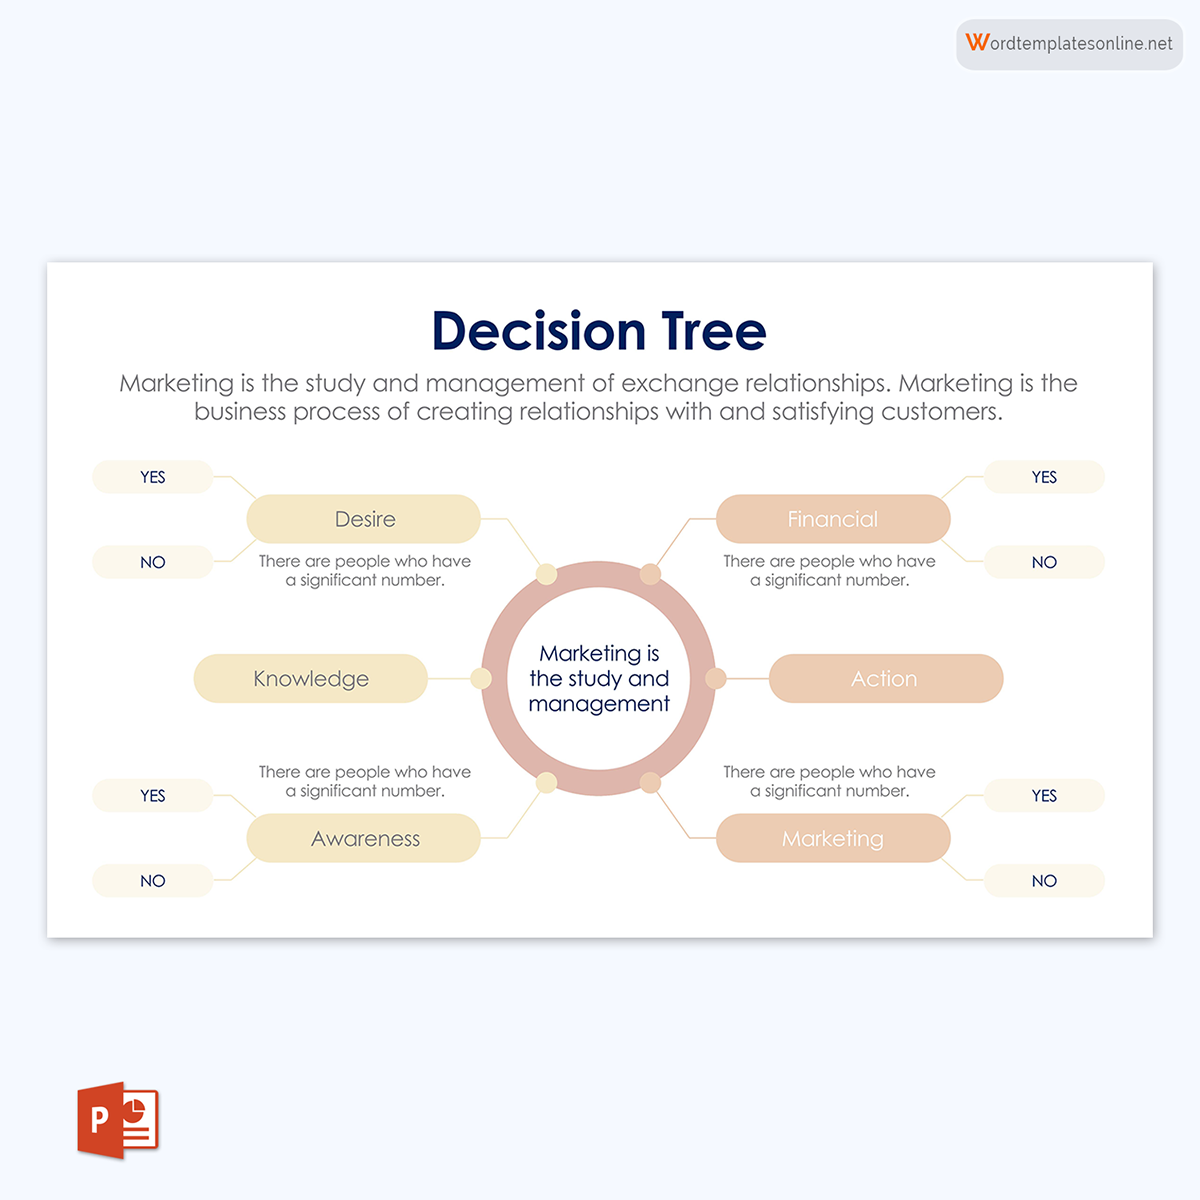
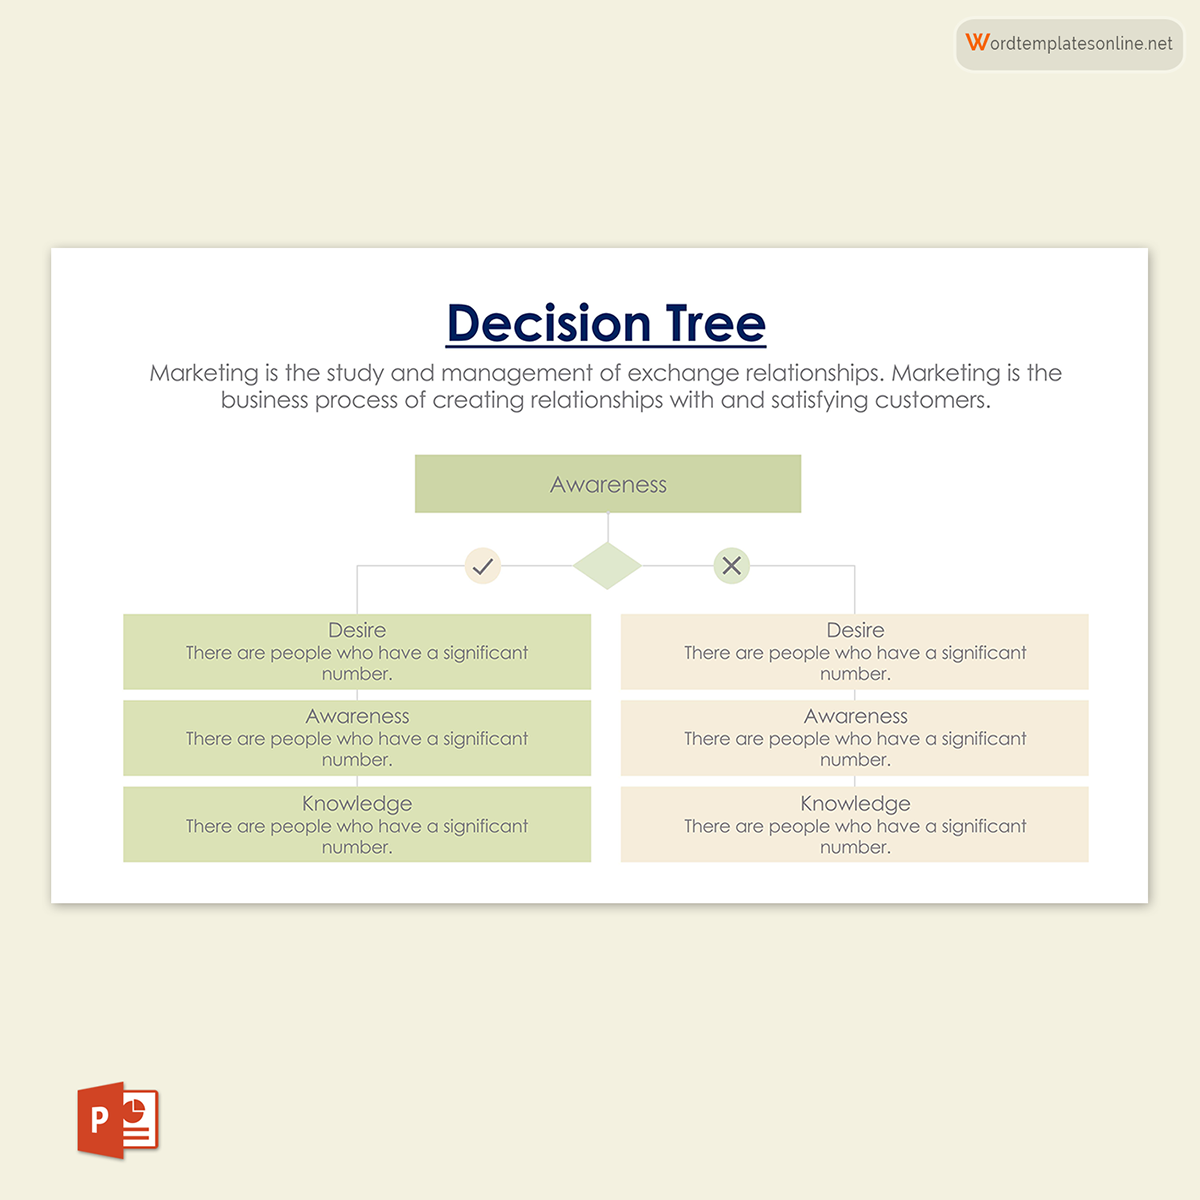
Decision Tree Templates
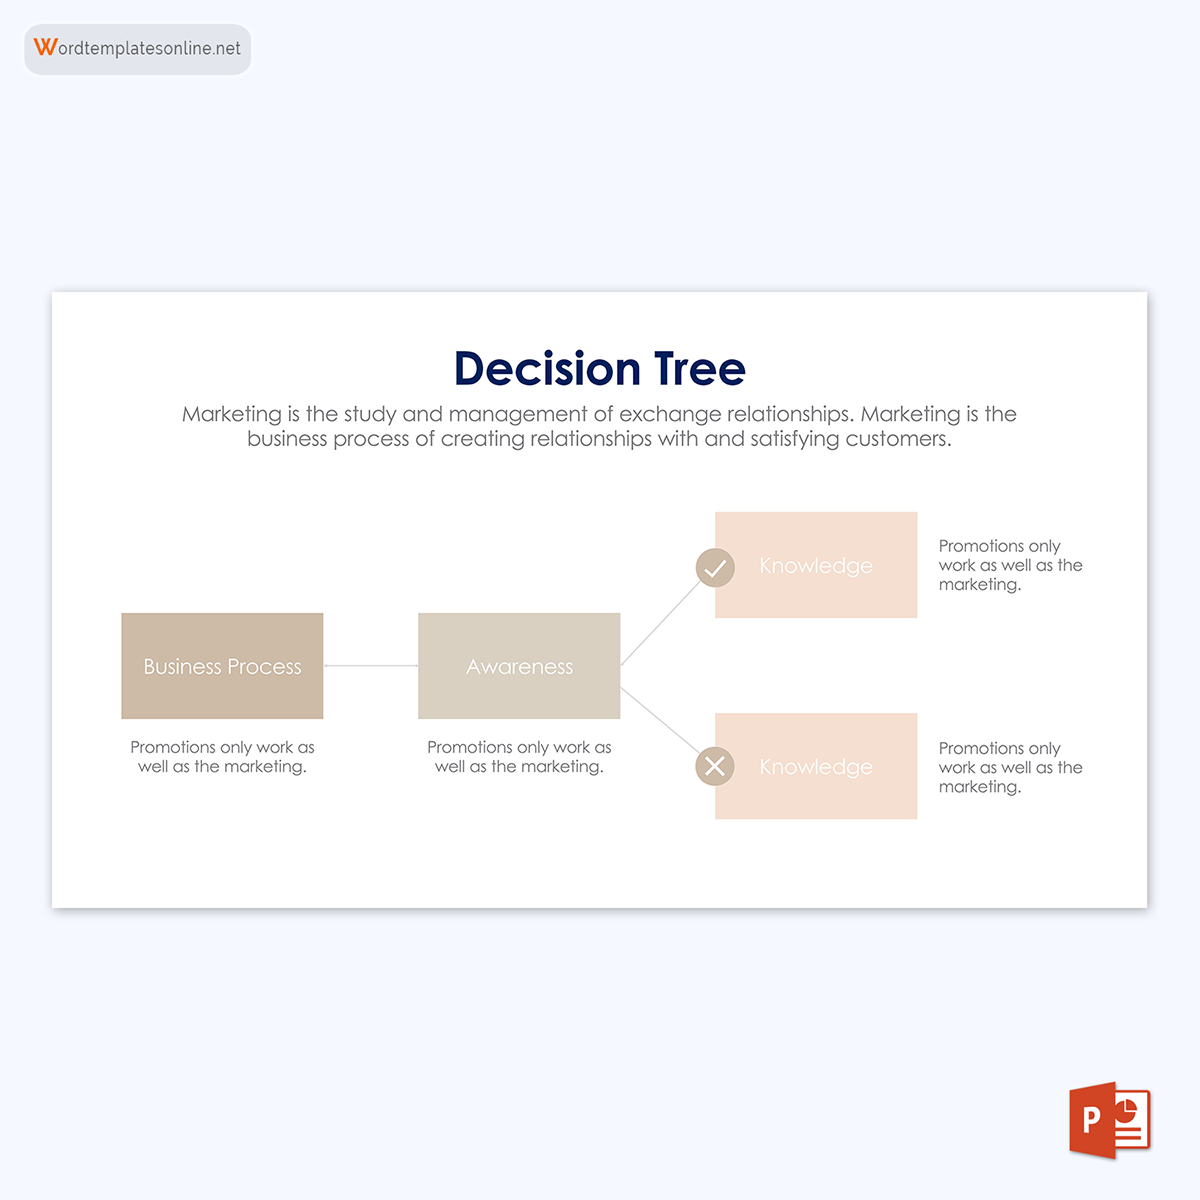
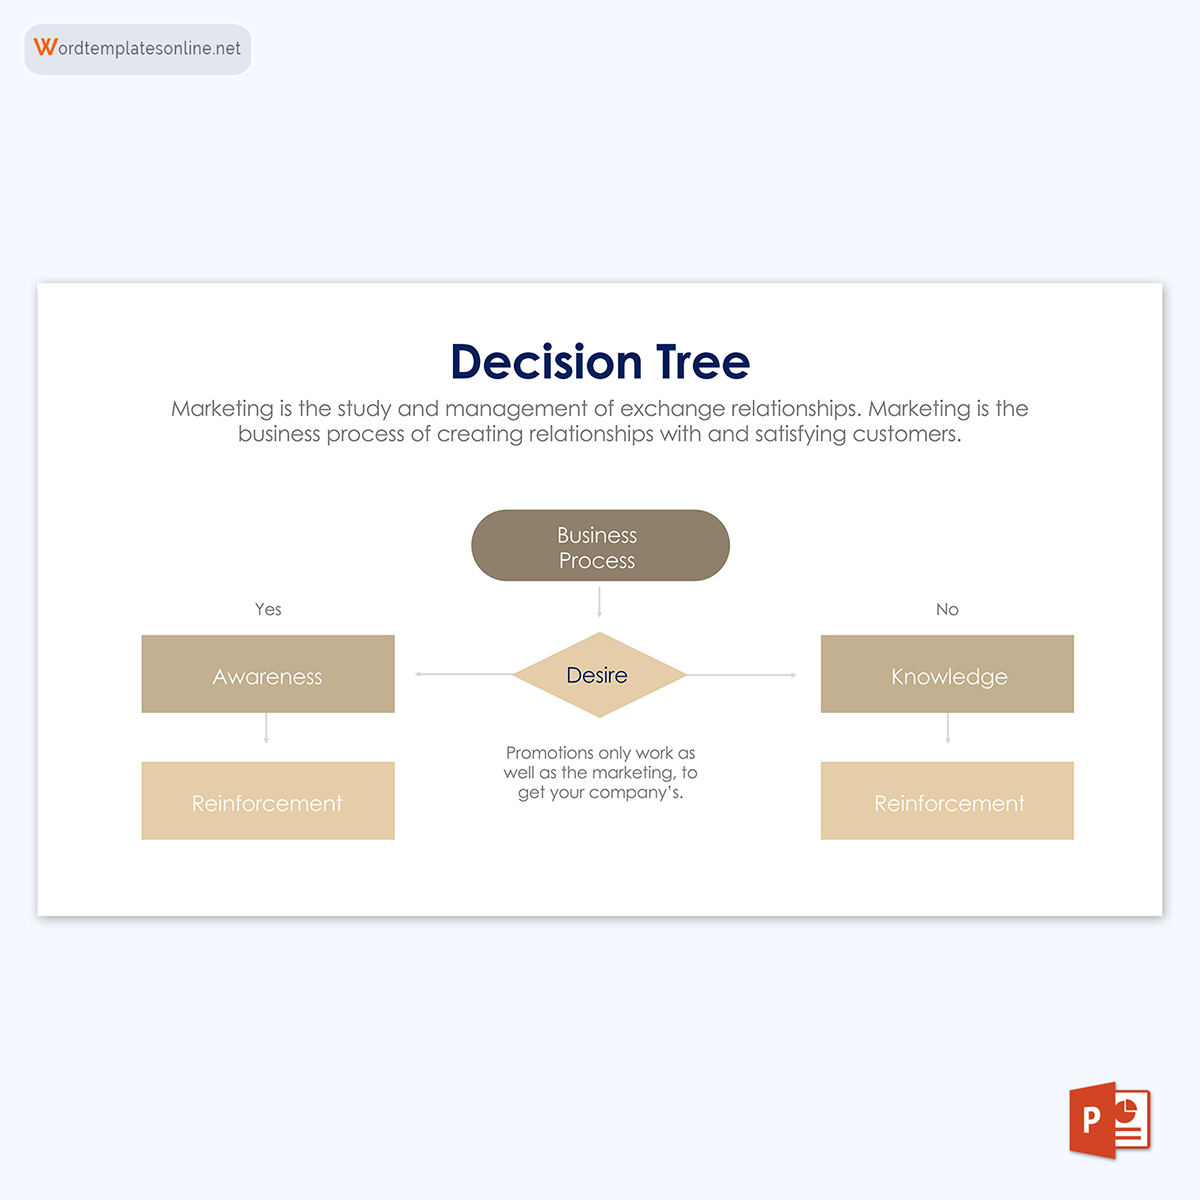
To avoid the workload of creating a decision tree from scratch, it is always easier to use a predesigned template like the ones provided on this site. These templates are created to suit different types of decisions. They contain the vital elements of the decision tree but can be customized to suit specific decisions. These templates are free for download and are readily available with a few clicks.


What is It Used For?
Decision trees can be used in a wide range of scenarios in the business sector and personal decisions. They are flexible and can effectively communicate complex processes hence their adaptability in different sectors. Commonly, they are applied in data classification, prediction analysis, and regression. The templates are popular among data analysis, machine learning, and artificial intelligence. They are used to undertake predictive analysis in data analysis since they focus on probability and data, not bias or emotions. Predictive analysis can analyze the efficiency of different action plans or strategies to solve a problem in a project.
In machine learning and artificial intelligence, decision tree templates are used to categorise decisions,
EXAMPLE
“Yes” and “no,” and predict how decisions can be made based on how they were previously made when the same set of data is factored in.
A decision tree example can be used in the following scenarios:
- To decide whether an office should repair their broken printer or buy a new model that has additional features.
- To determine if a company will have to recruit new staff or retrain existing employees to keep up with the dynamic technology in the industry.
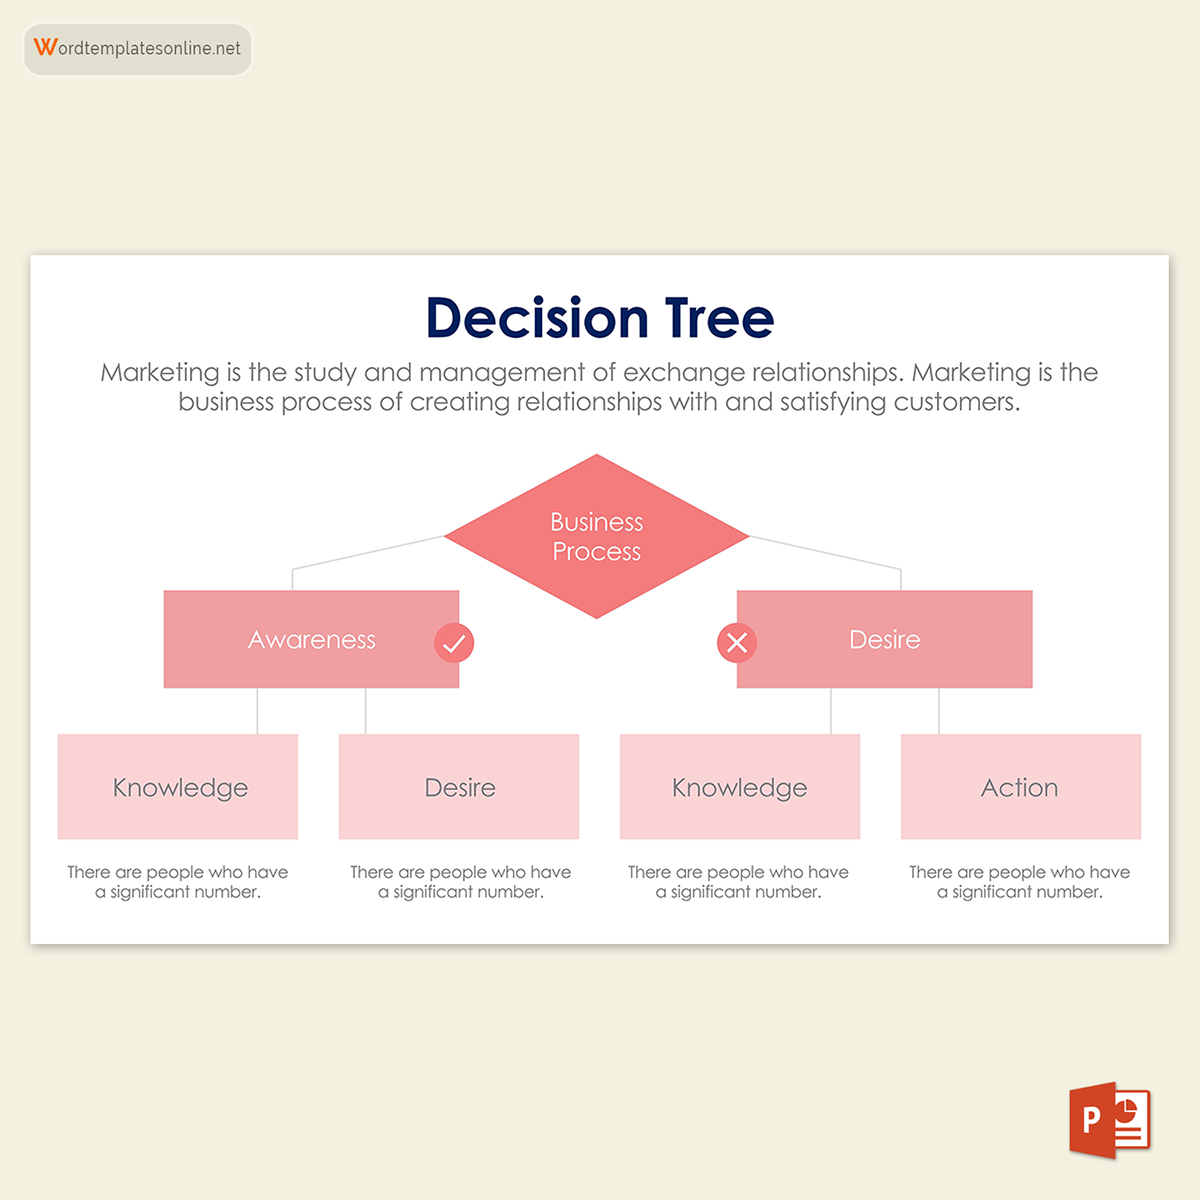
Parts of a Decision Tree
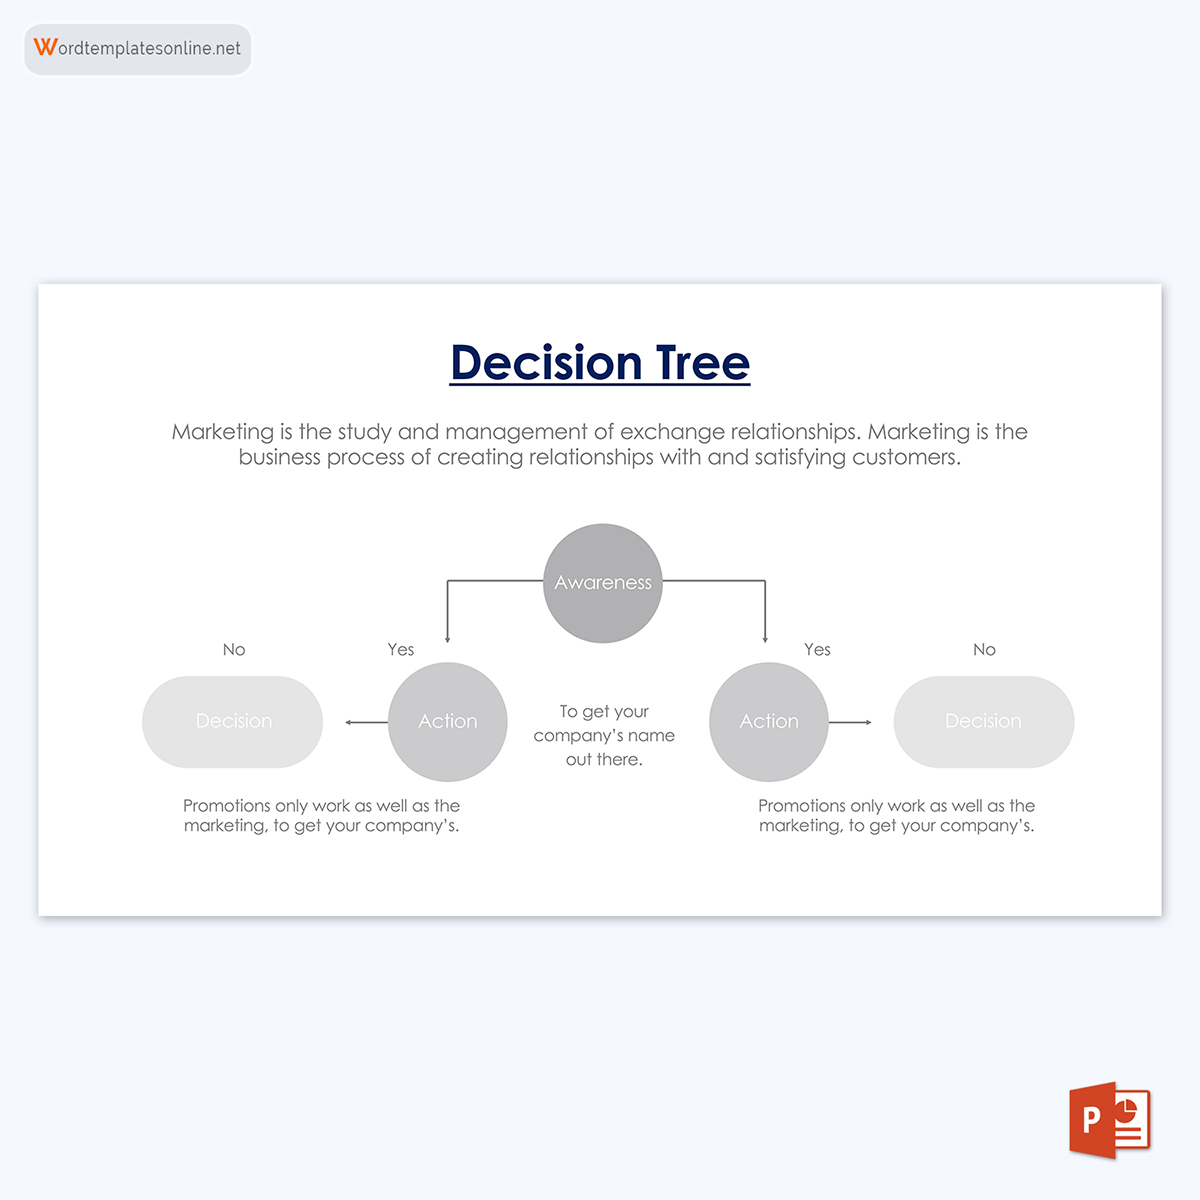
Decision trees originate from a single point or node which splits into two or more directions, and each branch expands based on decisions and probabilities until an outcome is achieved. Each path line represents a series of decisions and events that lead to an outcome.
Below are the components that make up each decision tree path line.
Chance nodes
Chance nodes are used to indicate the probability or uncertainty of an event to occur in the decision tree template.
EXAMPLE
A yes or no decision will have two chances nodes with a 50/50 probability of occurrence.
Decision nodes
Decision nodes signify any in-between decision made during any course of action. One outcome can result from multiple decisions that lead up to it.
End nodes
End nodes are used to represent the outcome of each course of action. End nodes are typically the last items on the furthest end of a decision tree template.
Root nodes
A root node represents the first decision made in any course of action in the template. It is from this node that other elements of the decision branch come from.
Leaf nodes
Leaf nodes are used to indicate the likely outcome of each possible action or decision path. Like leaves on a tree, leaf nodes are the utmost part of a template and hence do not split or branch further. Leaf nodes are used to show an eventuality, unknown outcome, or end of the decision-making process.
Internal nodes
Each internal node can be a decision or chance node as they are the in-between nodes (located between the root and leaf nodes) of a decision tree template. Therefore, each internal node will typically have branches of its own.
Splitting
Splitting is the division of one node into several nodes (sub-nodes), which can either be a leaf or terminal node. The end results of splitting are branches of the node, hence the alternative term “branching.”
Pruning
Pruning is the process of trimming complex decision tree branches, that is, eliminating the irrelevant or less significant branches when this tree grows too large and complex. Pruning assists the analysts in focusing on more prioritised branches or courses of action.
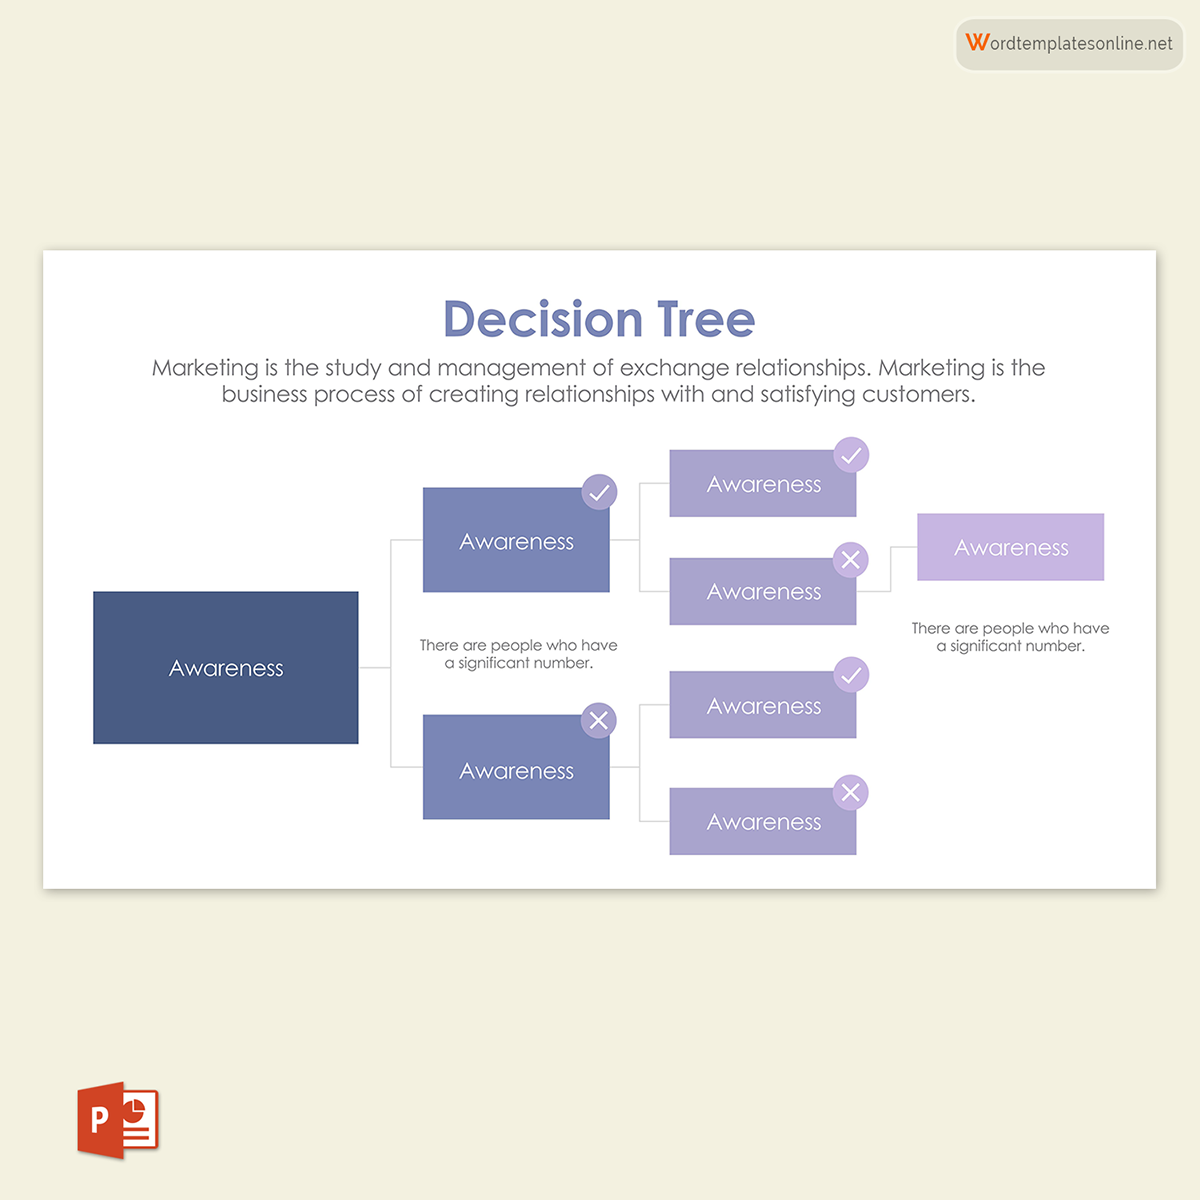
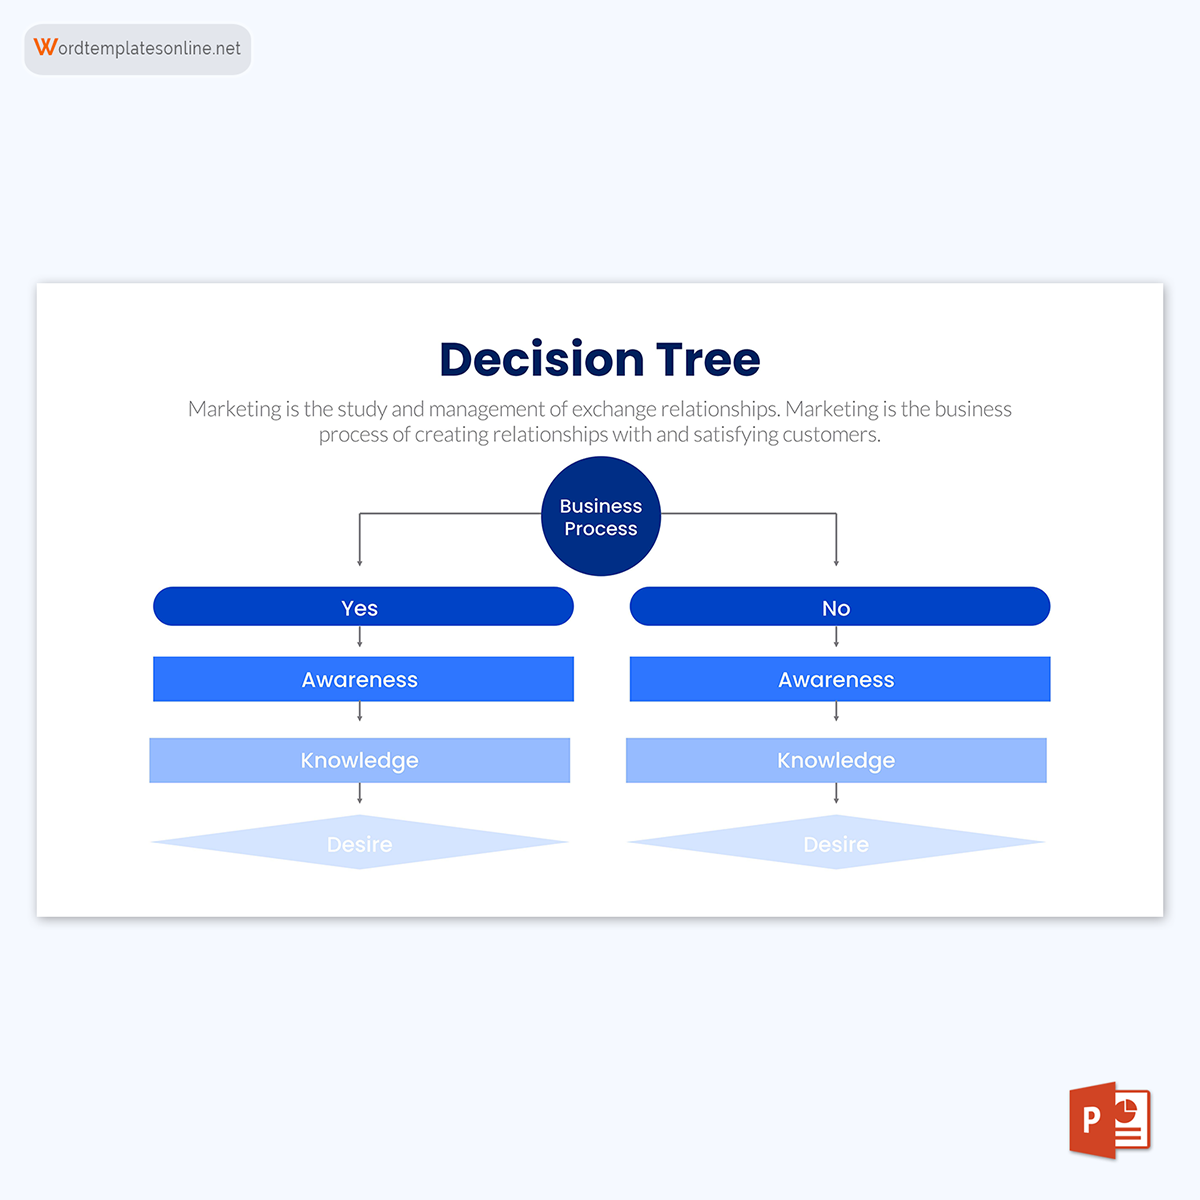
Symbols and Meaning
Standard symbols are used in templates to represent the different elements discussed above.
These shapes are shown below.
- Decision node – represents a decision

- Chance node – shows multiple probabilities
- Alternative branches – indicate courses of action or outcome
- Rejected alternative – signifies a course of action that was rejected

- Endpoint node – signifies the outcome

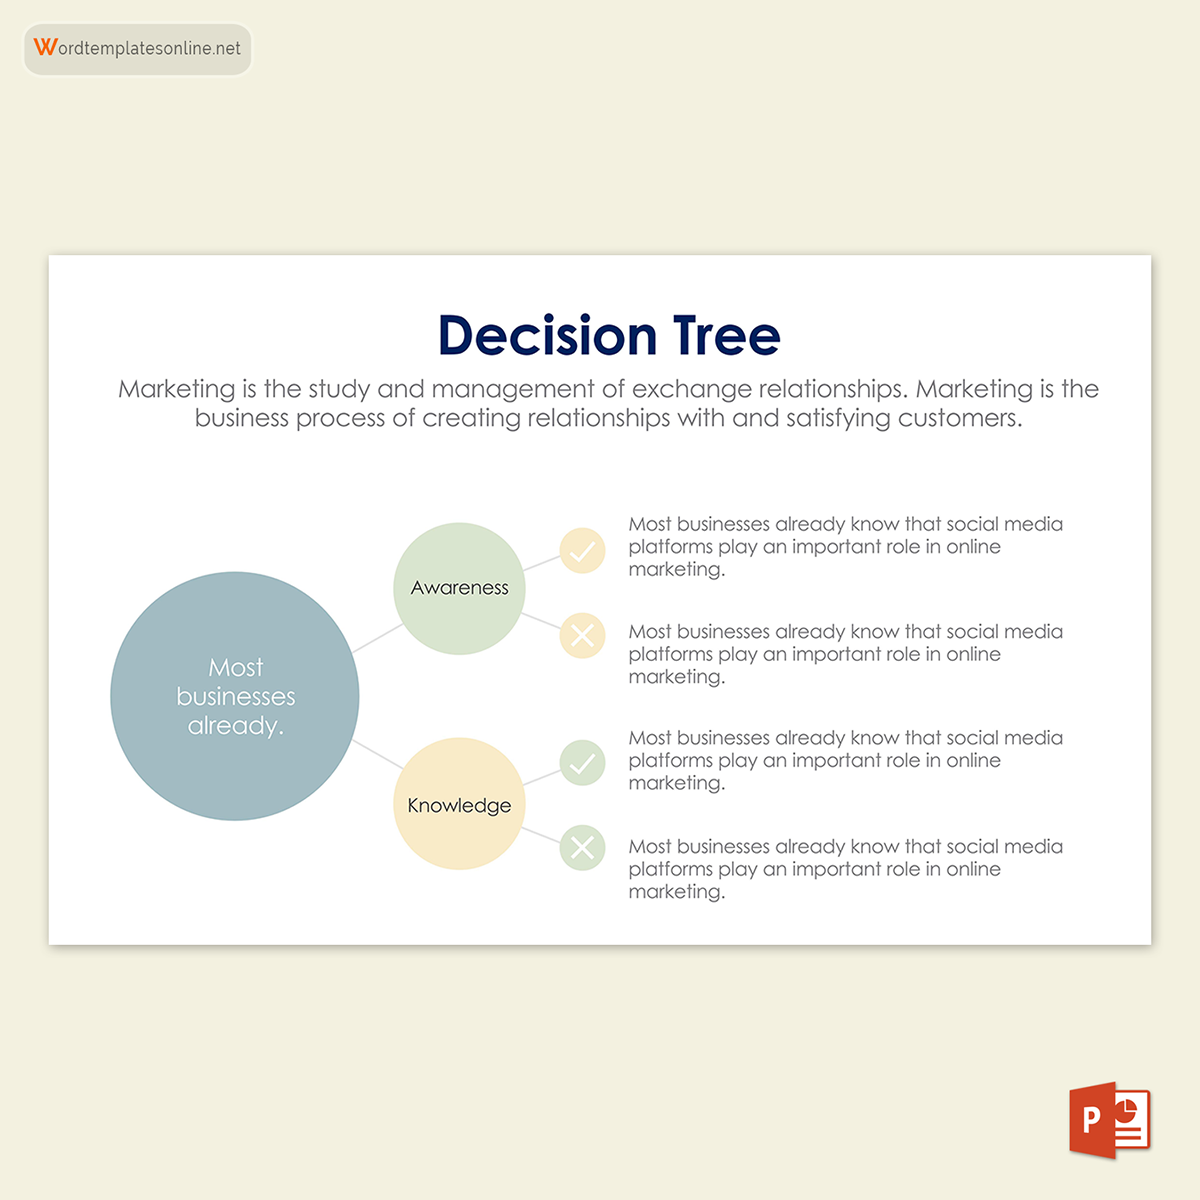
How to Draw?
A decision tree is effective in classification and prediction. It achieves this by dividing the source set (root node) into subsets (internal nodes) based on an attribute value test. The process is repeated until it meets a specified objective, or further splitting does not add value to the decision to be made.
The procedure to draw a decision tree is generally the same regardless of the tool used. However, the specifics of each will vary depending on the situation. Below is a three-step comprehensive guide on drawing a decision tree that can be incorporated into the decision-making process. Each step is interlinked with a decision tree example template.
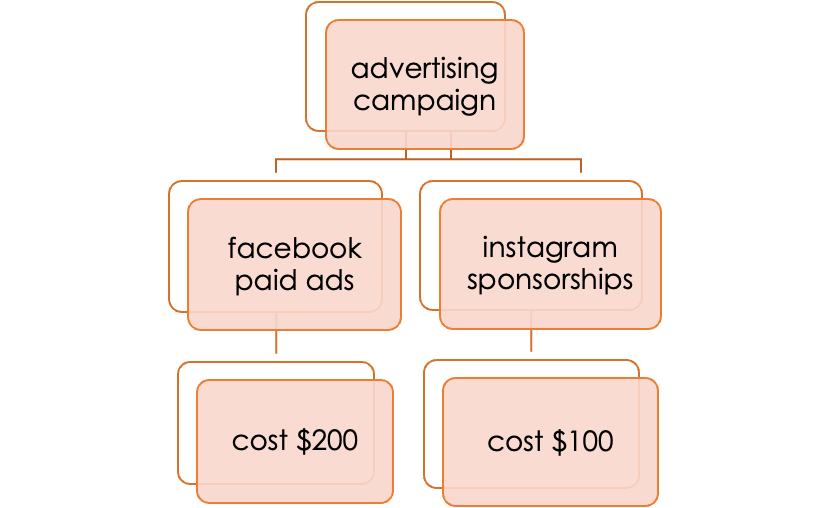
Start with the primary decision
The templates for the decision tree should begin with a box representing the root problem or the primary decision. Then, on the right-hand side of the root node box, indicate the available solutions or actions that can be taken to tackle the problem by drawing a line for each solution/action.
Add chance and decision nodes
Afterward, expand the tree by evaluating the next steps after the solutions/actions in the template. The next step could be another decision, the desired solution, or an uncertain outcome. Draw a box for decision, a circle for uncertain outcomes, and leave the box as it is if the problem is solved. If another decision has to be made, draw lines to indicate possible solutions, and so on.
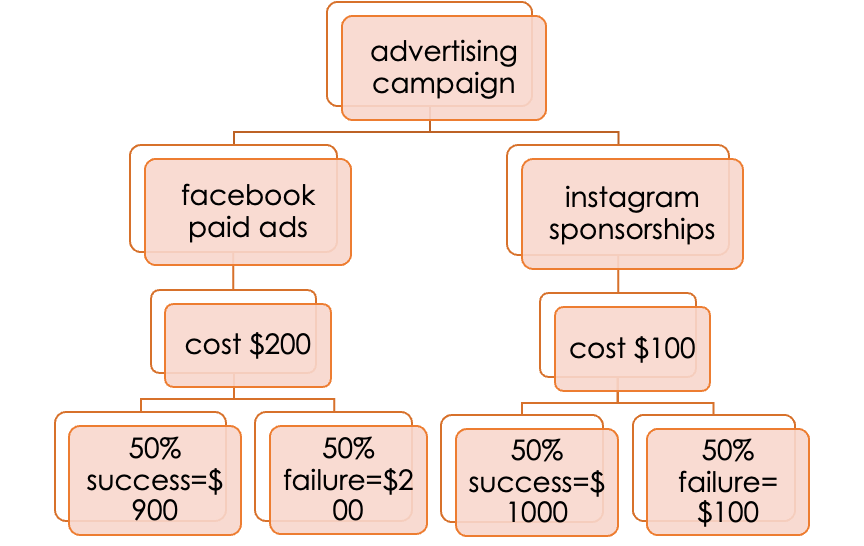
Continue to expand
Next, continue to expand the diagram by adding decisions and changes that have to be taken to solve the initial problem. Include probability for chance nodes that indicate the likelihood of outcomes emanating from each chance node. Next, indicate the endpoints using triangles. Also, add the cost of each solution. Then evaluate each outcome by assigning an abstract or financial value to each endpoint (leaf node) and determine the ideal course of action to take.
How to Make it in MS Word?
While anyone who wants to use a decision tree in making decisions can opt to use different software available, MS Word can be an equally excellent tool for creating one. This can be done in two approaches, and the steps shown below can help in creating a template in MS Word.
The following guide on how to make one is supported by a decision tree example template.
By using the shape library
The first approach uses the “insert-shapes” steps, which require manual addition and shapes to create a comprehensive decision tree.
The steps undertaken in this approach are as follows:
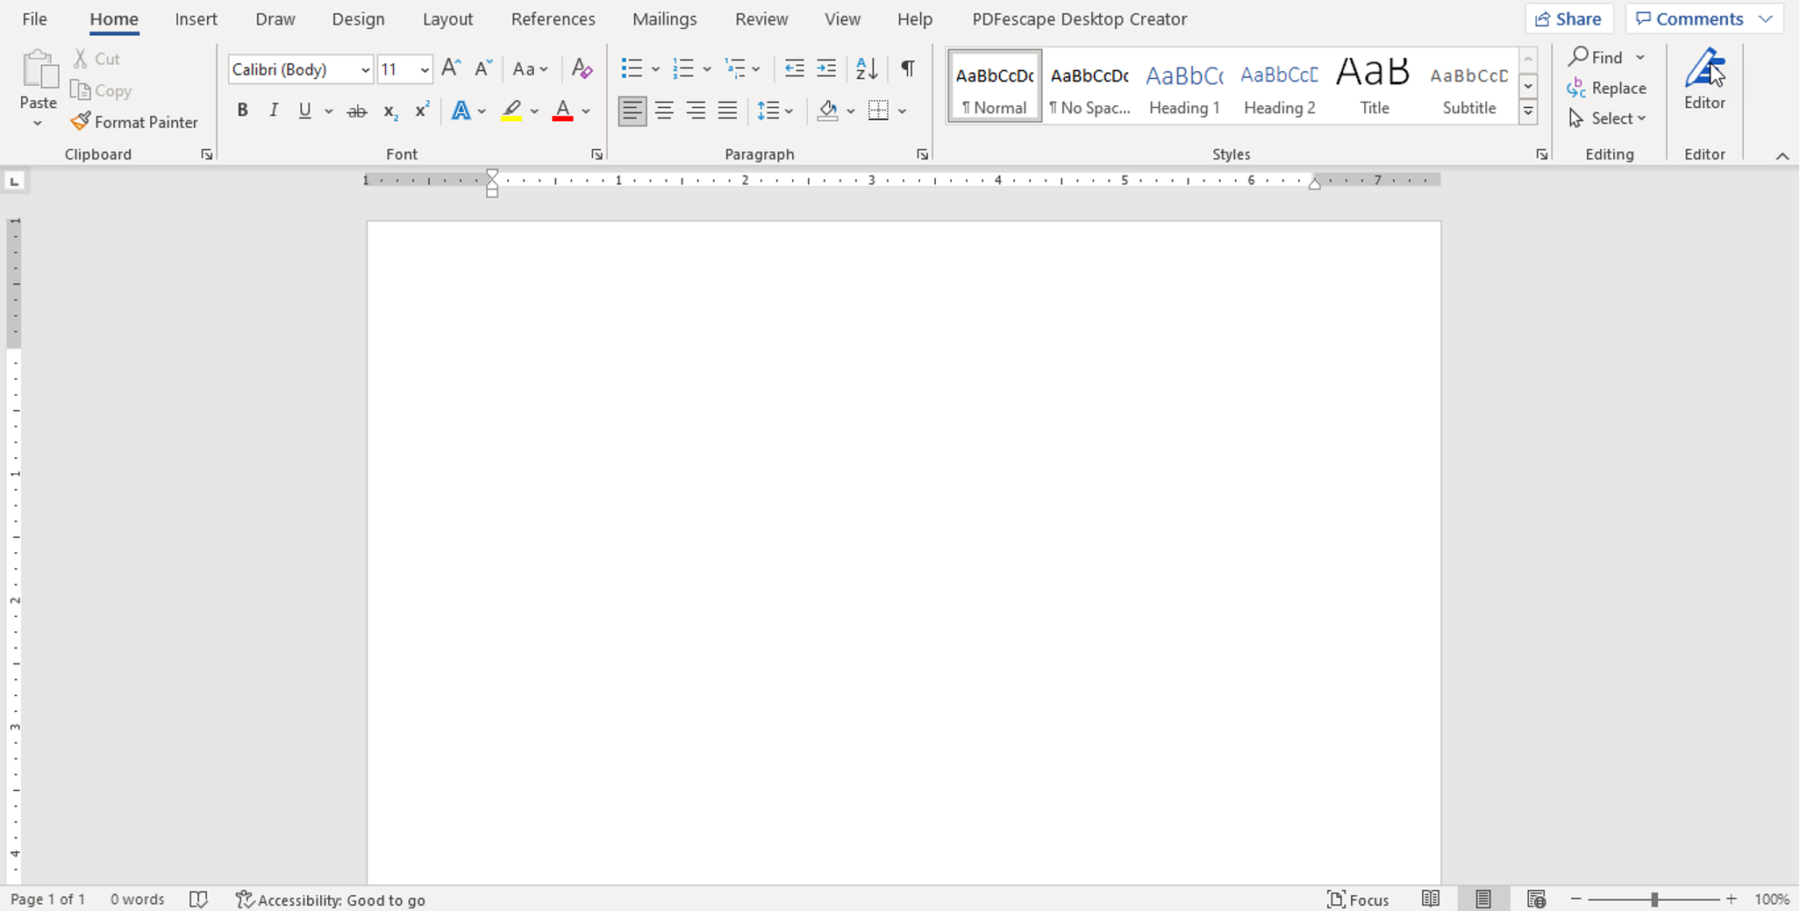
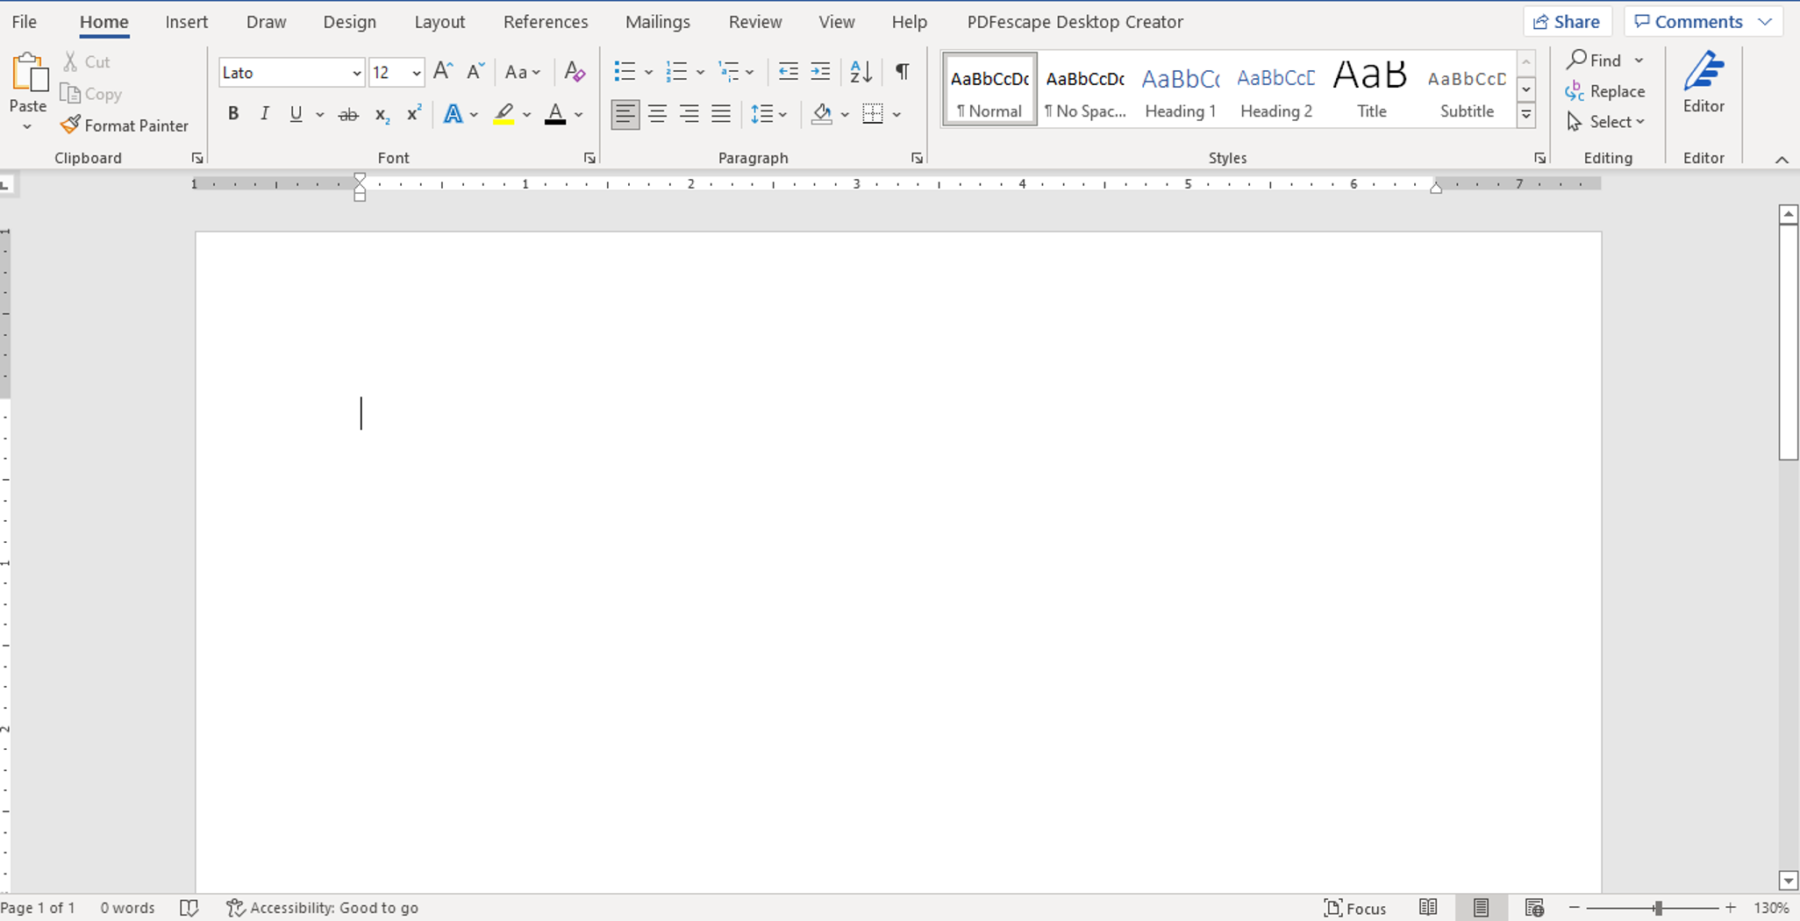
Open MS Word
Launch MS Word software and create a new blank document. If MS Word is not preinstalled, download, and install.
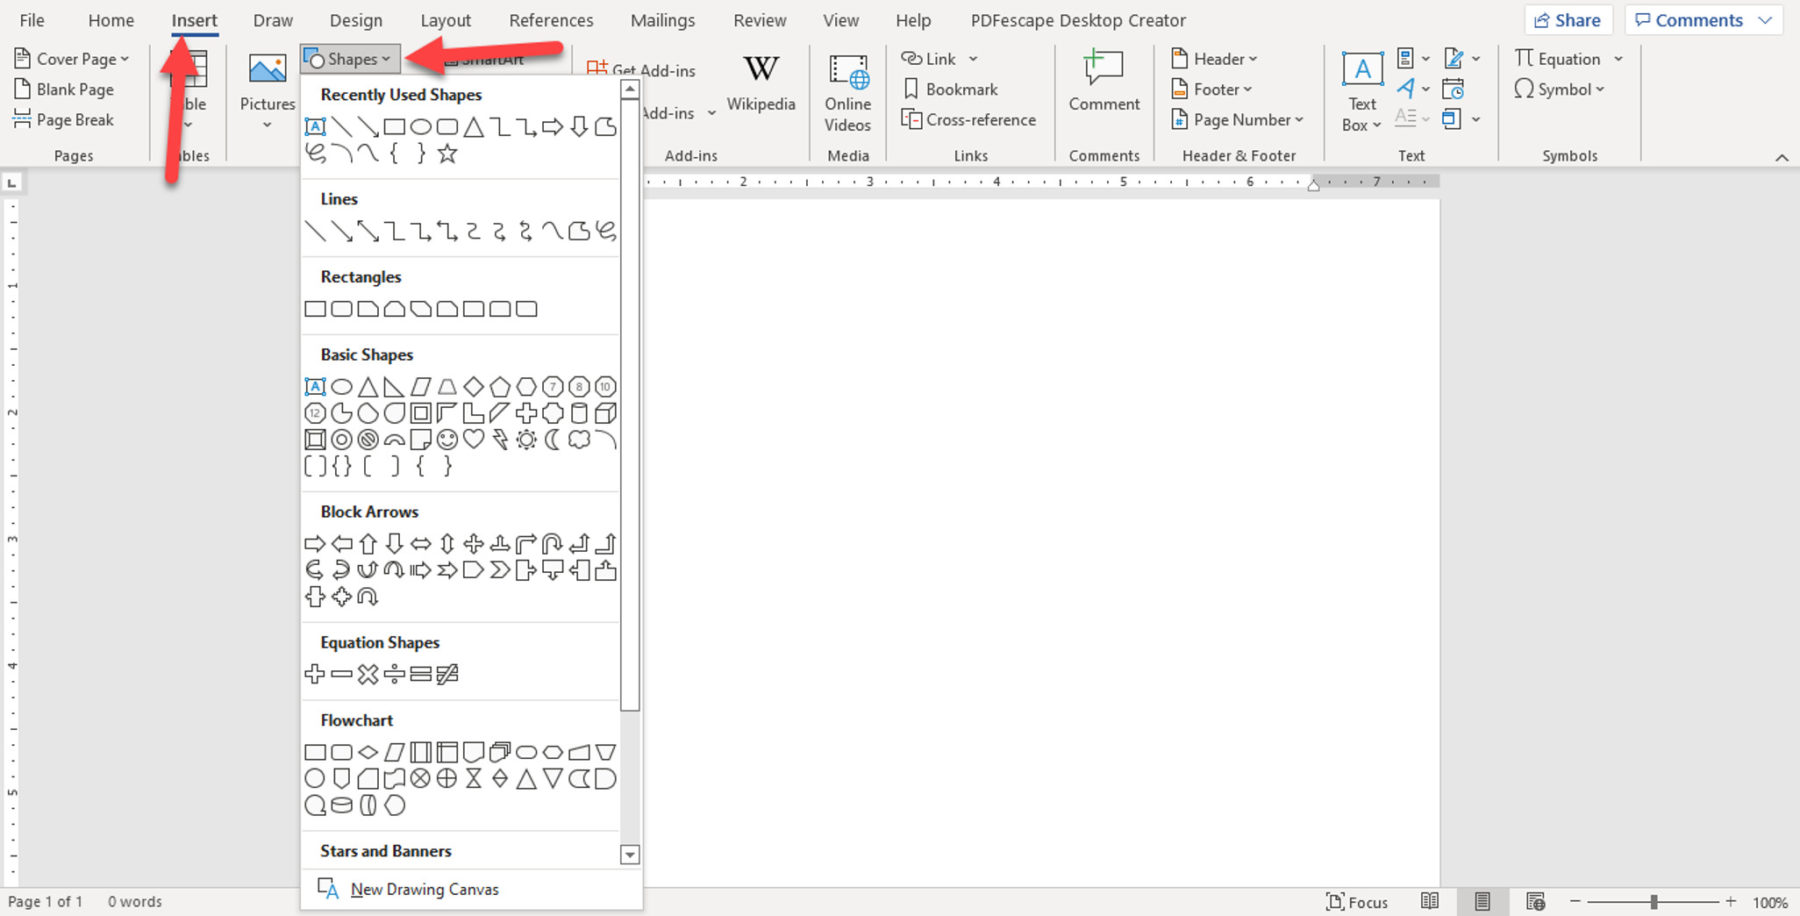
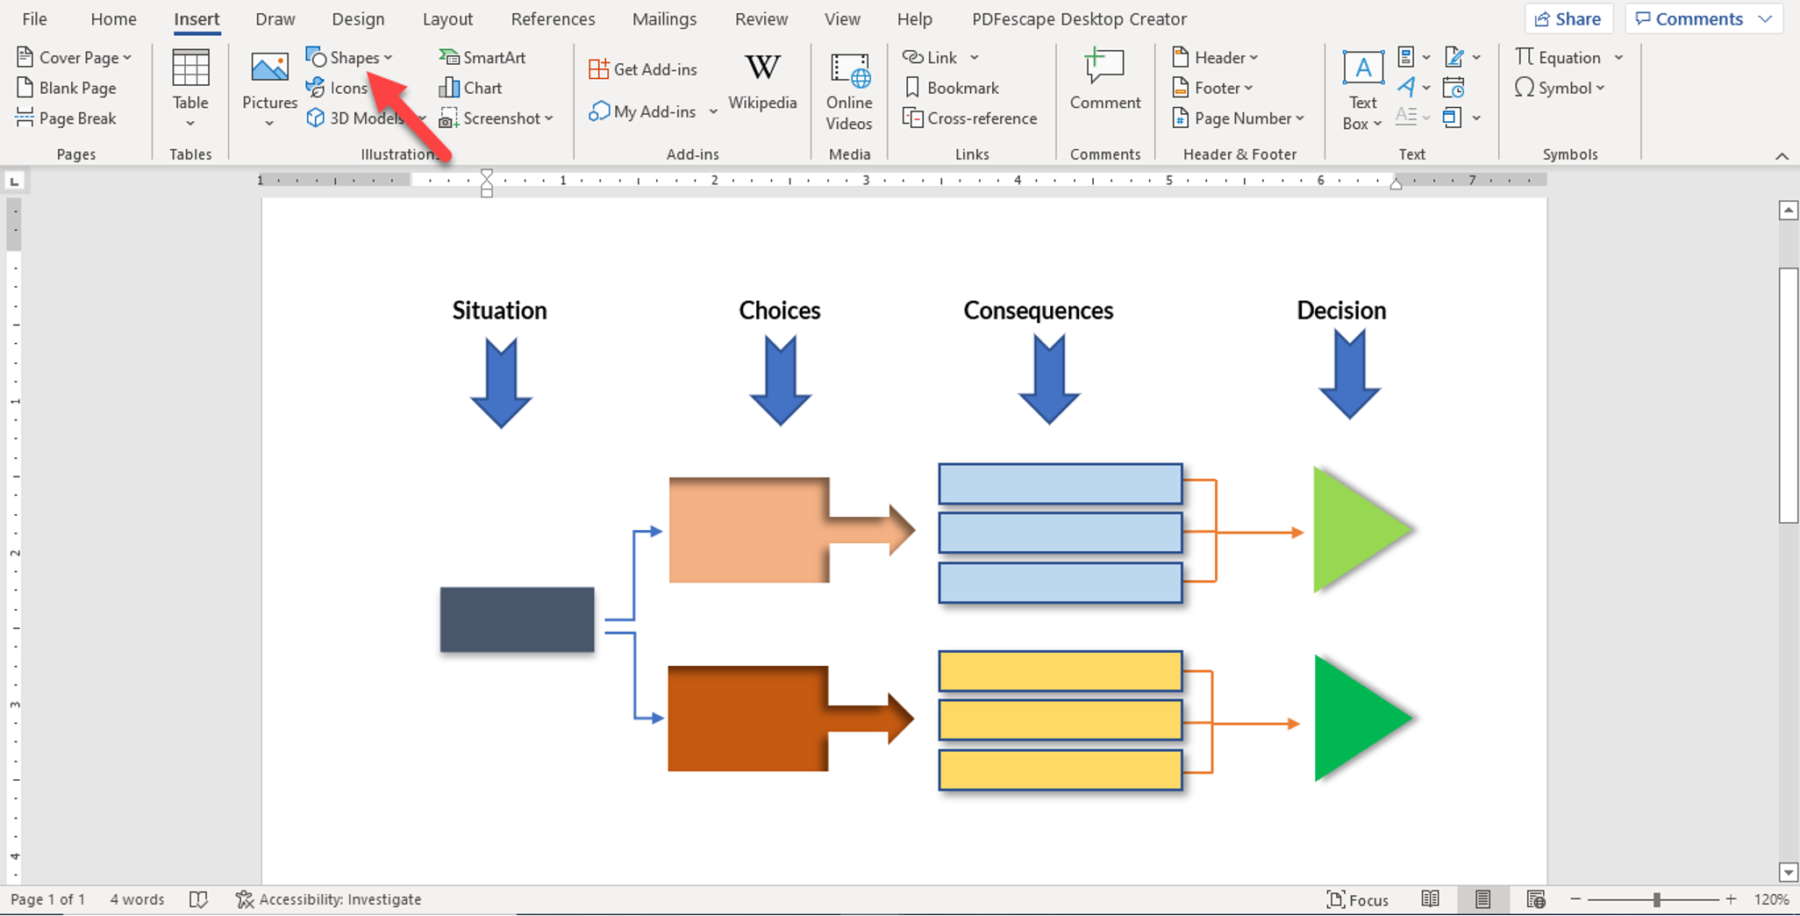
Go to Insert>Illustrations >Shapes
Navigate to the “Insert” option, move the cursor to the illustrations segment and click on “Shapes.” This is where to get any shape of the decision tree. Start with a box as the root node.
Add shapes and lines
Expand the template by adding shapes and lines depending on what needs to be added. Complete each branch or course of action until the predicted or desired outcome has been reached. Finally, insert triangles as the end nodes to indicate the end of the decision path.
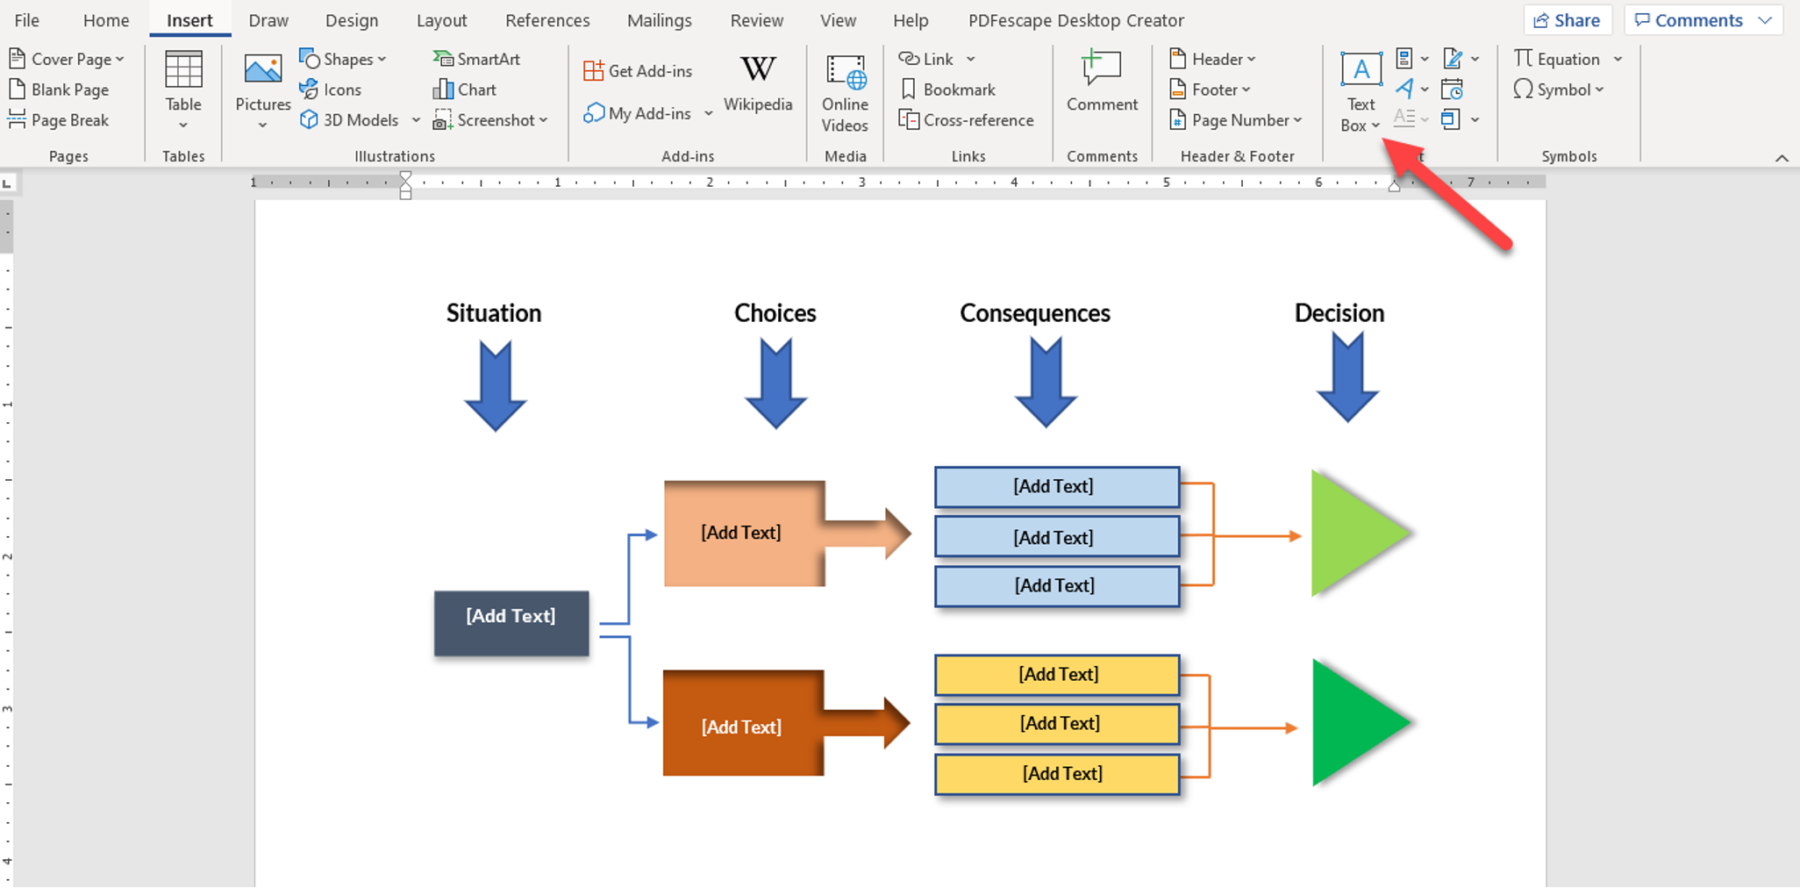
Add text
Next, add text to the elements of the decision tree. Go to “Insert,” under the text section, and click on “Text box.” Place the text boxes at the appropriate places on the decision tree template and type the information needed.
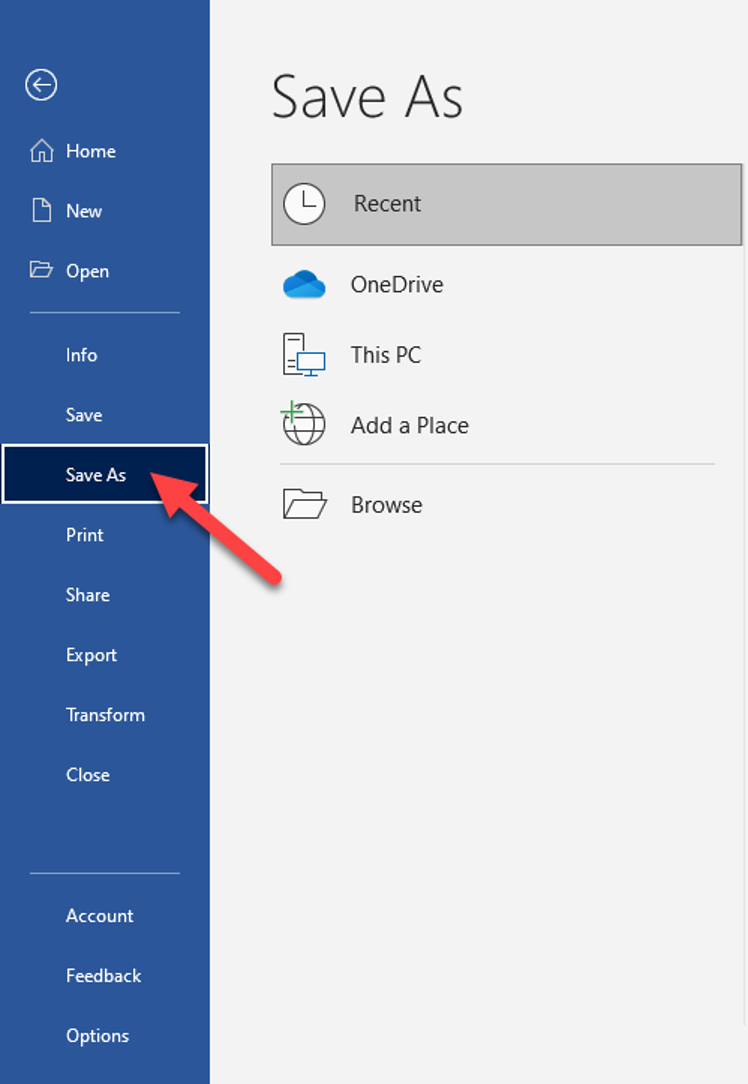
Save the document
Lastly, save the document in the format that is required. Go to “File,” and scroll to “Save As,” and select where to save the document and add its title before saving.
Method 2: By using SmartArt
The second approach involves using the SmartArt tool found in MS Word. It also requires the manual addition of elements of a decision tree and editing. Below is a precise guide on using SmartArt to create one.
Open MS Word
Start by launching the software and creating a blank document. This is where the decision tree will be drawn.
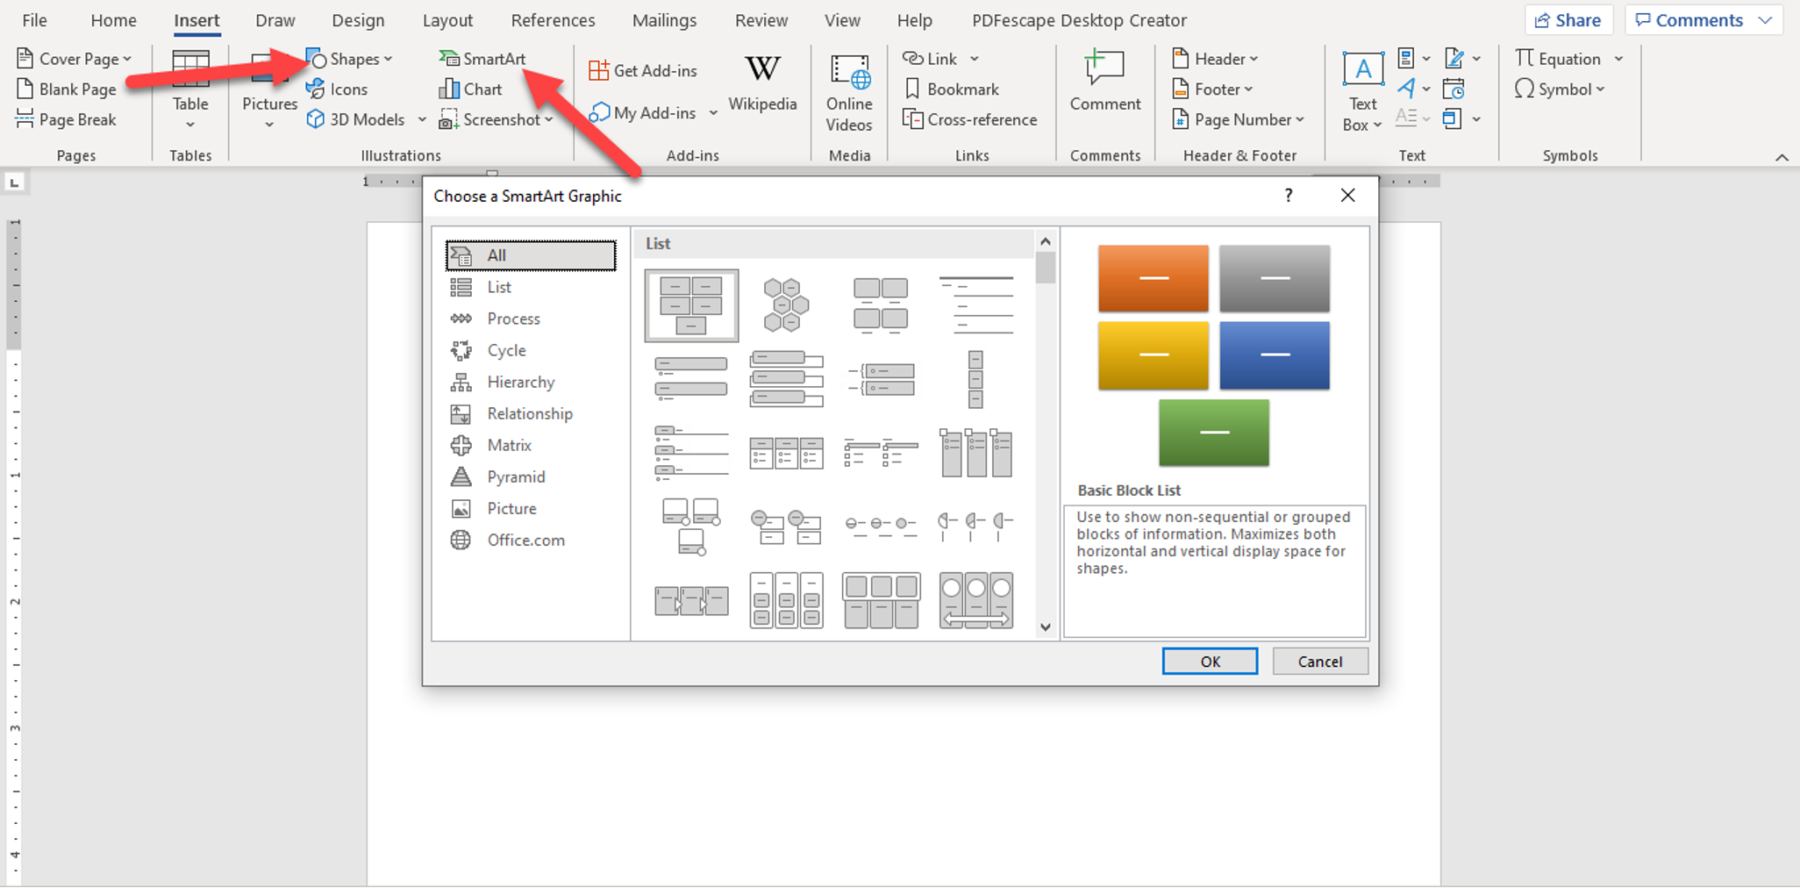
Go to Insert>Illustrations>SmartArt
Move the cursor to the “Insert” command and under the illustrations section, click on “SmartArt.” A drop-down menu will appear.
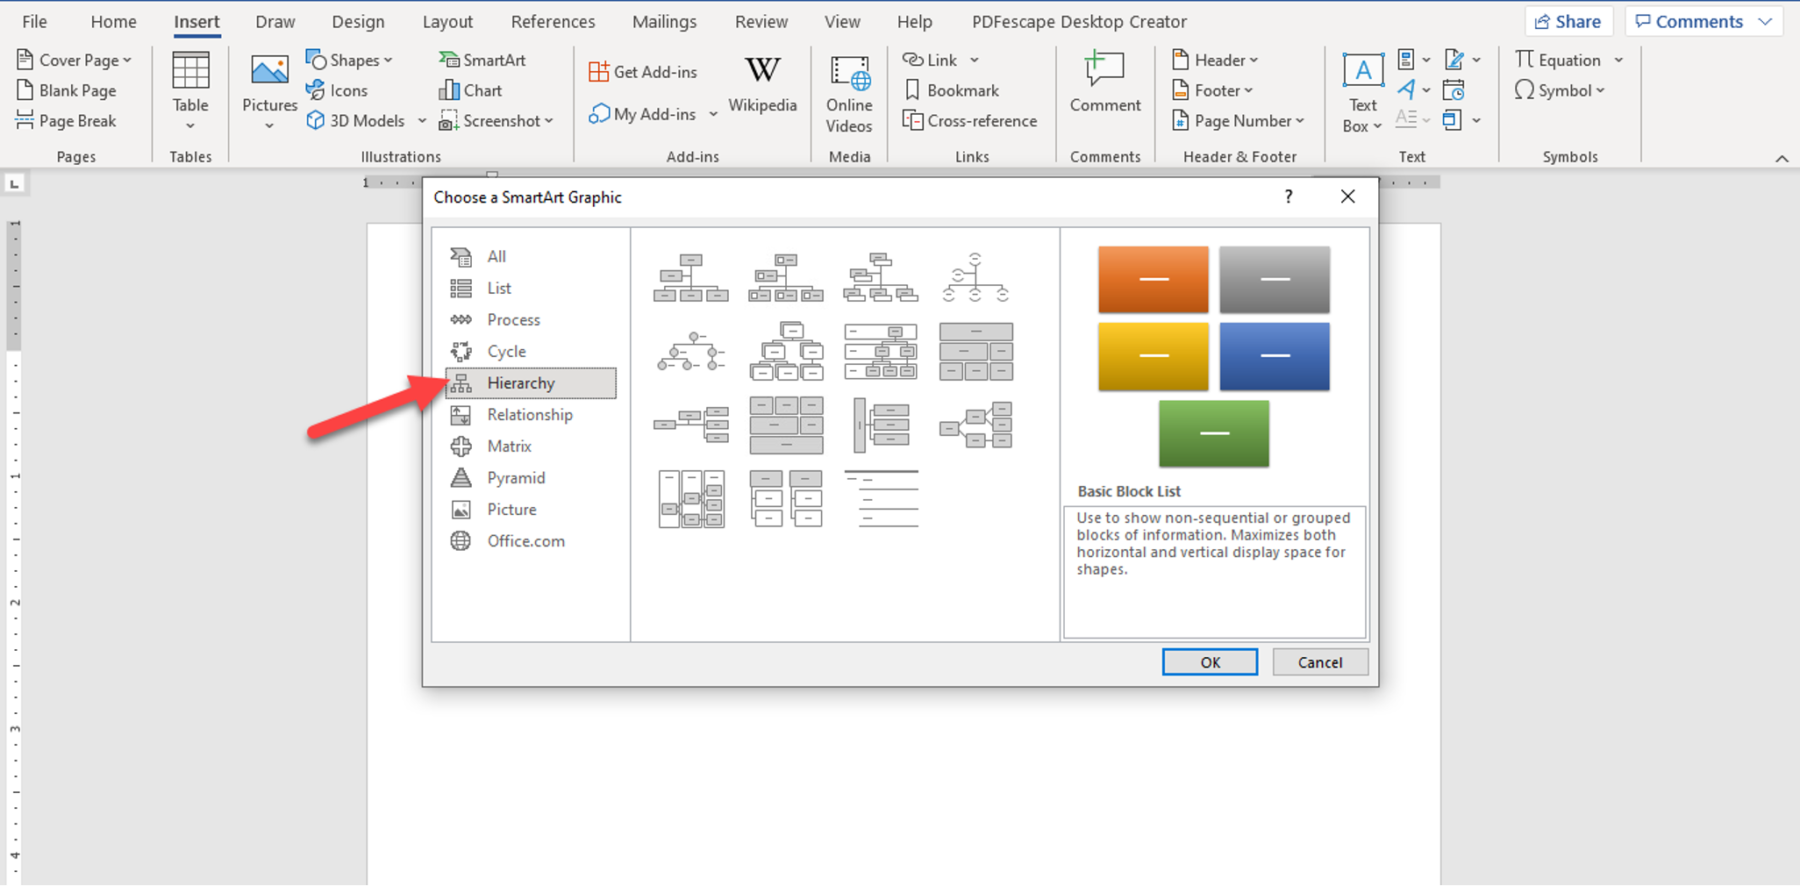
Go to ‘hierarchy’
Next, move the cursor down up to the “hierarchy” and select. Choose the diagram that best suits the decision tree at hand.
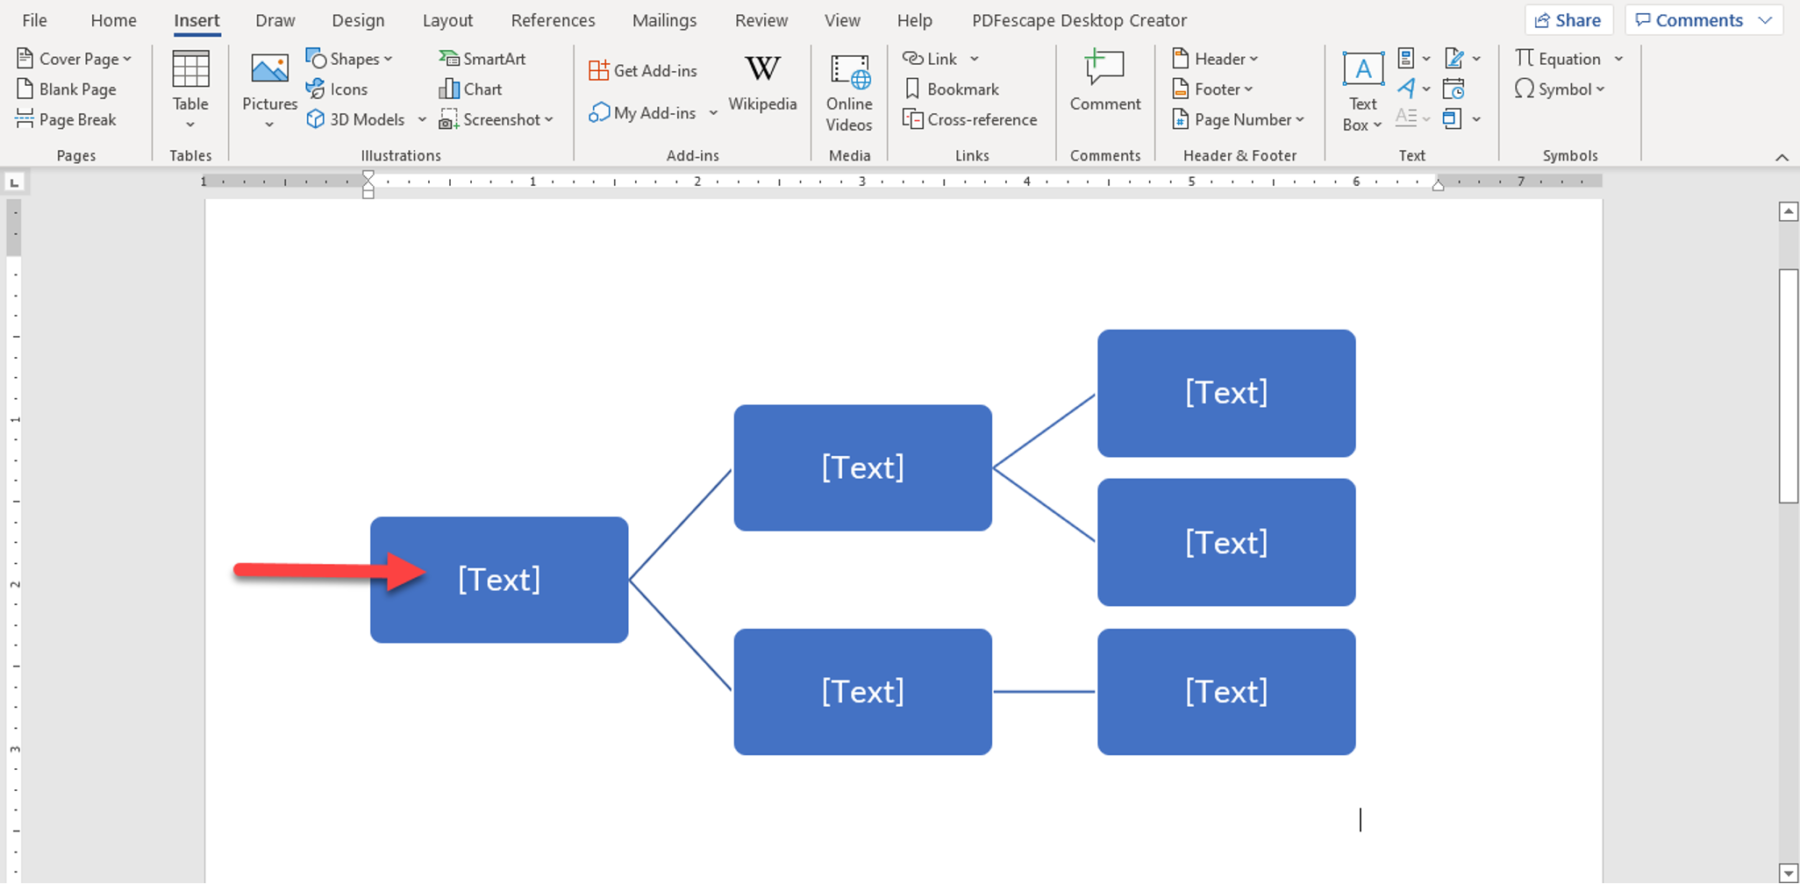
Add text
Afterward, add text to the elements of the decision tree template. Double-click on “Text” or do so in the dialogue box on the side of the diagram.
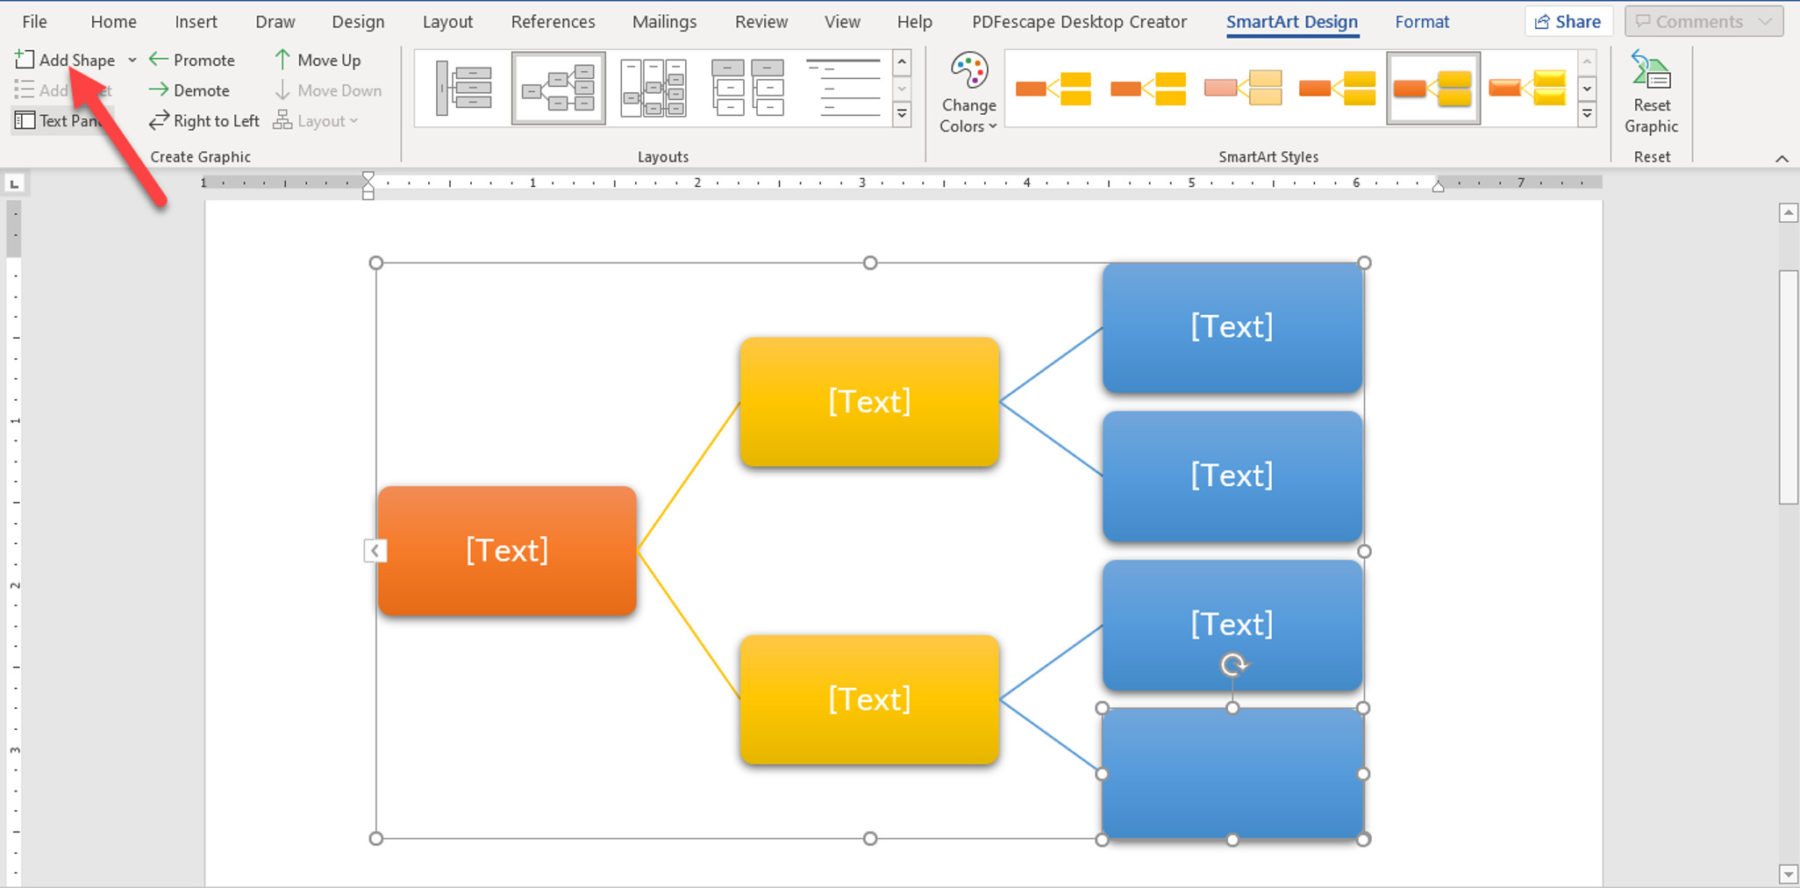
Make the decision tree bigger by clicking ‘add shapes’
Expand the decision tree by adding shapes. Move the cursor to the “Add shapes” command at the top left corner. Click on the arrow to select where to place the shape. Repeat for any decision or chance in the decision tree until an outcome arrives.
Save the document
To conclude the process, save the document, and label it to suit the business domain or purpose of the decision. Then, save it in the preferred format.
Pros and Cons of a Decision Tree
As much as decision trees are rewarding to decision-makers, they are associated with risks. Below are the merits and demerits of these templates.
Pros
The pros include:
- The first most significant benefit of this approach is to make the process of arriving at a decision pretty effective.
- Decision trees are generally easy to interpret and can be shared with stakeholders who do not have technical knowledge on a decision.
- This approach enables all the options to be contemplated clearly and weighed well before the final selection.
- It is simple to combine decision trees with other decision-making tools as they are flexible and easily adaptable.
- They can be used in multiple scenarios as they can be used for prediction and classification without necessarily doing heavy calculations.
- When using decision trees, rules such as “yes and no” can easily be defined in decision-making.
- These are equally effective when analysing numerical and non-numerical data and continuous and categorical variables.
- It is easy to identify elements that are most important for classification or prediction through a decision tree.
- In scenarios where there is little or no complex data, a decision tree can be used as it does not require extensive data.
- It allows decision-makers to analyse multiple outcomes, from the best to worst expected outcomes.
- This approach also enables the problem to be analysed in ways that the traditional approach cannot match or come close to.
- A decision tree is easy to update as new options can be added to existing ones.
- They are suitable for analysing both categorical and continuous variables.
Cons
Below are the cons of using decision trees.
They include:
- Uncertain values or data points can lead to complex decision trees with uncertain outcomes.
- They can be cumbersome, especially when decision paths have multiple chance variables, especially in predictive analysis.
- When using decision trees, minor changes in the data can result in significant structural changes, which would result in a redo of the entire decision path. This makes them unstable for ever-changing scenarios.
- The use of decision trees can lead to errors in classification problems, especially those with many classes and a limited number of examples.
- Information obtained from decision trees can be biased, especially when an imbalanced dataset is used – one set of data is dominant over the other.
- Prediction in data tree analysis can be relatively inaccurate and lower compared to other predictive techniques like influence diagrams.
- Decision trees are not suitable for estimation where the objective is to predict the value of a continuous decision element.
Conclusion
A decision tree visually displays the decisions that can be made in a situation and the probable costs, consequences, and outcomes. It will typically stem from a single node (event or decision) and branch into multiple alternative decision paths, which are evaluated to select the best course of action. Each template will typically contain decision nodes, chance nodes, end nodes, root nodes, leaf nodes, internal nodes, and alternative branches. Decision trees can be drawn on white paper, MS Word, or other decision-making tools.
About This Article