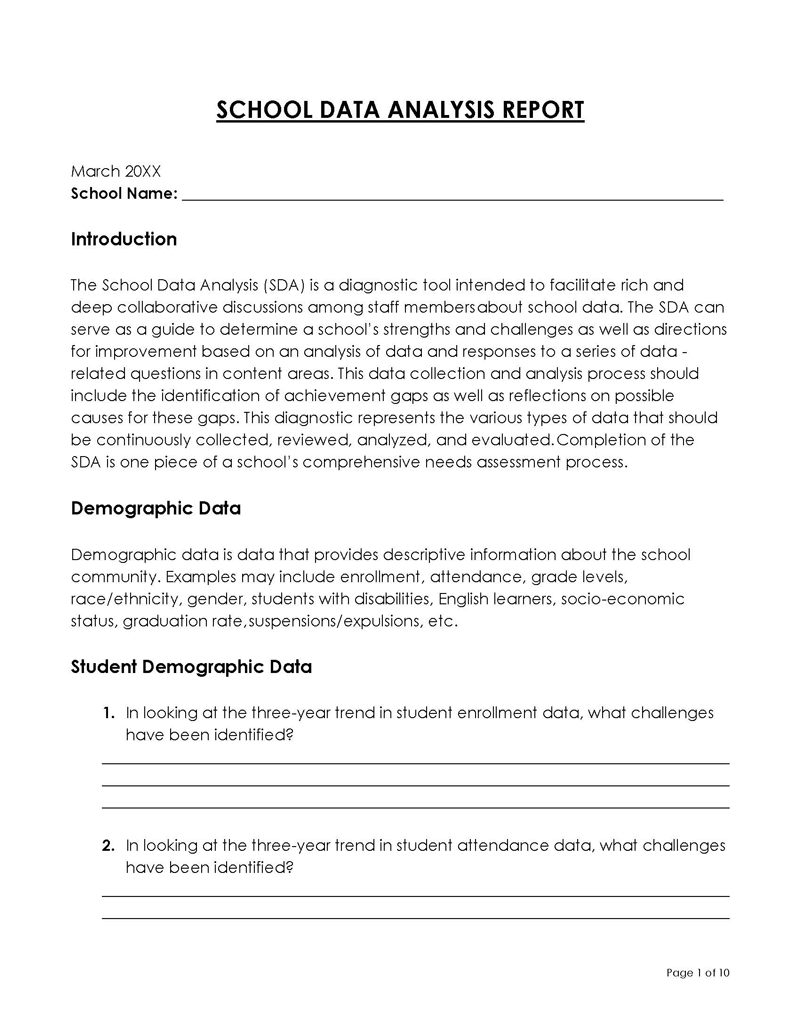
When collecting data for your business to gauge how you are doing, either internally or in the market, it can be hard to analyze all of the details coming in. This is why it’s important to create a Data Analysis Report so that you have a structured document that is easy to understand.
Free Data Analysis Report Templates
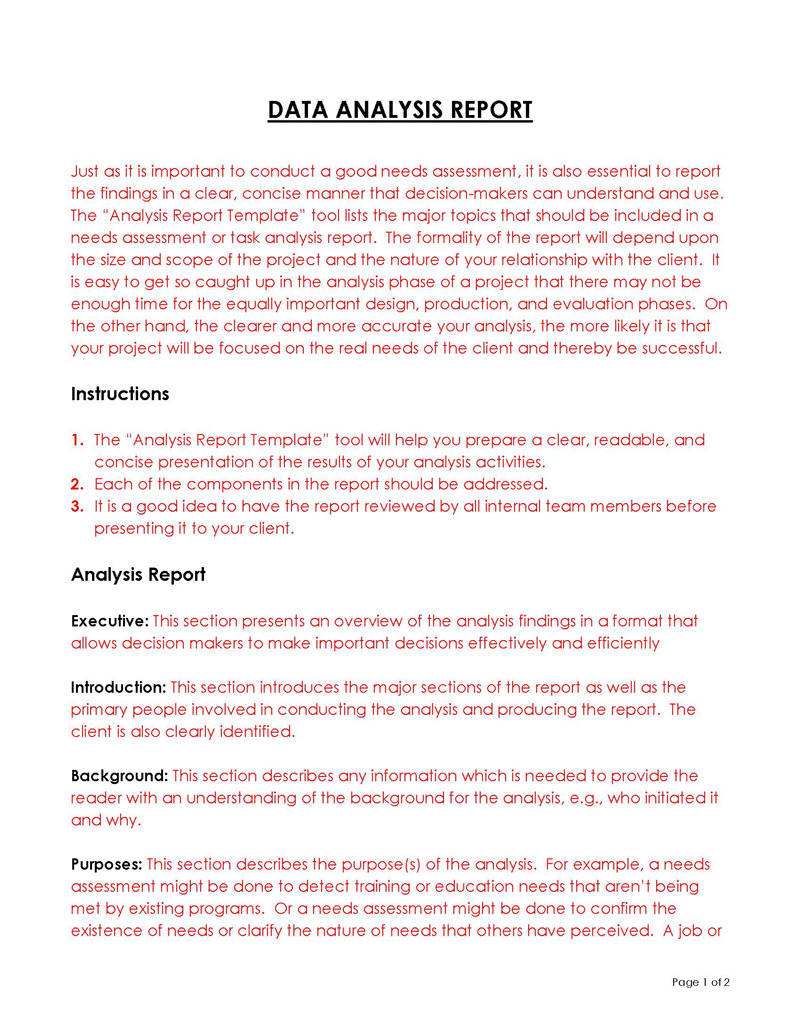
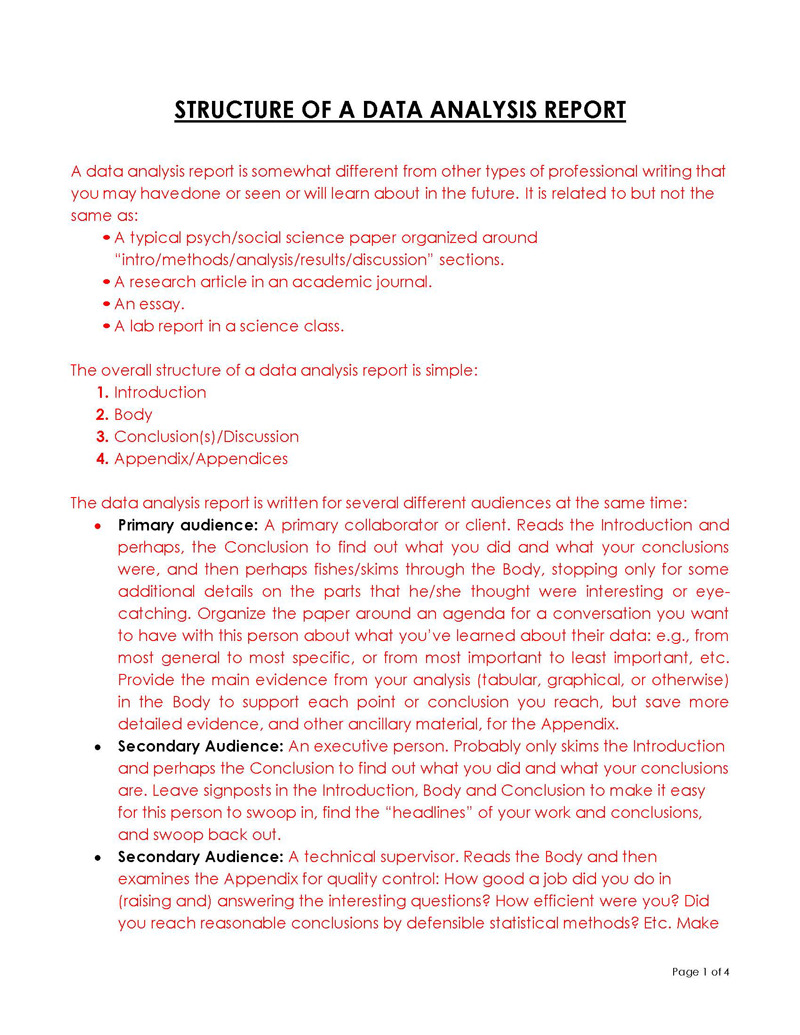
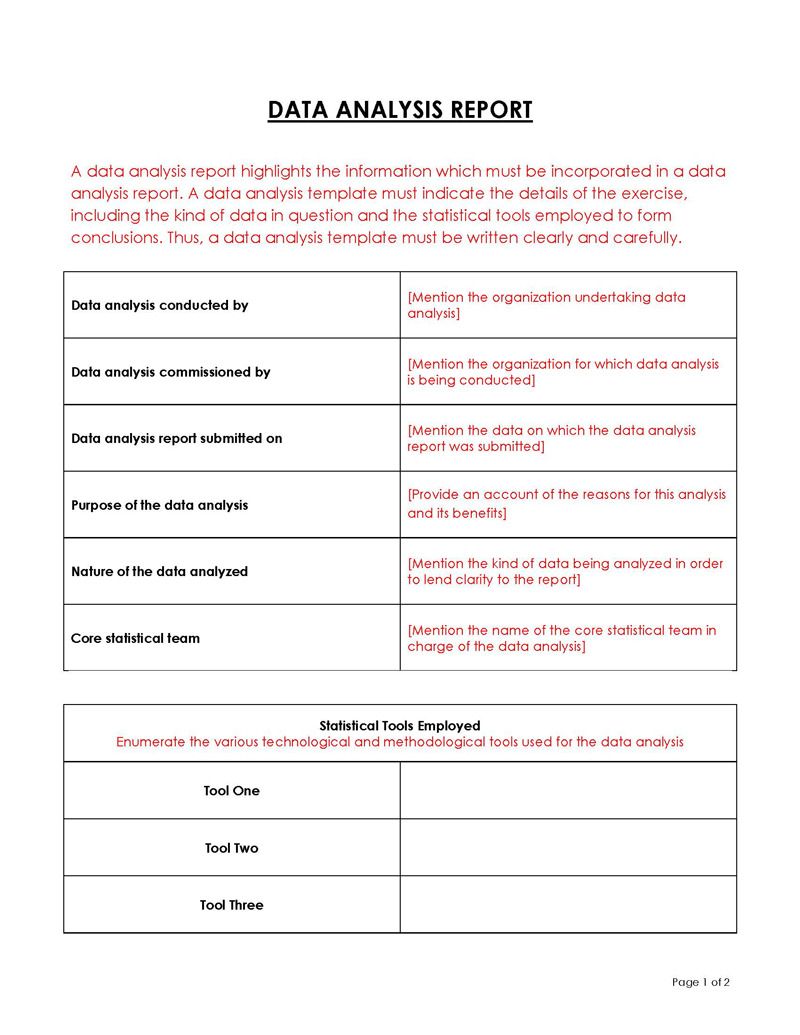
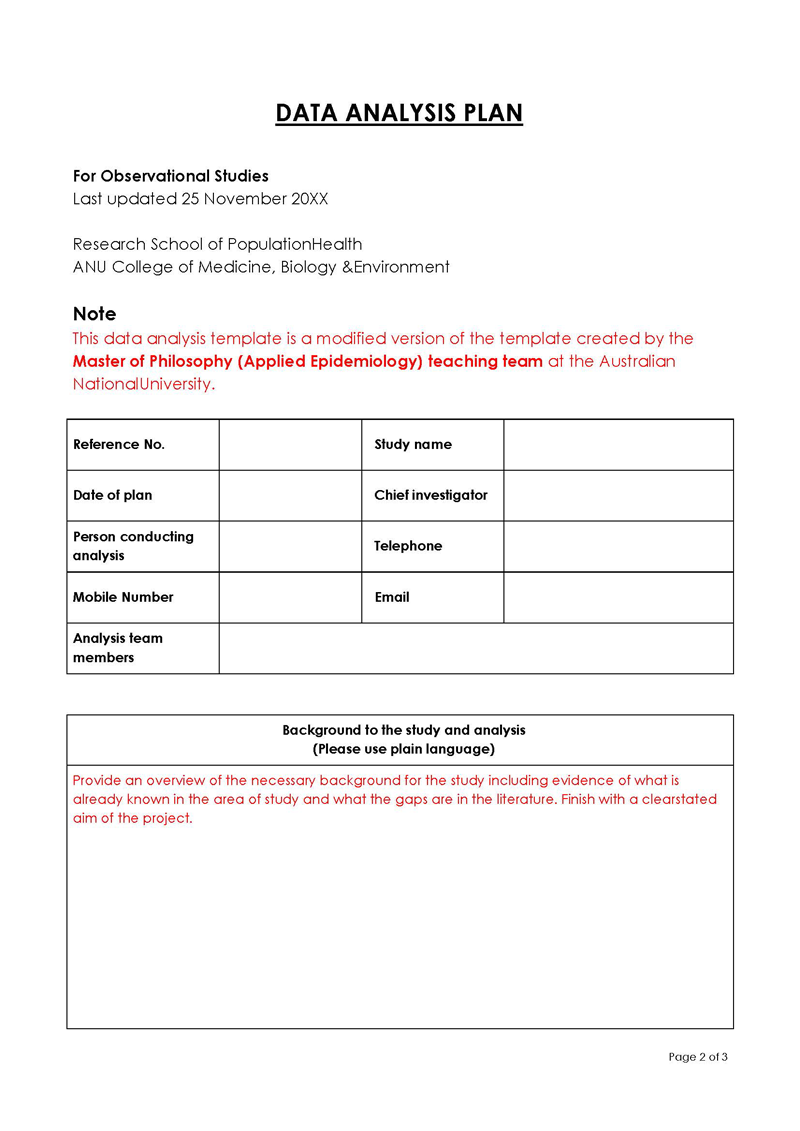
What is Data Analysis?
We tend to link data analysis with research and academic studies. However, it has also become an important function in business. It’s a vital aspect of business and work operations, even more so with the use of digital and technological systems. Data analysis can help find areas of concern that need addressing in a business. It also helps to improve and develop your business by pulling in data regarding sales, marketing, and competition in the market place.
What is a Data Analysis Report?
A Data Analysis Report takes all of the data you have gathered and produces an easy to understand the document. These reports can focus on a number of areas, such as productivity in the workplace, efficiency levels, how effective a marketing campaign has been, and a number of other essential areas in business.
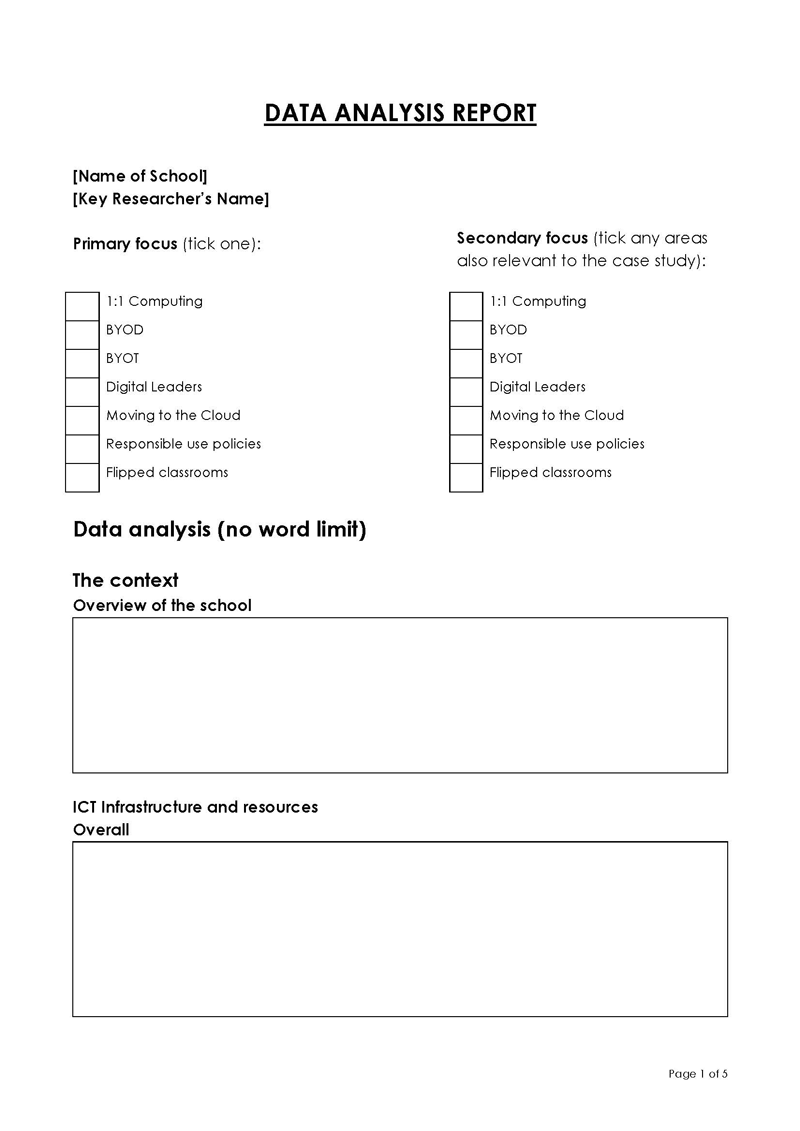
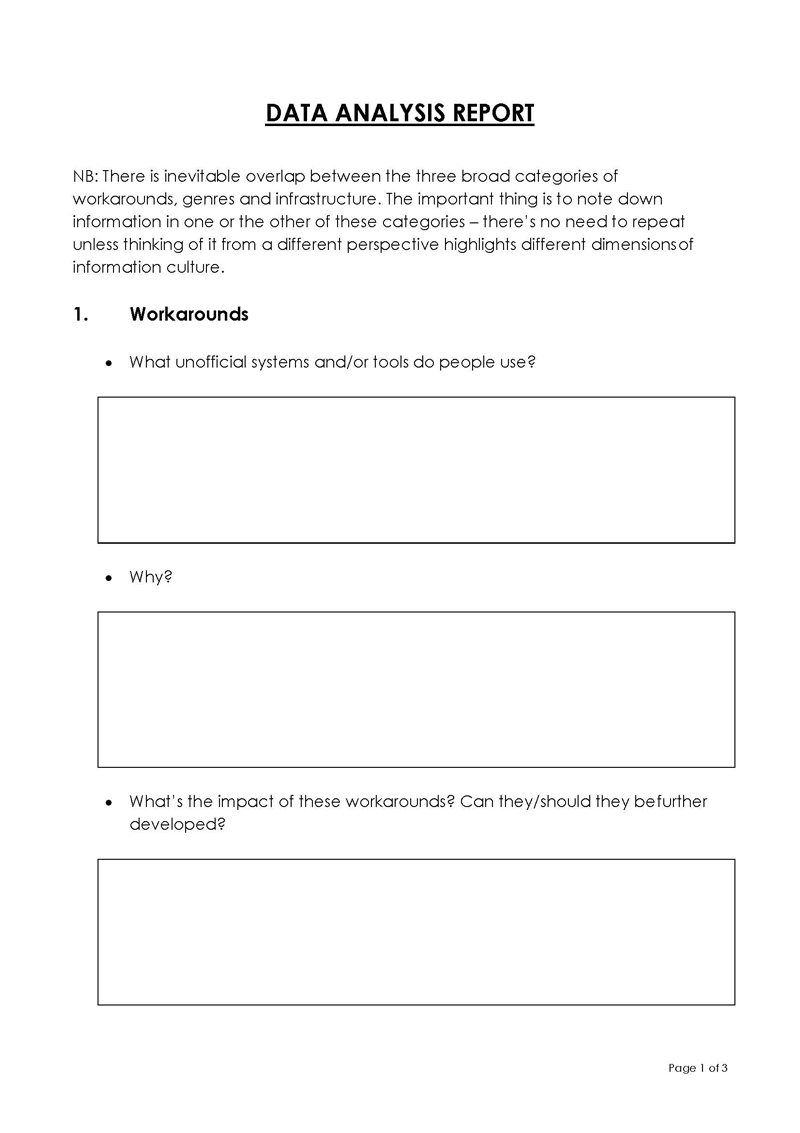
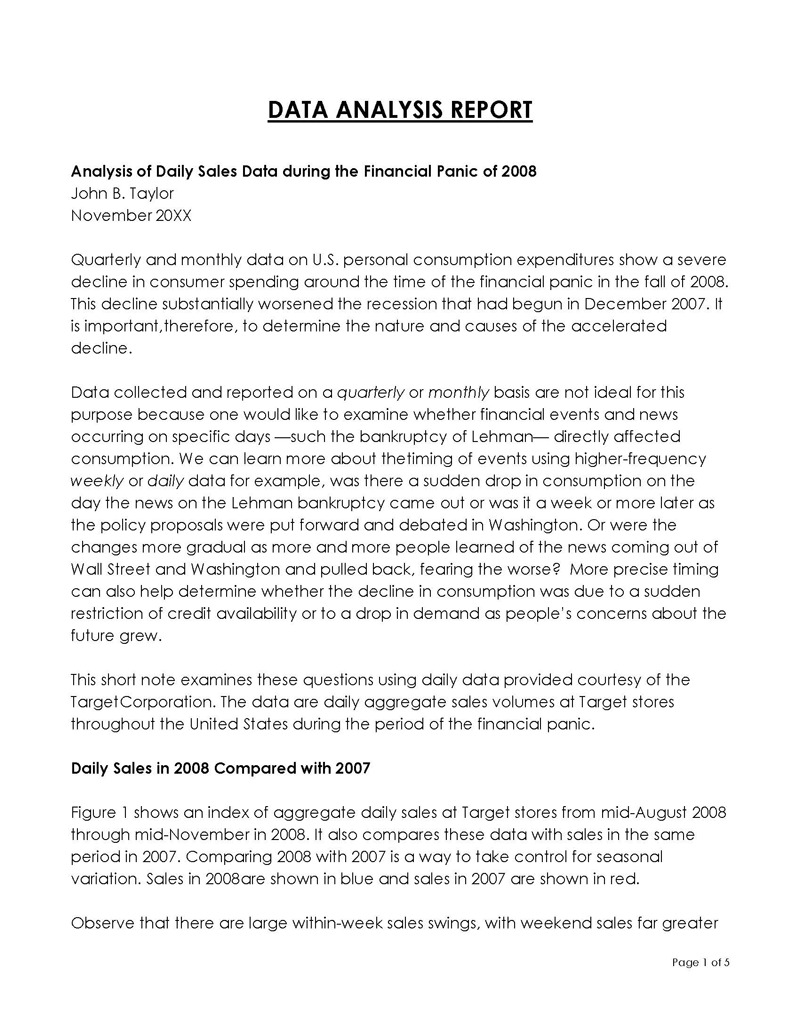
You can download one of our free templates and samples to give you an idea of the different types of Data Analysis Reports that businesses and researchers use to find the right one for your needs.
Qualitative vs. Quantitative Research
There are two different approaches to gathering data for a report, qualitative and quantitative research. They are both important when it comes to gaining different kinds of information.
Quantitative research focuses on statistics, graphs, and numbers. This type of research is generally used for testing theories and for establishing general facts about a certain subject or topic. You see this used with experimental research, surveys, content analysis, and observational research.
Qualitative research focuses on meanings and words. This type of research is used to understand experiences, thoughts, and concepts. It lets you gather some in-depth insight on subjects or topics that aren’t understood very well. You see this used in case studies, focus groups, interviews, and discourse analysis.
How to create and use a Data Analysis Report
There are 5 steps in creating a Data Analysis Report:
- To gather your data, you will need to make a list of all of the details you feel you will need to create the report you want.
- Your next task is to outline the objectives and goals of the report. Ask yourself what the analysis report is for first. This will then make it easier for you to outline those objectives and the goals you want to achieve. Also, be sure to give your report a specific time frame.
- Next step is to find your target audience. This will help you to determine the type of report you need to present to them. Make sure the report is arranged in a way that they can understand it. It’s important that you understand the audience you are making the report for, so try to think like they do to help you better understand what their needs are.
- Use a SWOT Analysis approach when creating your report: Strengths, Weaknesses, Opportunities, Threats. This will help you to keep an eye on and improve areas of weakness, protect you from potential threats in the industry, and tap into opportunities as they arise.
- Your last step (after gathering all of your data into a report) is to recheck it and then make revisions so that there are no errors. Adding some visual aids can also be helpful in getting your points across, such as graphs and charts.
Frequently Asked Questions
A good outline to use for a data analysis report is:
• Overview of the issue
• the modeling and data approach being used
• The results that you have gotten for the data analysis
• Substantive conclusions. Do this by describing the issue and what questions you are attempting to address.
There are two main methods used in data analysis, qualitative and quantitative research. The method you use will be determined by what type of analysis report you wish to present.


