


How to Outline Your College Application Essay | Examples
For college admission, academic achievements and extracurricular activities are not the only components that impact the entry. Another crucial component ...


12 Best Valedictorian Speech Examples
A valedictorian is a student who attains the achievement of the highest academic standing in their class. Valedictorians are honored ...
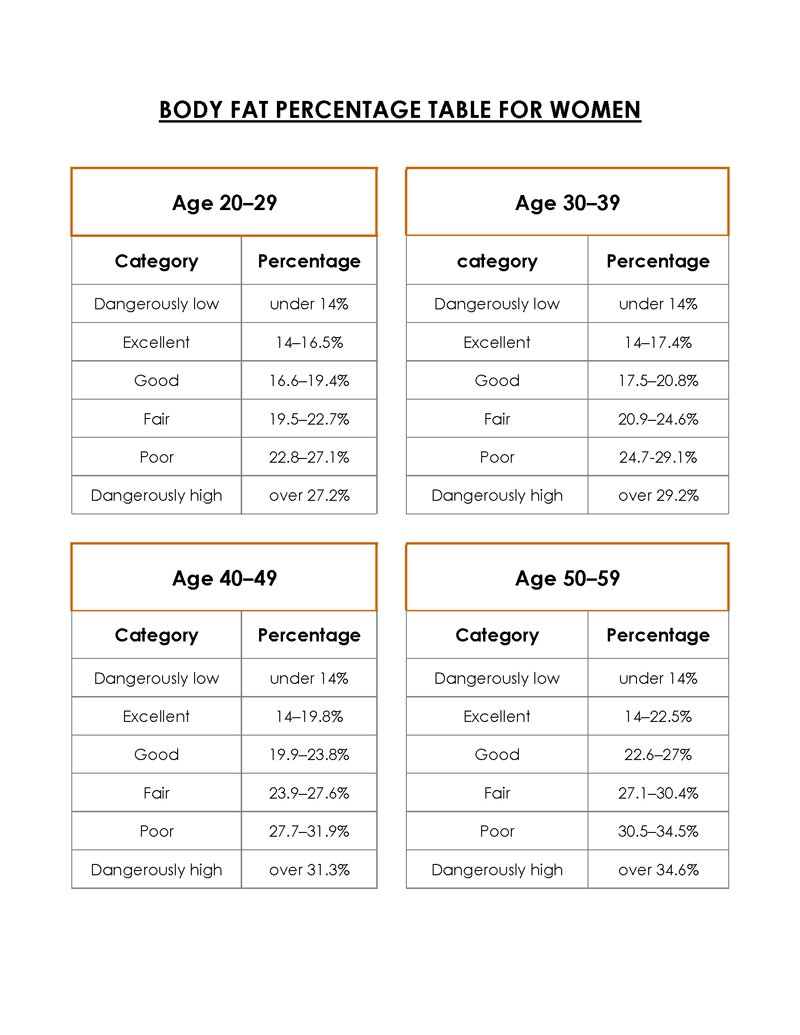
Printable Body Fat Percentage Charts – Free Downloads
Men and women vary on what will be considered high, low, or standard fat when it comes to body fat ...

Free Classroom Management Plan Templates (Editable)
Teaching is an exciting but challenging experience. Most teachers want to maximize their effectiveness and minimize the likelihood of behavior ...

Free Weekly Lesson Plan Templates (Edit & Printable)
The purpose of a weekly lesson plan is to provide a clear and organized framework for teaching a particular subject ...

Free Weight Loss Charts & Templates (Word, Excel)
Weight directly impacts a person’s health. It also influences how people feel about themselves and thus must be monitored frequently. ...

Research Statement Examples: How To Structure + Expert Tips
When applying for a faculty position, a research statement (or summary of research interests) is a document that outlines an ...

12 Functional Behavioral Assessment (FBA) Examples
A Functional Behavioral Assessment (FBA) is a systematic process of identifying behaviors that interfere with a child’s learning and planning ...

22 Free Printable Homework Planners (Templates)
A homework planner serves as an essential tool, similar to a journal, that enables students to keep track of their ...

24 Free Bar Graph Templates (Editable)
A bar graph is a chart that uses bars or strips to graphically represent data, statistics, quantities, and information. This ...

Finding Your Exercise Heart Rate (Free Charts By Gender)
Heart rate is the number of times the heart beats in one minute. Pulse, another name for heart rate, differs ...

24 Free Pie Chart Templates – PowerPoint – Excel
It is a circular graph that you can use to display information. It divides data and statistics into segments within ...