A Flowchart is a diagram that graphically represents a particular process, displays certain information, or illustrates a computer algorithm. A flowchart template is a prepared diagram that can be used to attain this purpose.
With a flowchart, you can communicate a complex process using an easy-to-understand diagram.
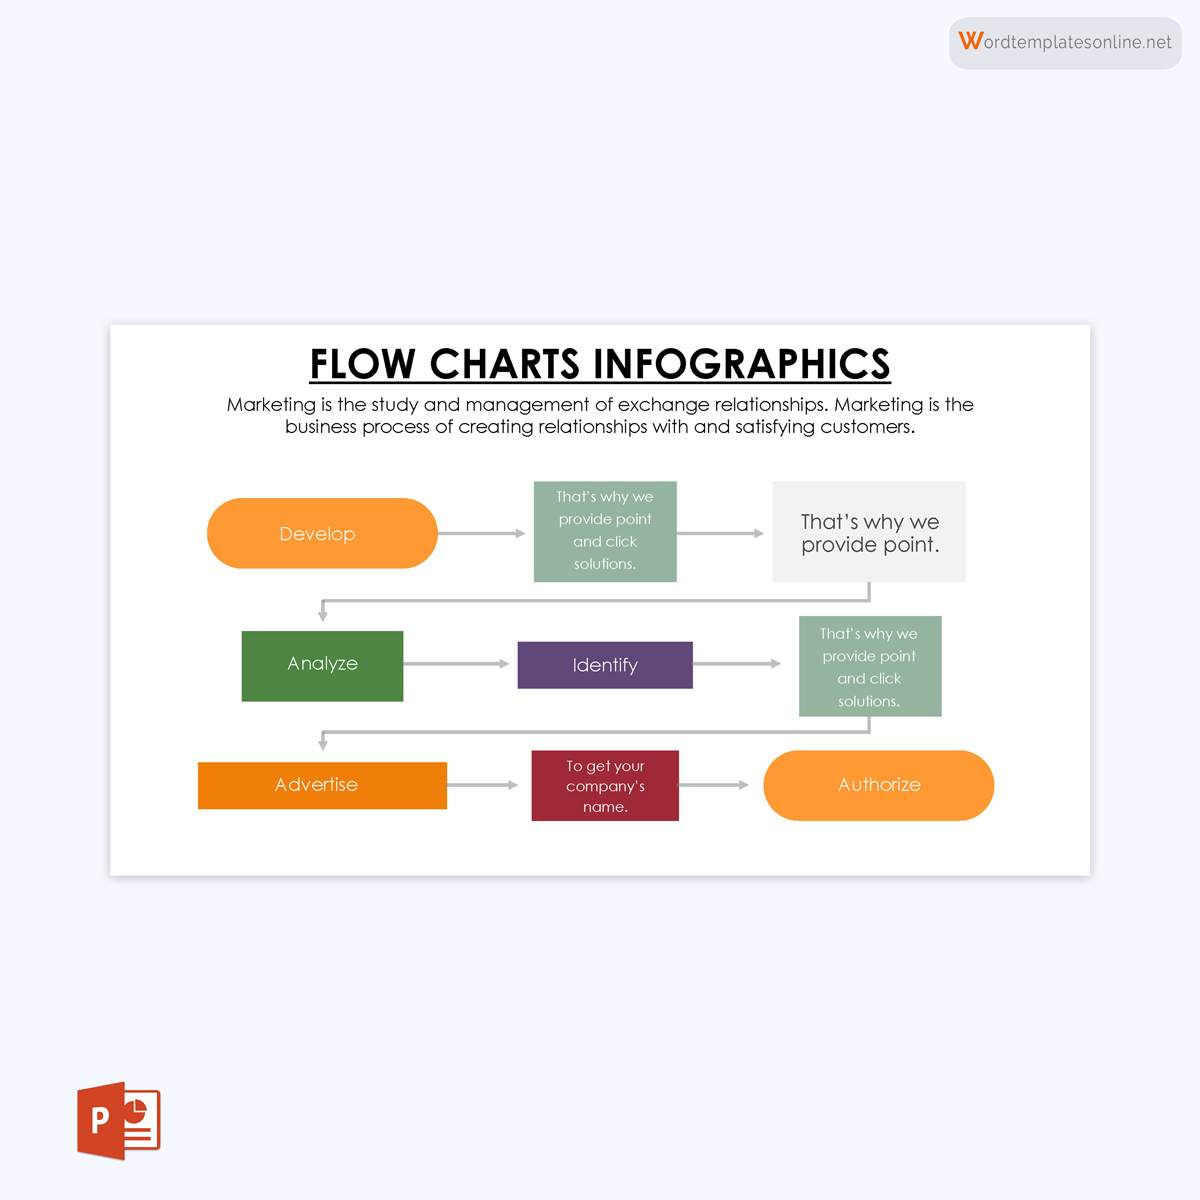
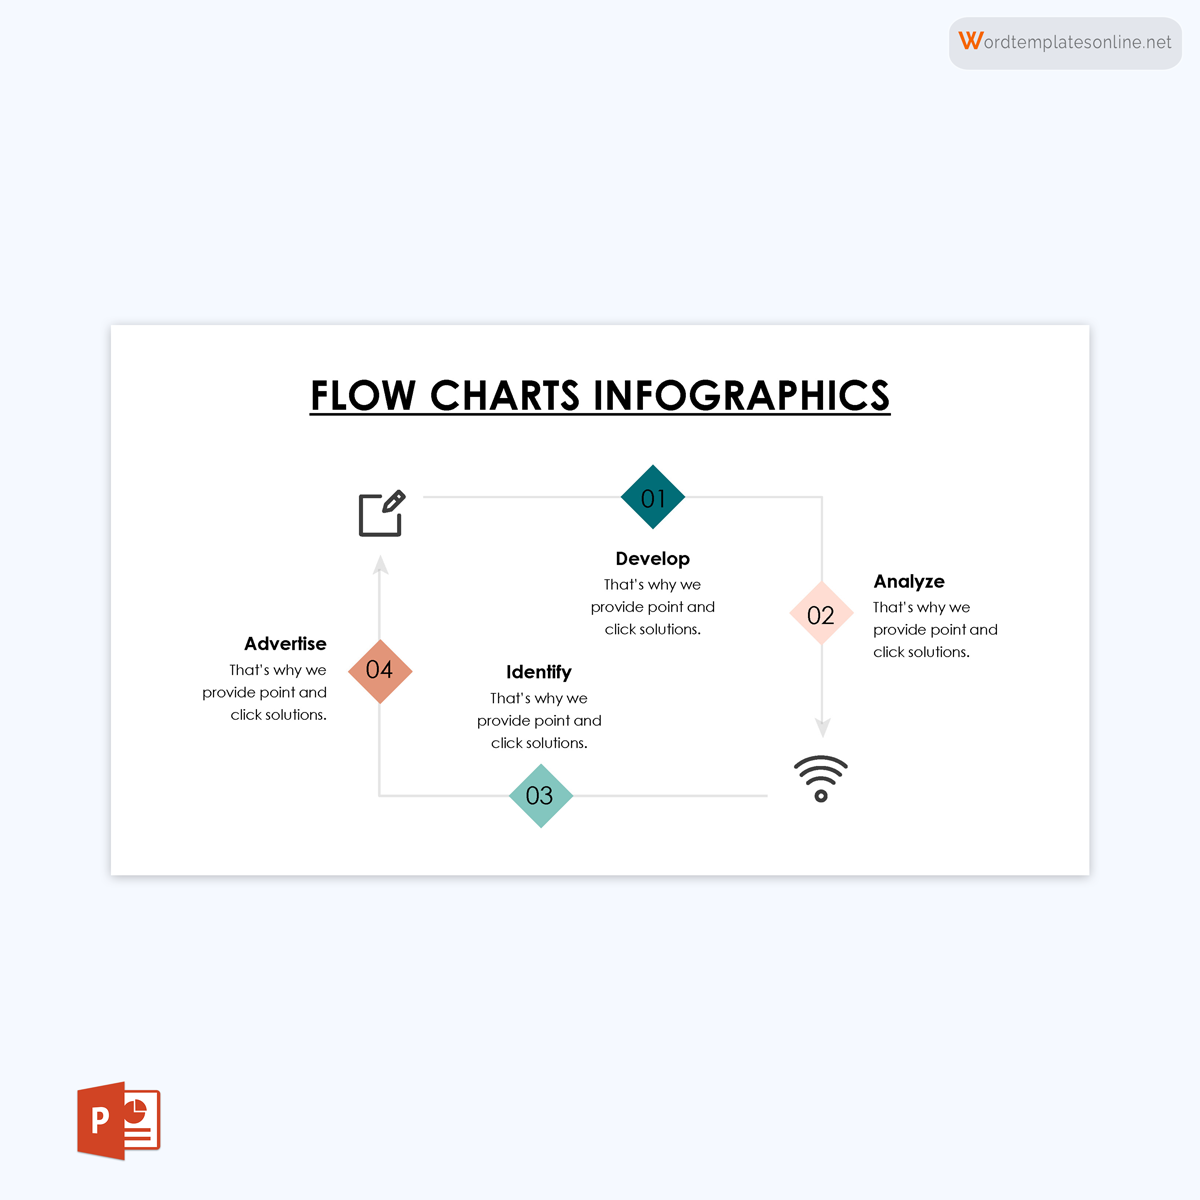
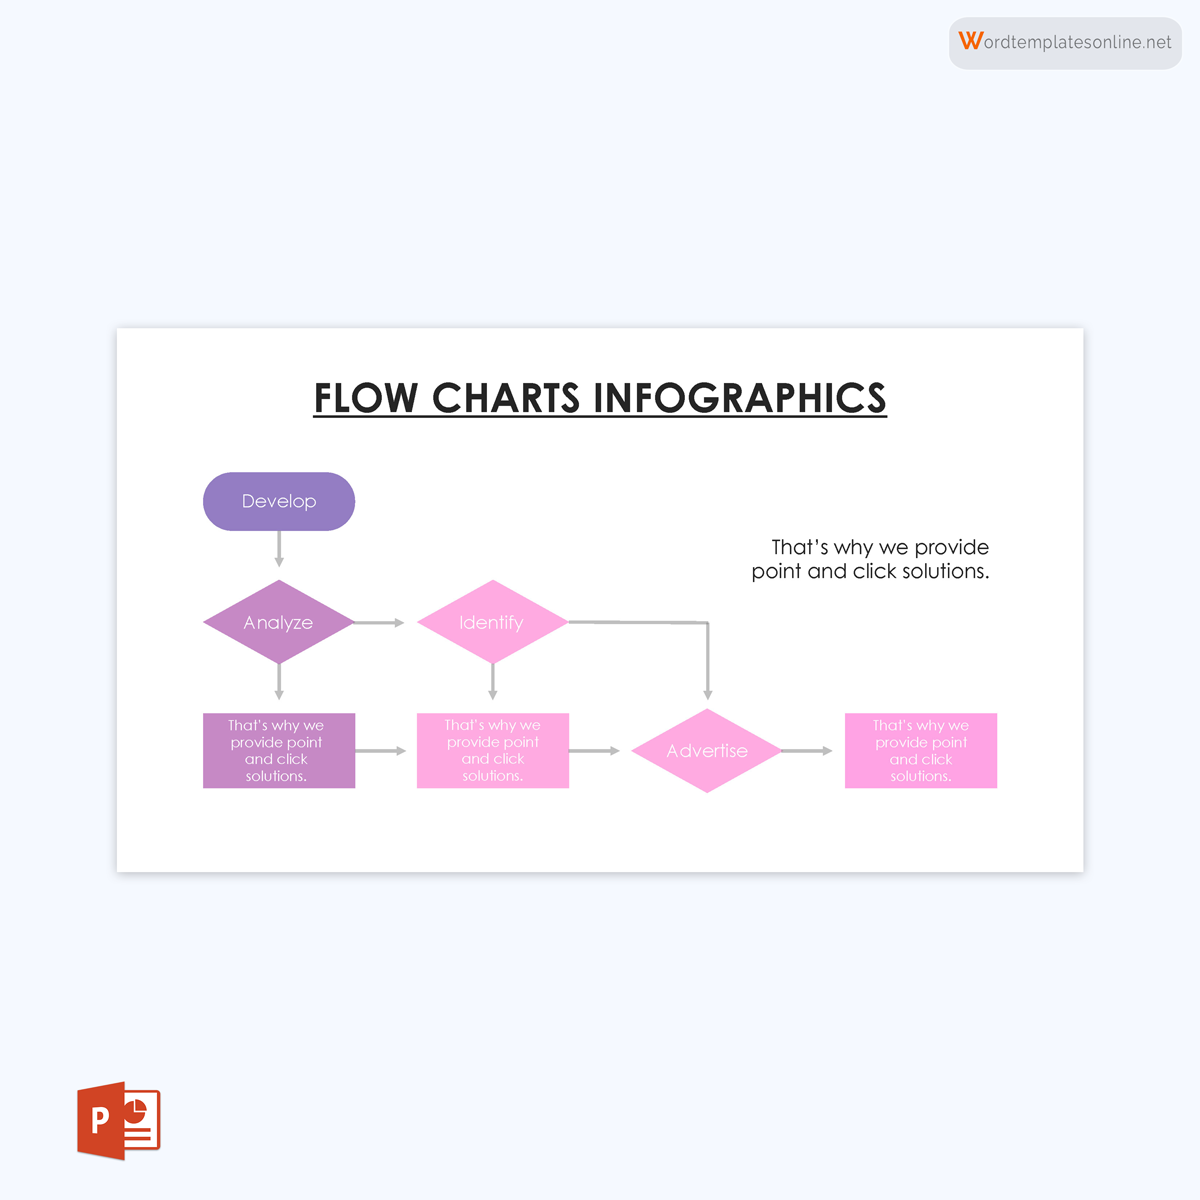
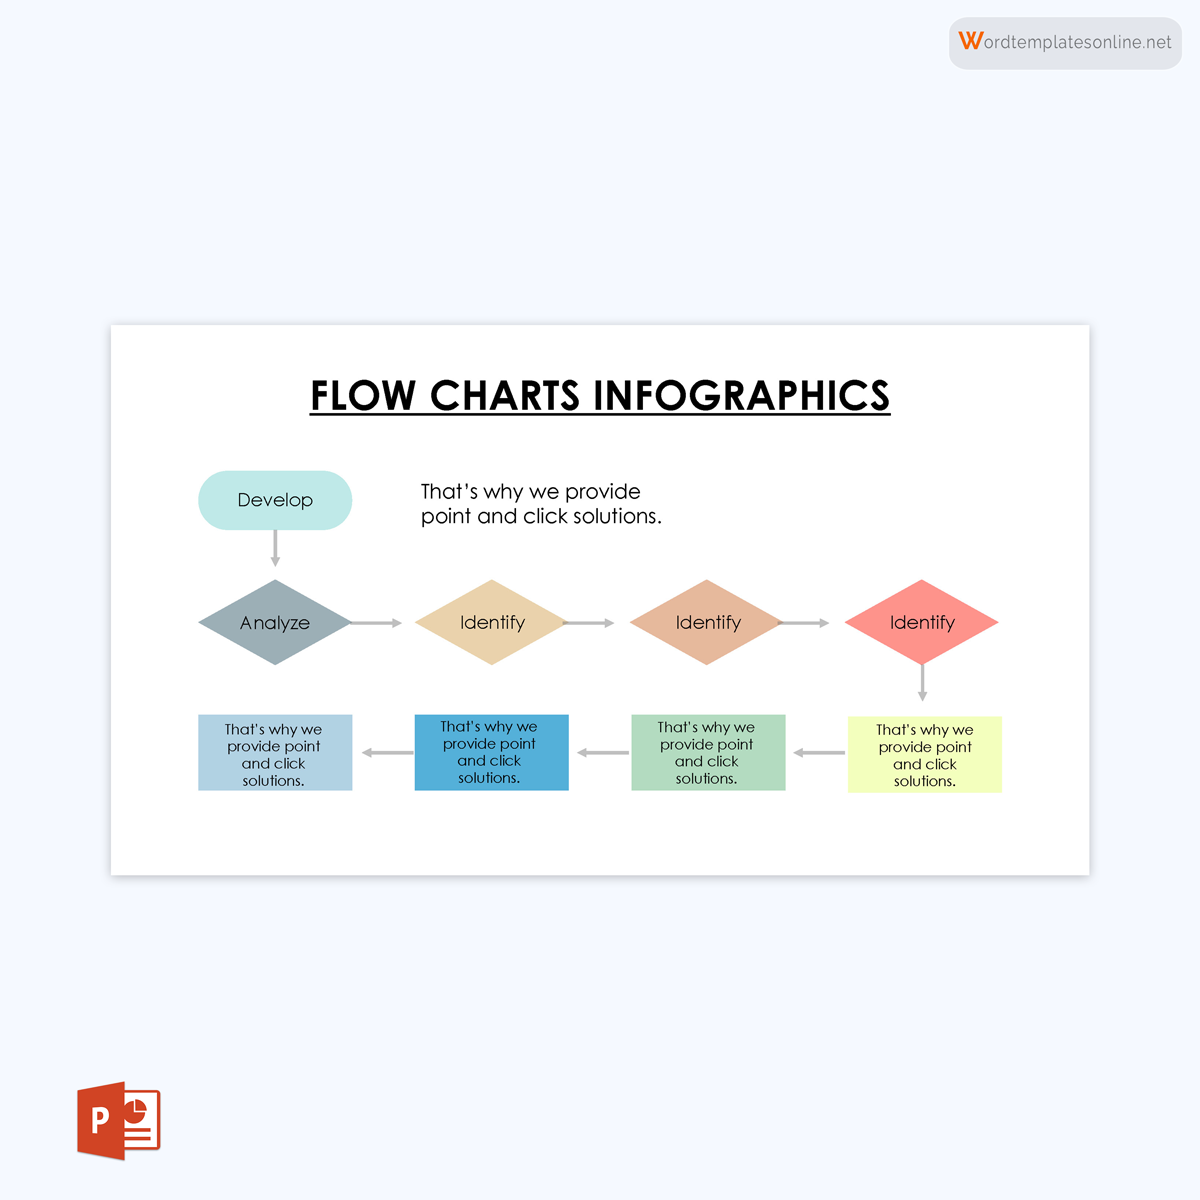
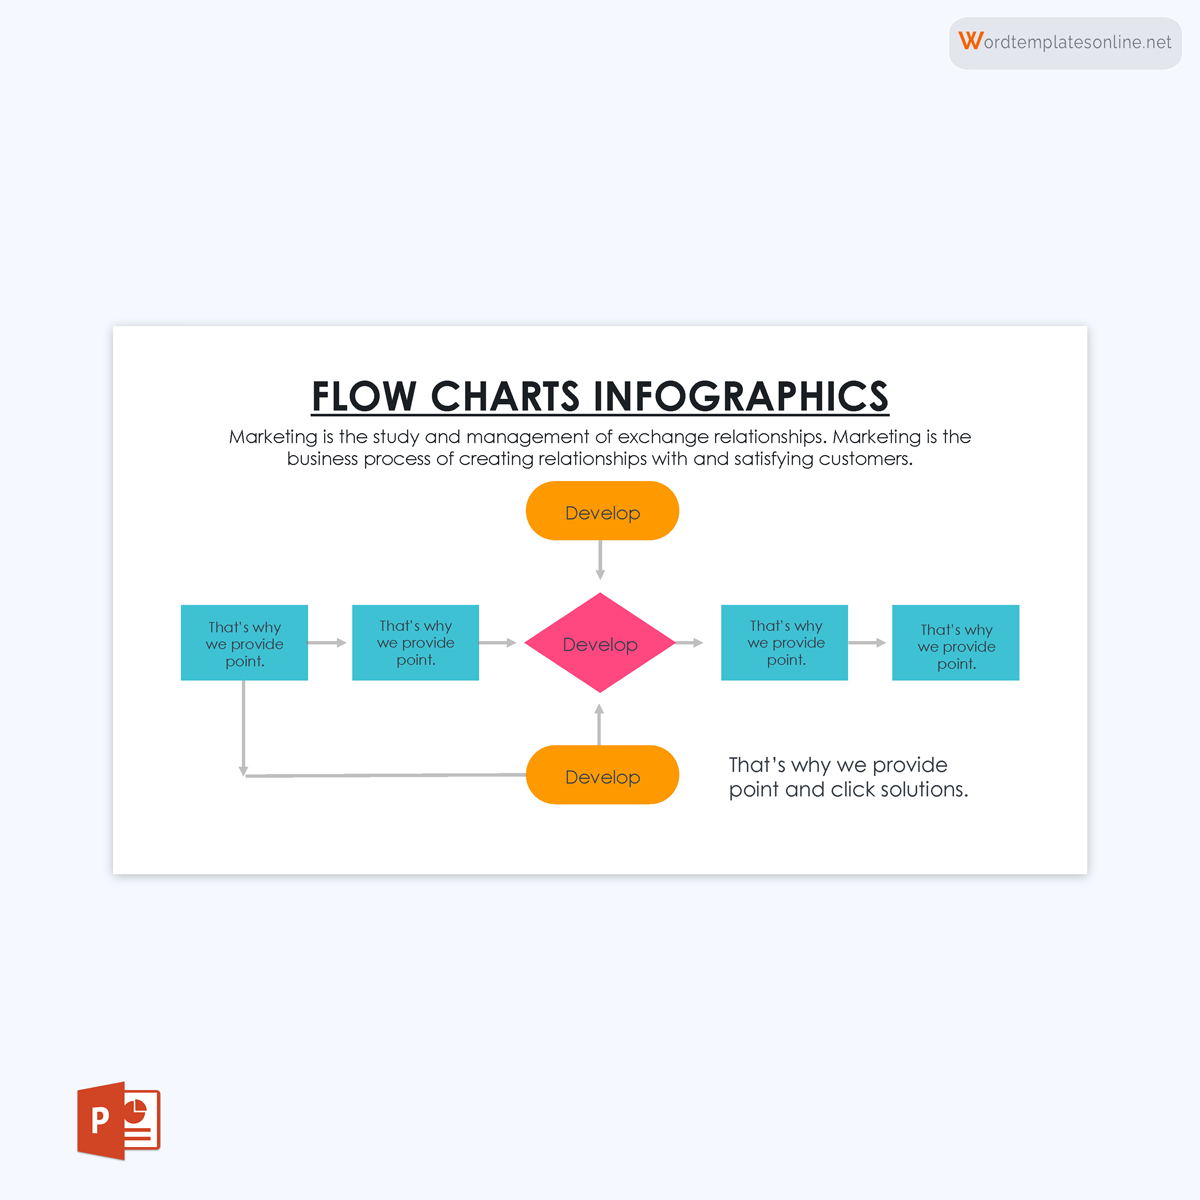
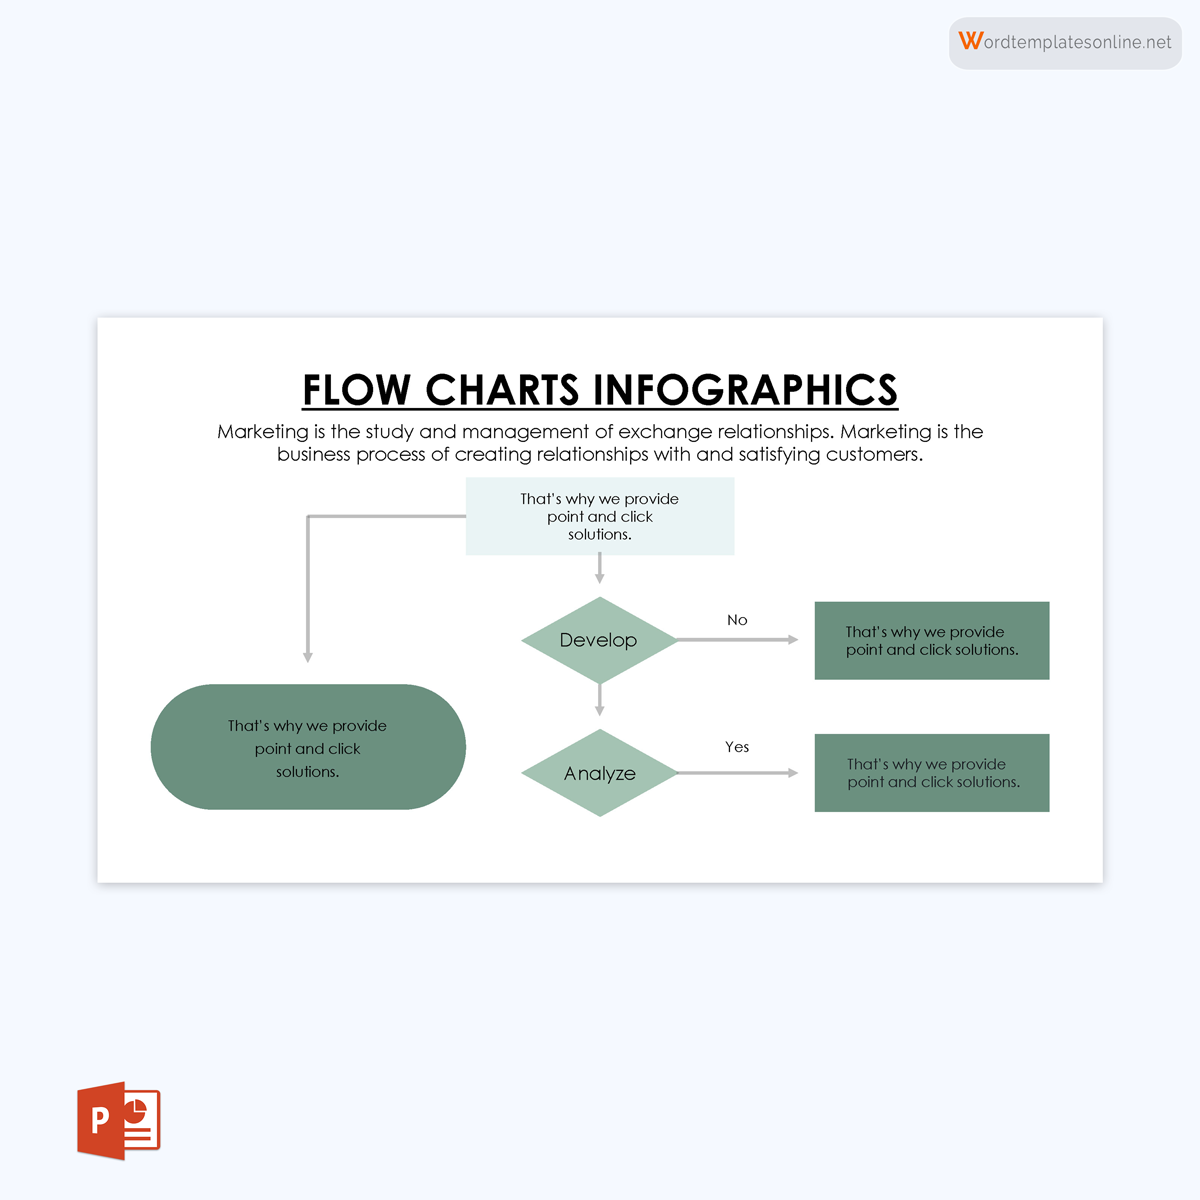
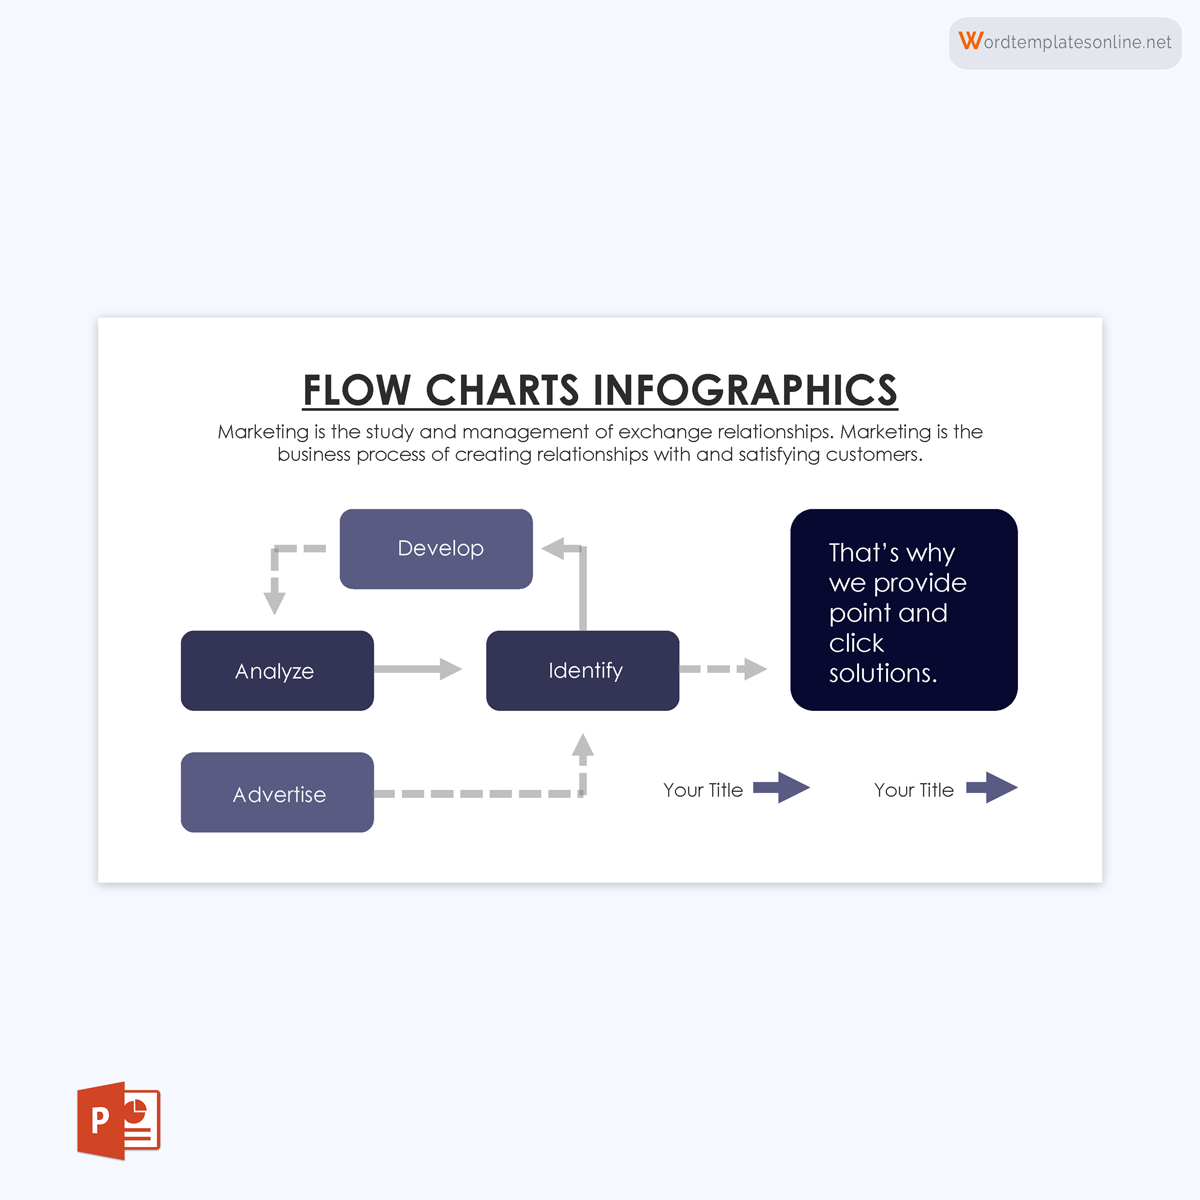
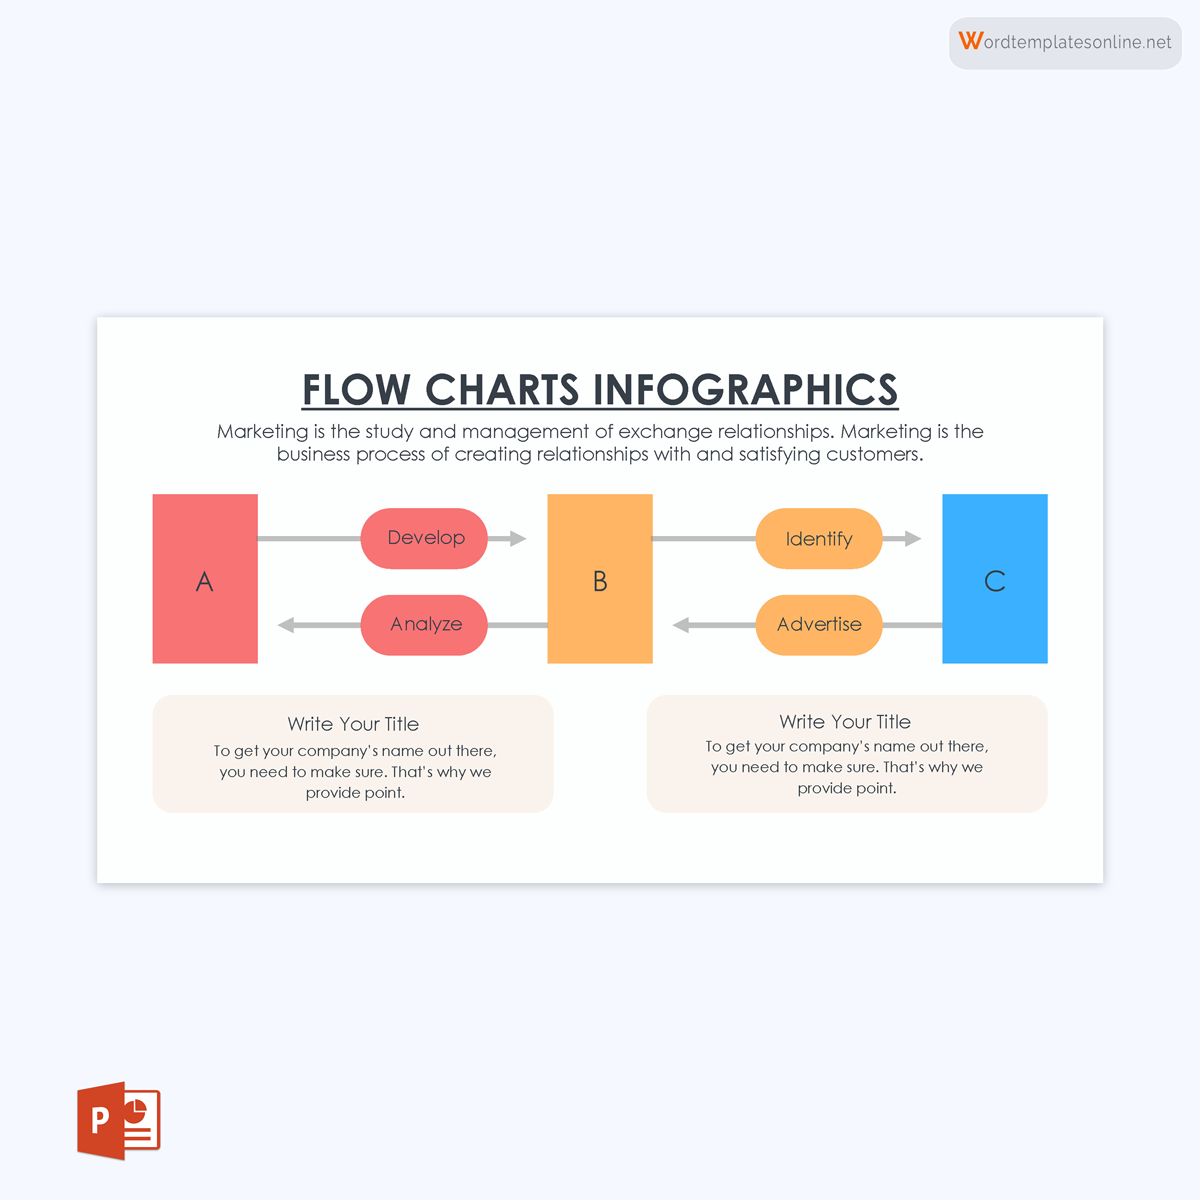
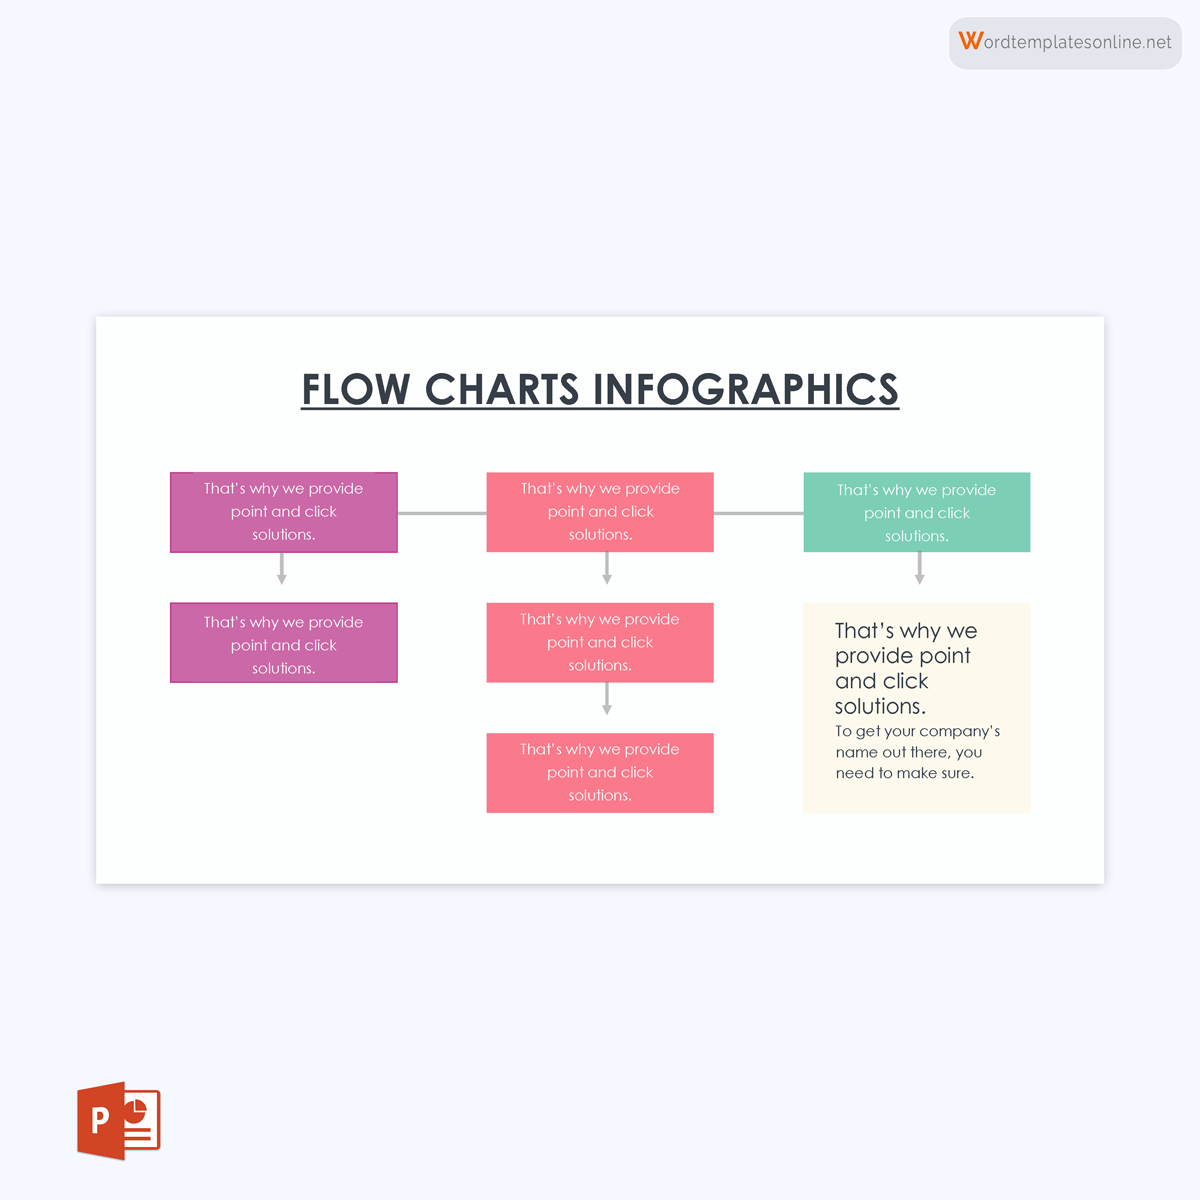
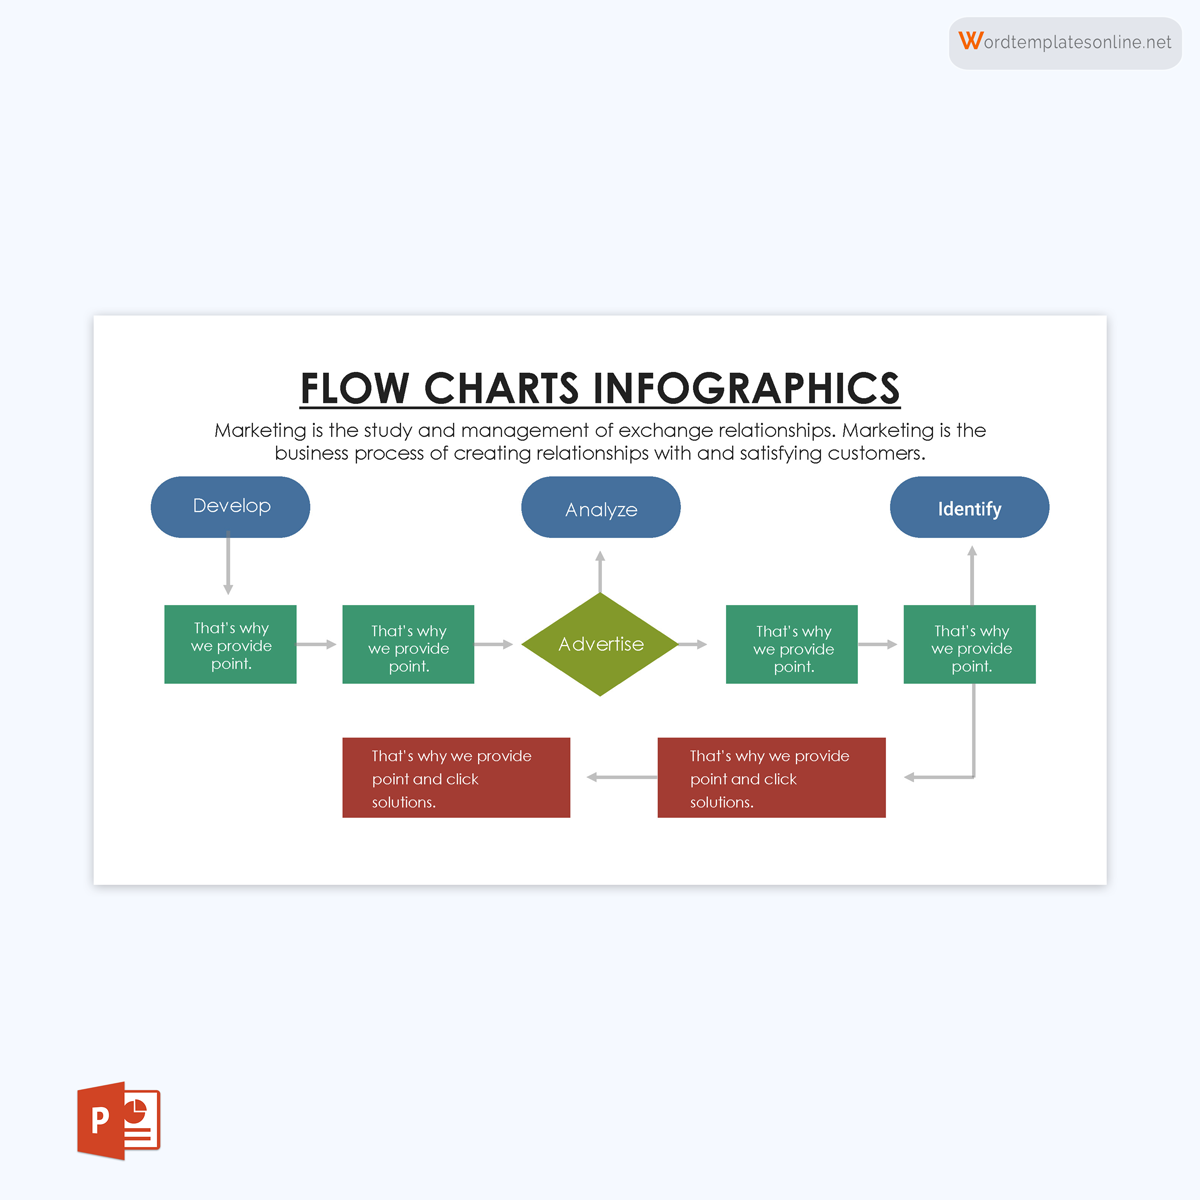
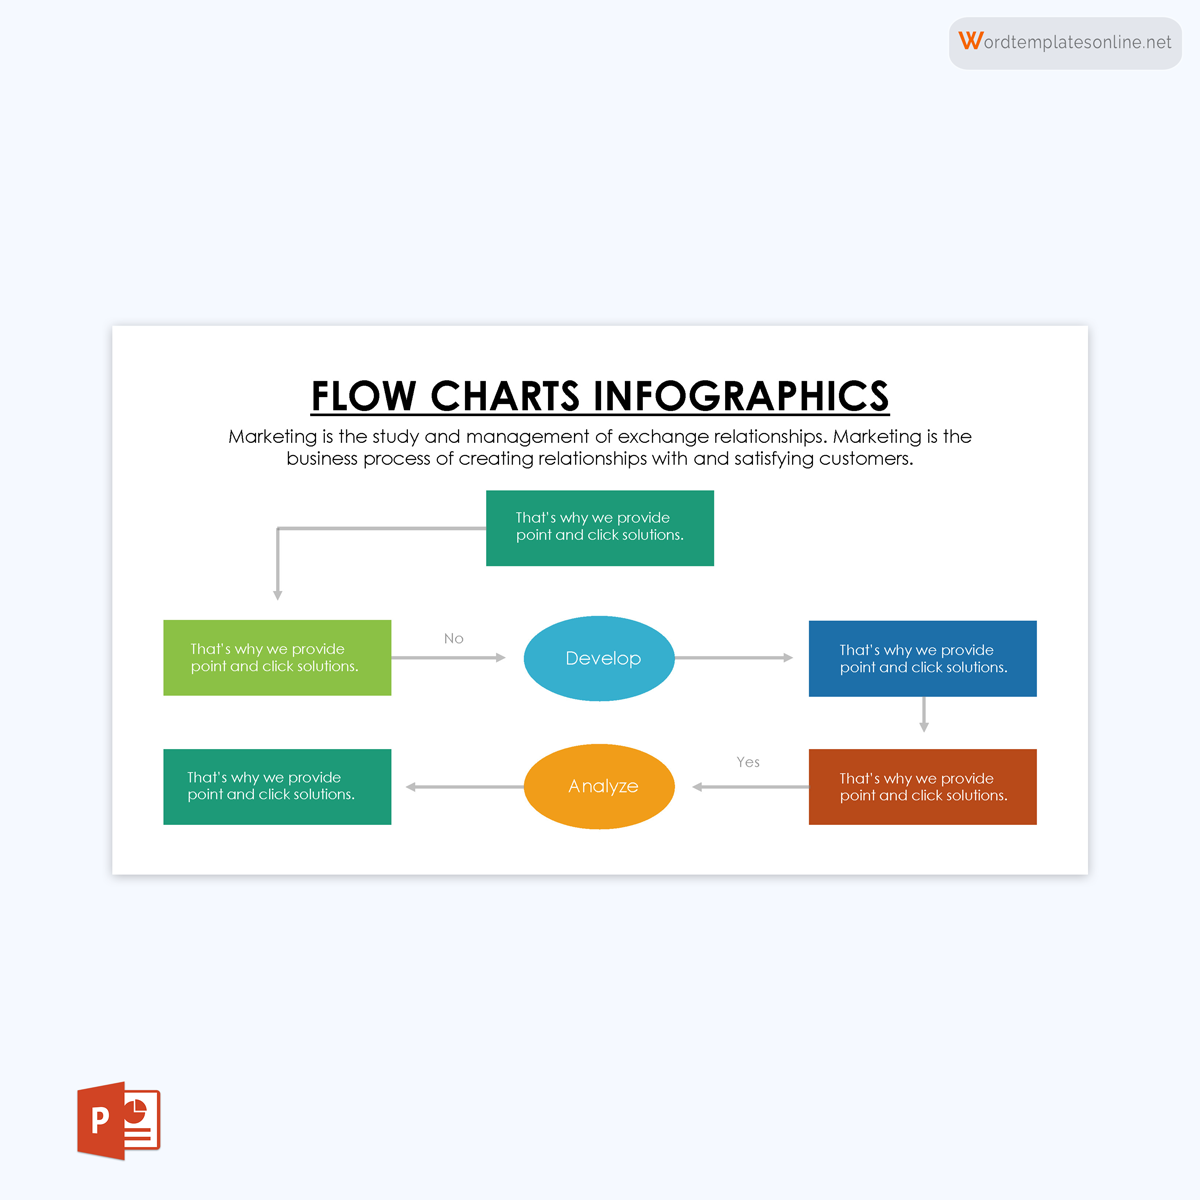
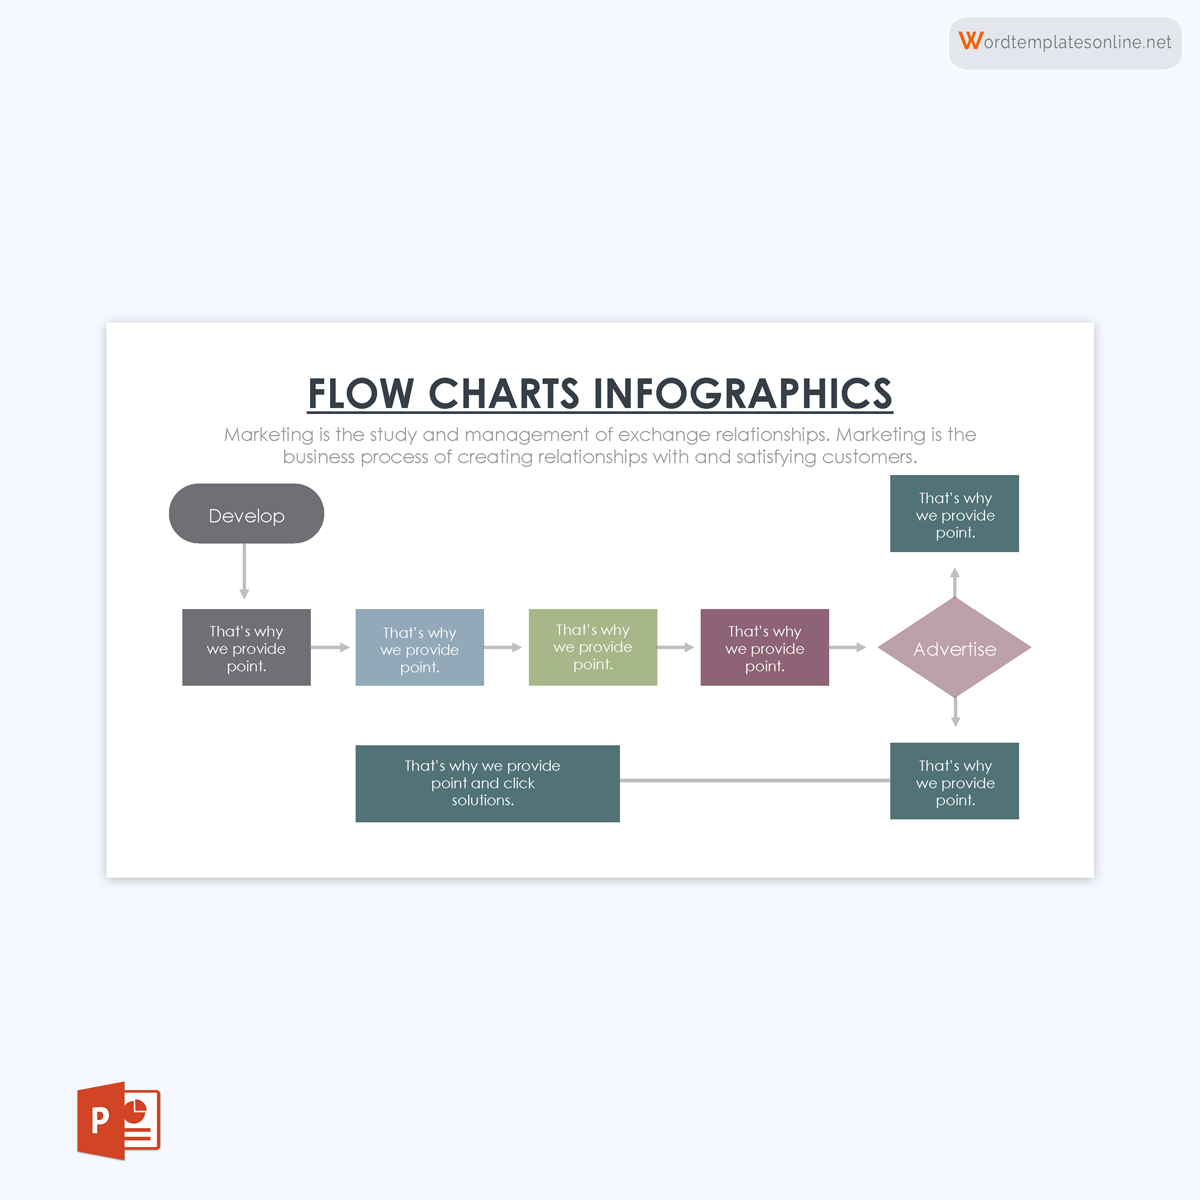
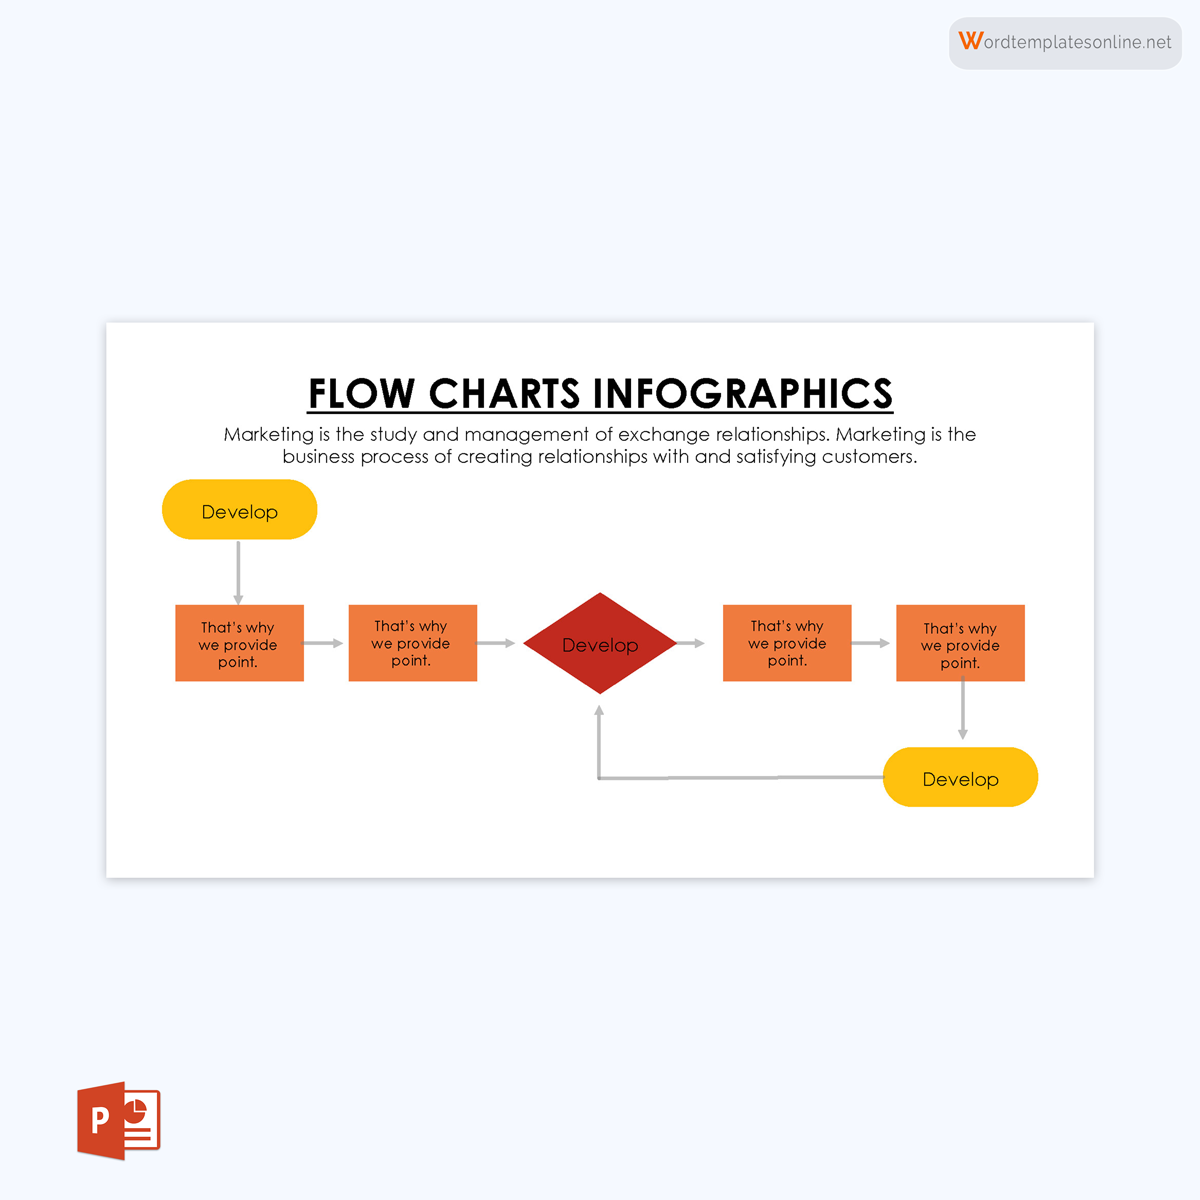
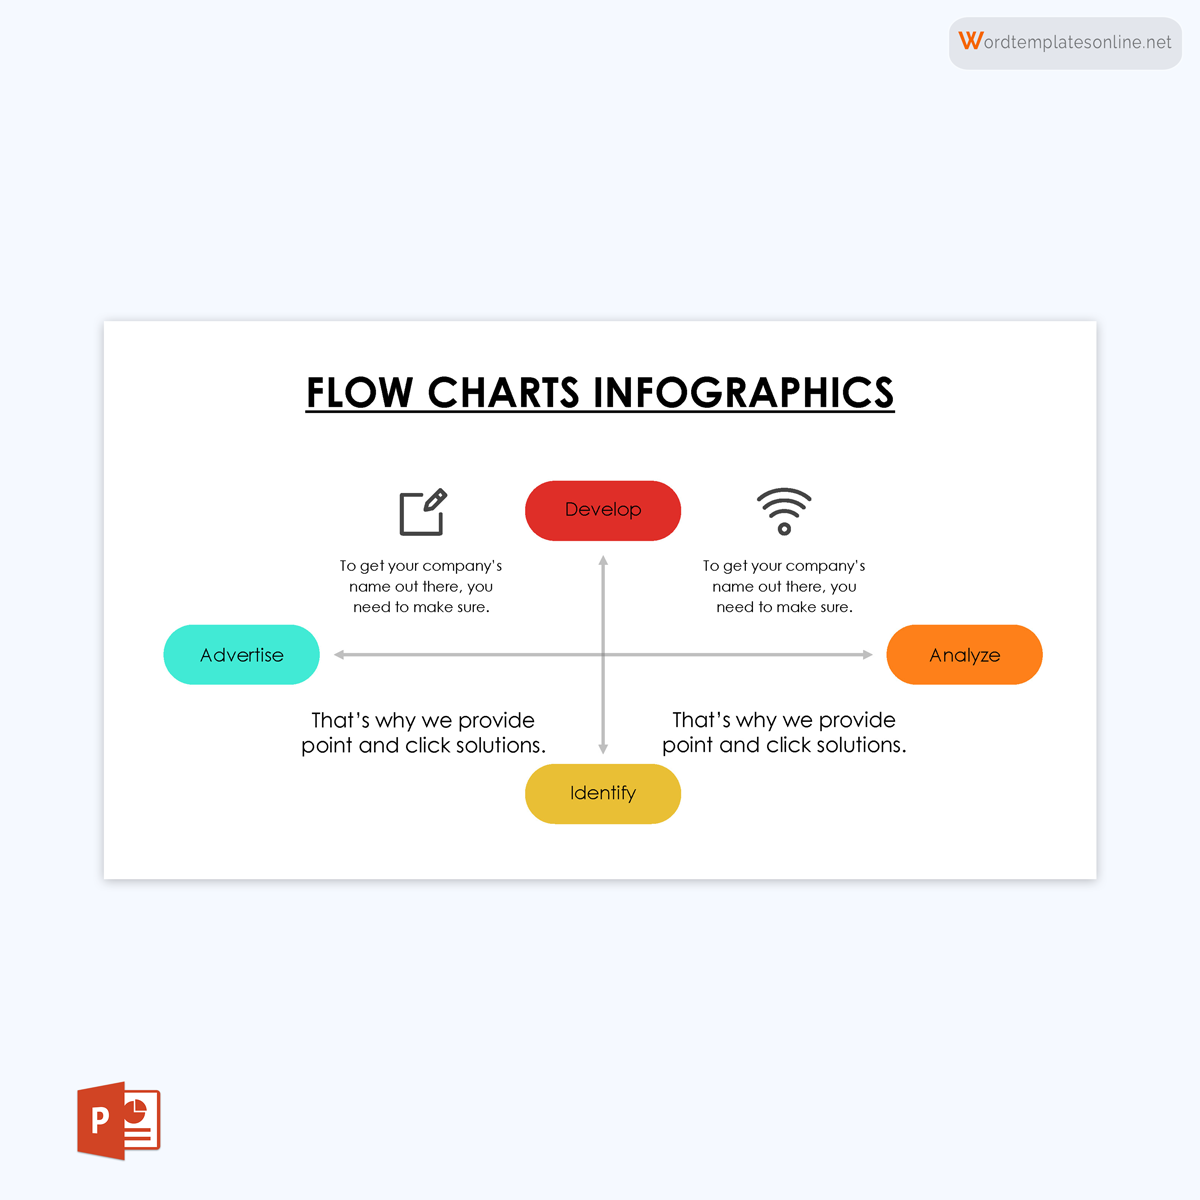
From hand-drawn to computer-drawn, flowcharts comprise of shapes (like rectangles, ovals, and diamonds) and connecting arrows which help to highlight the flow of the information. Flowcharts are used in both technical and non-technical areas to represent the sequence of information.
With this template, you can mention each step of the sequences you are preparing by writing it in the diagram shape. The directional arrows and connecting lines help a person to know how to understand the information logically. This means that a completed flowchart template effectively and efficiently graphically represents information.
This visual representation of information is important in different fields.
Some of the benefits of using a flowchart template include:
- Provides a simple way of understanding complex processes
- Helps to identify steps that do not lead to the intended outcome
- Aids team members in having a common understanding of processes which will help them work more efficiently and solve problems
- Helps in understanding new processes better
- A flowchart ensures easy-study and understanding of a new process
- Can also be used when planning a new project.
Free Templates
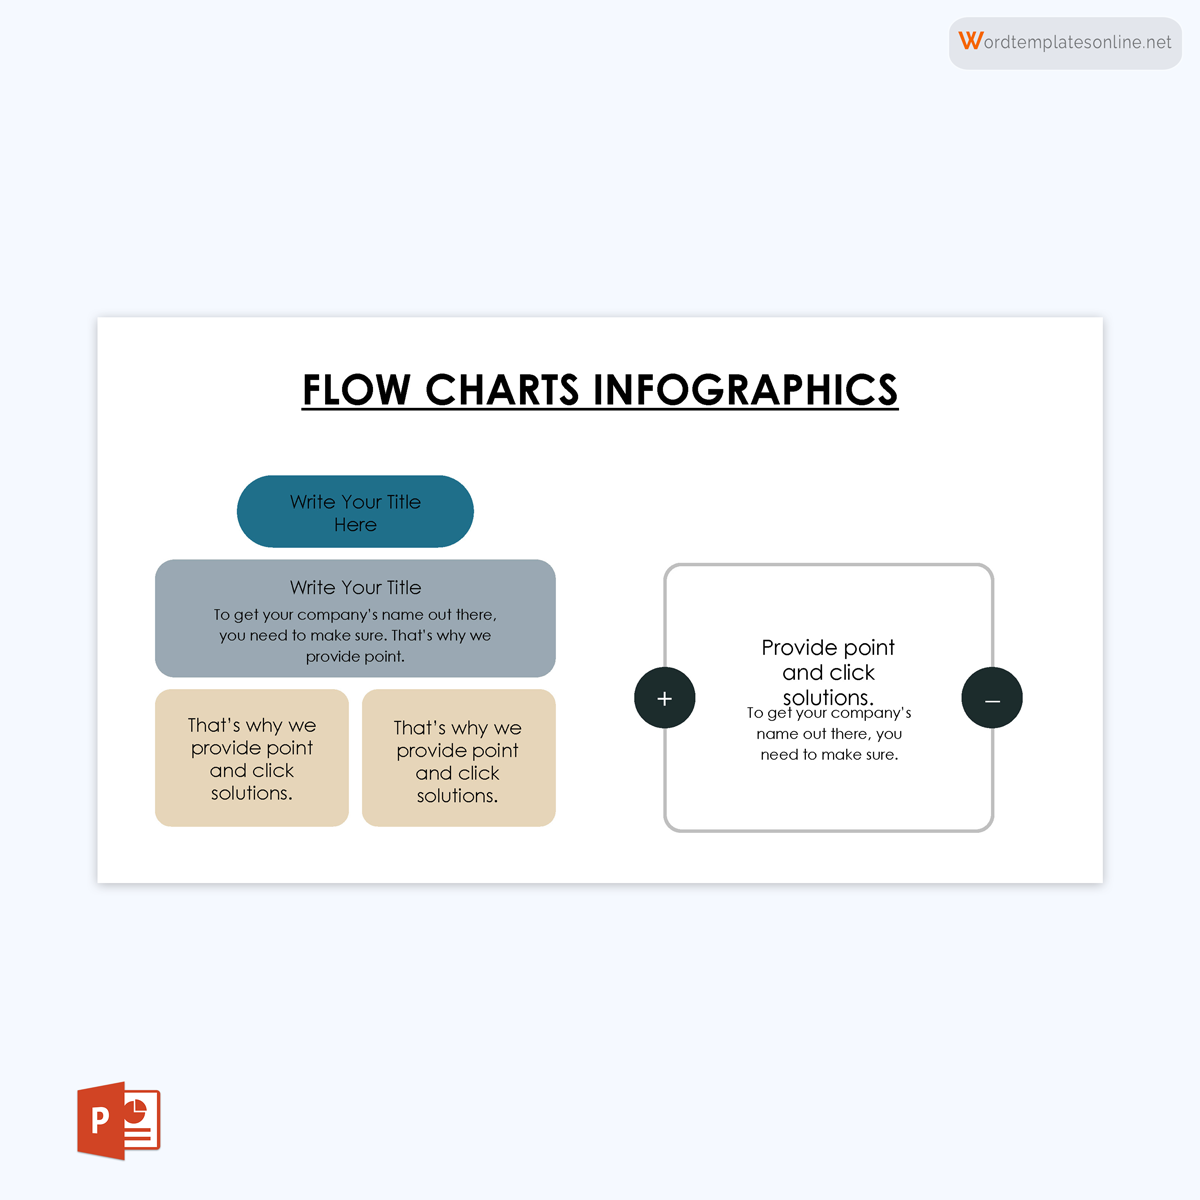
Free and customizable flow chart templates are a powerful tool that can streamline the process of creating visual representations of complex processes or decision-making pathways. These templates provide a starting point for users to easily customize and adapt the flow chart to their specific needs, saving time and effort.
With customizable templates, users can easily modify the shapes, colors, labels, and other elements of the diagram to align with their unique requirements and visual preferences. This flexibility allows for greater creativity and customization, enabling users to create flow charts that are tailored to their specific use cases.
Following are some free downloadable templates for you:
Uses of a Flowchart
Flowcharts might be seen as complex tools. However, they are easy to use and are used in many different fields to explain a lot of things.
A flowchart has many uses in different fields, with the main uses being the following:
Computer programming
In computer programming, flowcharts help to program or prepare a system design, map out algorithms, visualize code execution in a program, and show a website or application structure.
Education
In the field of education, flowcharts are best used for creating lesson plans, preparing an oral presentation, organizing projects for students, understanding scientific processes, illustrating an anatomical process; like breathing, mapping out symptoms or treatments for diseases, and demonstrating character development in literature works.
Sales and marketing
Apart from planning research strategies to attract more customers, the sales and marketing field also uses flowcharts to visualize sales progress, show the flow or registration, map out communication policies and plot out survey flows.
Business
The field of business also uses flowcharts. In this field, flowcharts are meant for documenting business processes, auditing processes to identify any inefficiency, documenting the workflow of the business, representing employees’ tasks, developing a business plan, and understanding the procurement process.
Manufacturing
In manufacturing, you can use flowcharts to understand the chemical ingredients of a product, demonstrate the manufacturing process, and identify and solve any inefficiency in the field.
Engineering
The engineering field uses flowcharts to evaluate the life cycle of a structure, demonstrate different phases of a new product, represent the flow of different processes or systems, and update the chemical and plant processes.
Making a Flowchart
Since flowcharts are important and useful in different fields. With these steps, you can make or draw a basic flowchart for any field you want so as to achieve your plan or goal.
Here is a step-by-step guide on planning and making a flowchart:
Define your purpose and scope
You need to establish the goal you want to accomplish before you can start drawing a flowchart. First, you must identify the scope of your flowchart. Try and research to get more details about what you want to illustrate. This way, you can present a diagram that is detailed but easily understandable by your audience.
Identify the tasks in chronological order
The next step is to know all the tasks that are going to appear in the flowchart in sequential order. This can be achieved by observing the process, researching the steps in different documents, and even talking to participants. The best way to gather this information is by writing the tasks down in order or in a flowchart draft.
Organize by type and the corresponding shape
Since a flowchart has different shapes to represent different information, you can start mapping out which task will be represented by which shape. This may include different shapes for processes, decisions, data input, and data outputs. This will make it easier for your audience to understand the flow.
Draw the chart
At this stage, you are ready to draw your flowchart. You can either prepare a hand-drawn or computer-drawn flowchart. It all depends on the programs you have and what you are trying to achieve.
Confirm the flowchart
You should then go through your flowchart step-by-step to ensure that you have written and arranged everything correctly. Finally, you can ask for help from those who assisted you throughout the process. This is to ensure you have not missed any point that is important to your purpose of preparing the flowchart.
Free Downloads
Download our free and editable templates today and customize them according to your needs. With our templates, you will be able to create a proper graphical representation of the information or process you would like to share with your audience. This will help you to not only understand the process but also identify areas that need changes.
How to Make a Flowchart Template in MS-Word
You can choose to make a flowchart template in Word.
Here is a step-by-step guide on how to make a flowchart template in Microsoft Word:
Step 1: Open MS word
Open a blank document in Word and save the document on your desktop for easier retrieval.
Step 2: Start adding shapes
Go to the “Insert” tab and click on either “SmartArt” or “Shapes.” For SmartArt, those are a collection of pre-made shapes in a gallery. For shapes, you have an option of selecting what you want and inserting it into the document.
If you click “SmartArt,” a gallery pop-up will appear, and you should click on “Process” to get options that relate to creating flowcharts. You can, however, use any other SmartArt graphics you want. Click on your selection on the left to get to see the preview and explanation on the right. Then, click “OK” to insert the graphic.
You can delete the graphics from “Smart Art” by selecting and pressing “Delete.” Then, on the “Design tab” that appears when you highlight the graphic, you can change the layout, select a shape and select a new style without affecting the text.
If you click “Shapes,” the drop-down menu will have the term “flowchart” with specific shapes for you to choose from. Click on the shape and then click on your document to draw it. You can drag and size the shape by clicking on it. Use the same process to add more shapes and lines to your template. To delete the shape, click on it and press “Delete.”
Step 3: Add lines
Click “Insert” then “Shape” to select and add lines in your flowchart. There are different line styles you can use. Next, click and drag the line you have chosen to make it appear on the page.
Step 4: Formatting shapes and lines
To edit and format text layout, click the “Layout Options,” which will appear once you right-click a text box. Choose your preferred layout style. You can move any shape of a line by clicking on it and dragging it to where you want it. You can resize the shape or line by clicking and dragging it from one corner. You can also rotate the shape by using the handle icon.
For “SmartArt,” select the shape and format the shapes and lines by clicking on “Format and Design” for a menu with basic formatting options. For “Shapes,” select the shape or line, and a “Format” tab will appear for you to use as a flowchart template and make changes to.
Tips on Creating a Flowchart
There are some tips that you should consider when preparing a flowchart.
Here are some tips to keep in mind when making a flowchart, no matter the field:
- Ensure that you prepare a detailed flowchart that considers your audience. You should always have your audience in mind and prepare a flowchart to communicate with them clearly.
- Try using the Swimlane Diagram to clearly represent the duties and responsibilities if you are charting a flowchart that includes different teams or departments.
- Apply the on-page and off-page connectors to ensure your flowchart still flows well and logically in case it separates into other pages. These connectors also make it easy to edit.
- There is no particular “right” way. However, you should focus on creating a flowchart that helps your audience understand the process.
- Ask help from people who are involved in the flowchart process. This may include customers, suppliers, and managers. Involving them and getting their feedback will help you develop a proper flowchart.
- Avoid using an expert when preparing a flowchart. Those involved in the process are way better candidates to draw the flowchart.
Flowchart Symbols
Here are some flowchart symbols that you are likely to encounter when preparing or reviewing a prepared template:
Terminal/terminator

This symbol represents the start and endpoint of a flowchart template.
Process

It is usually a box that represents a certain operation.
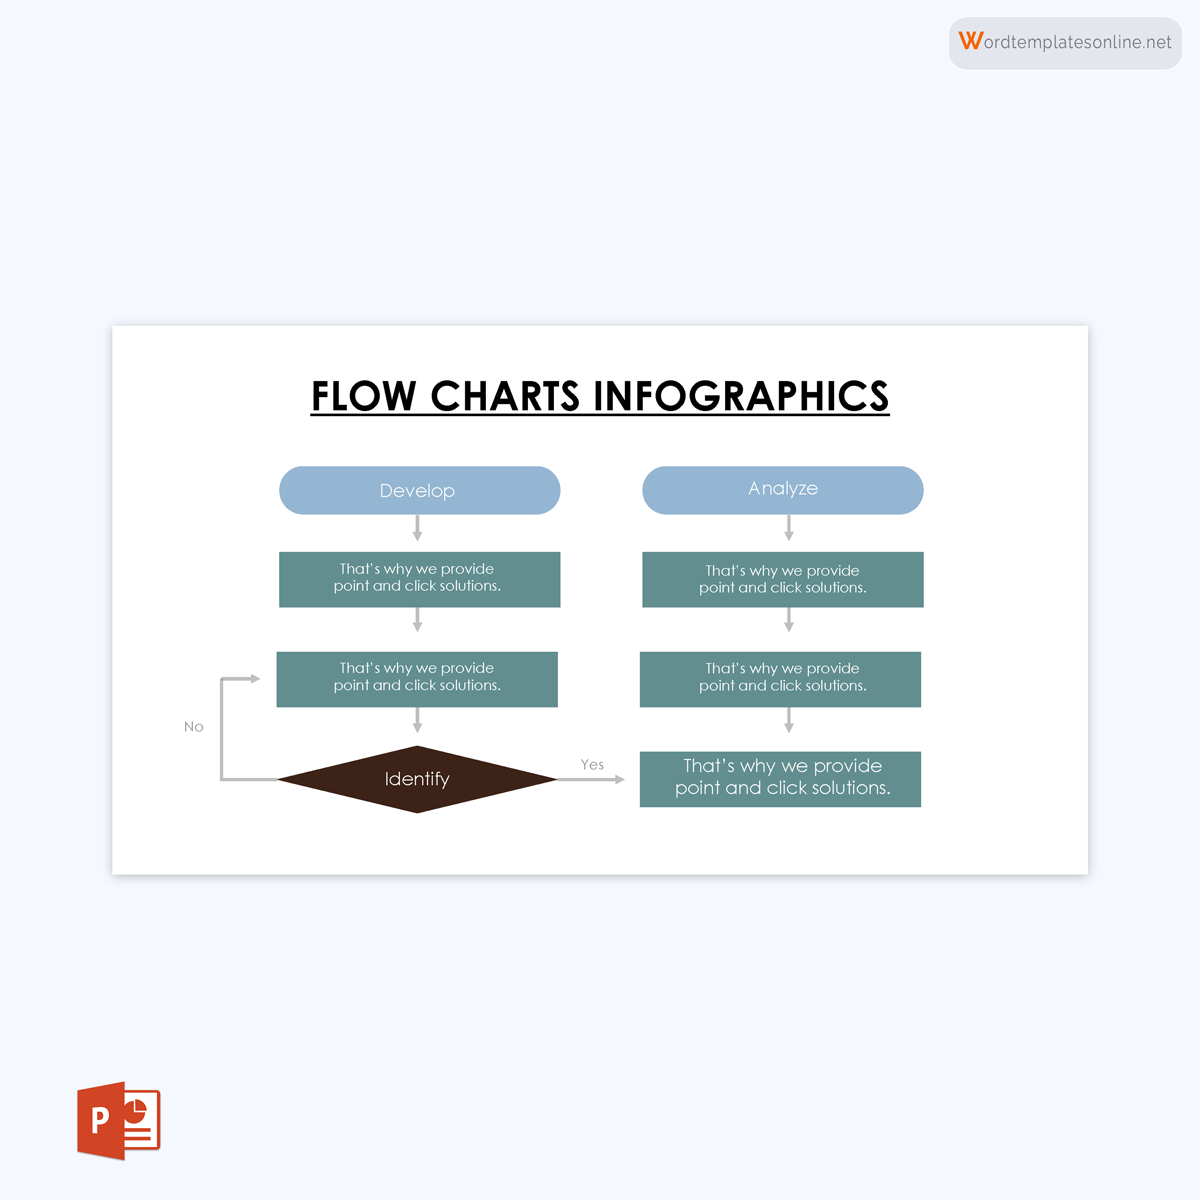
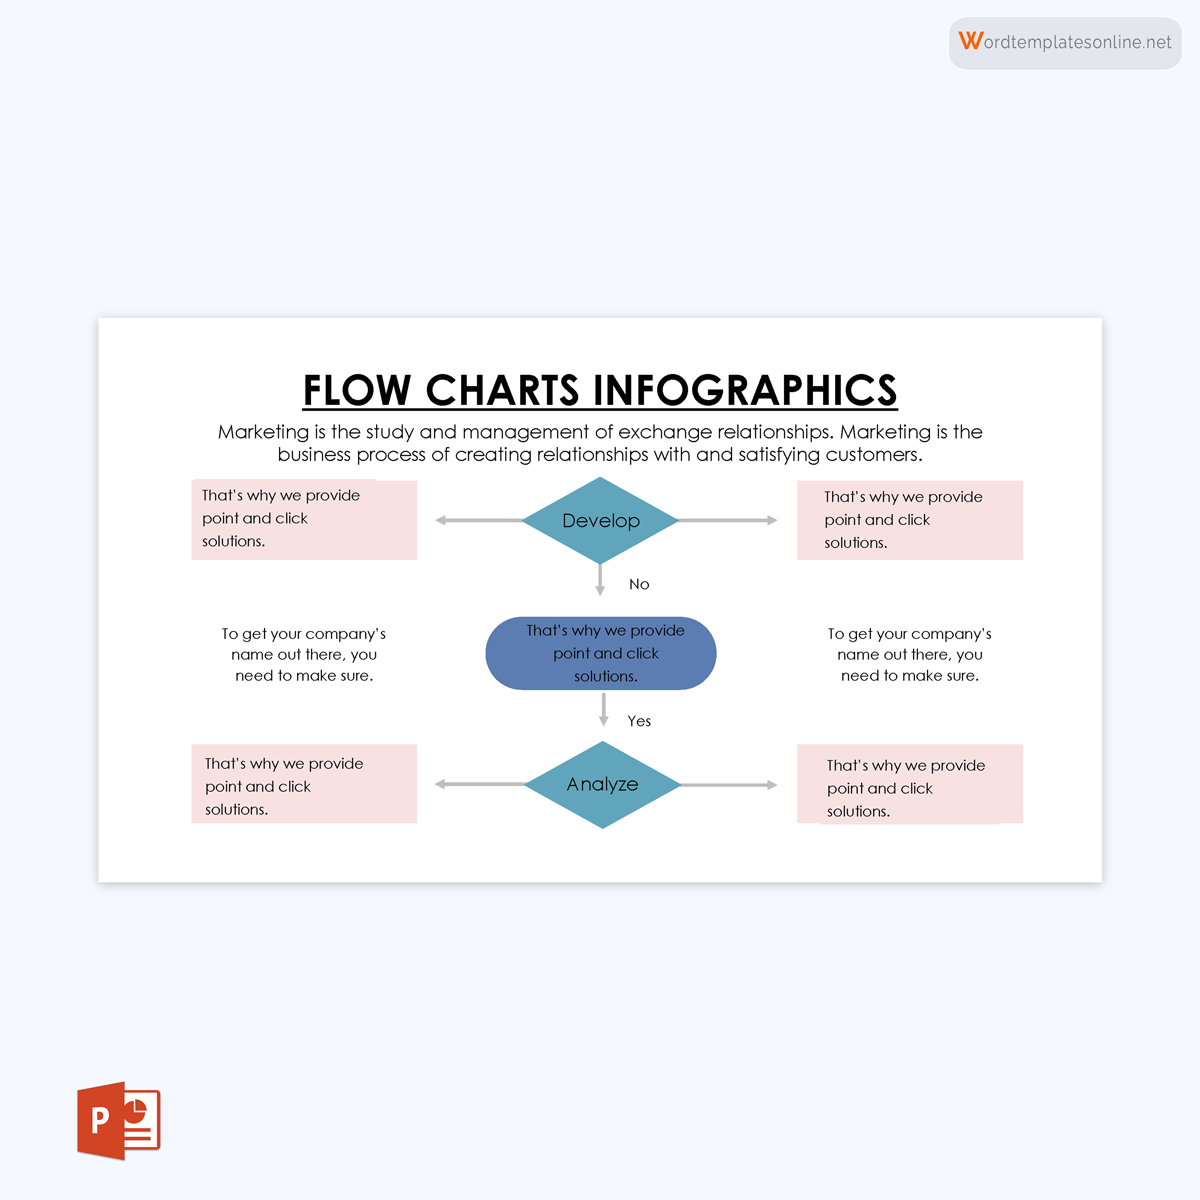
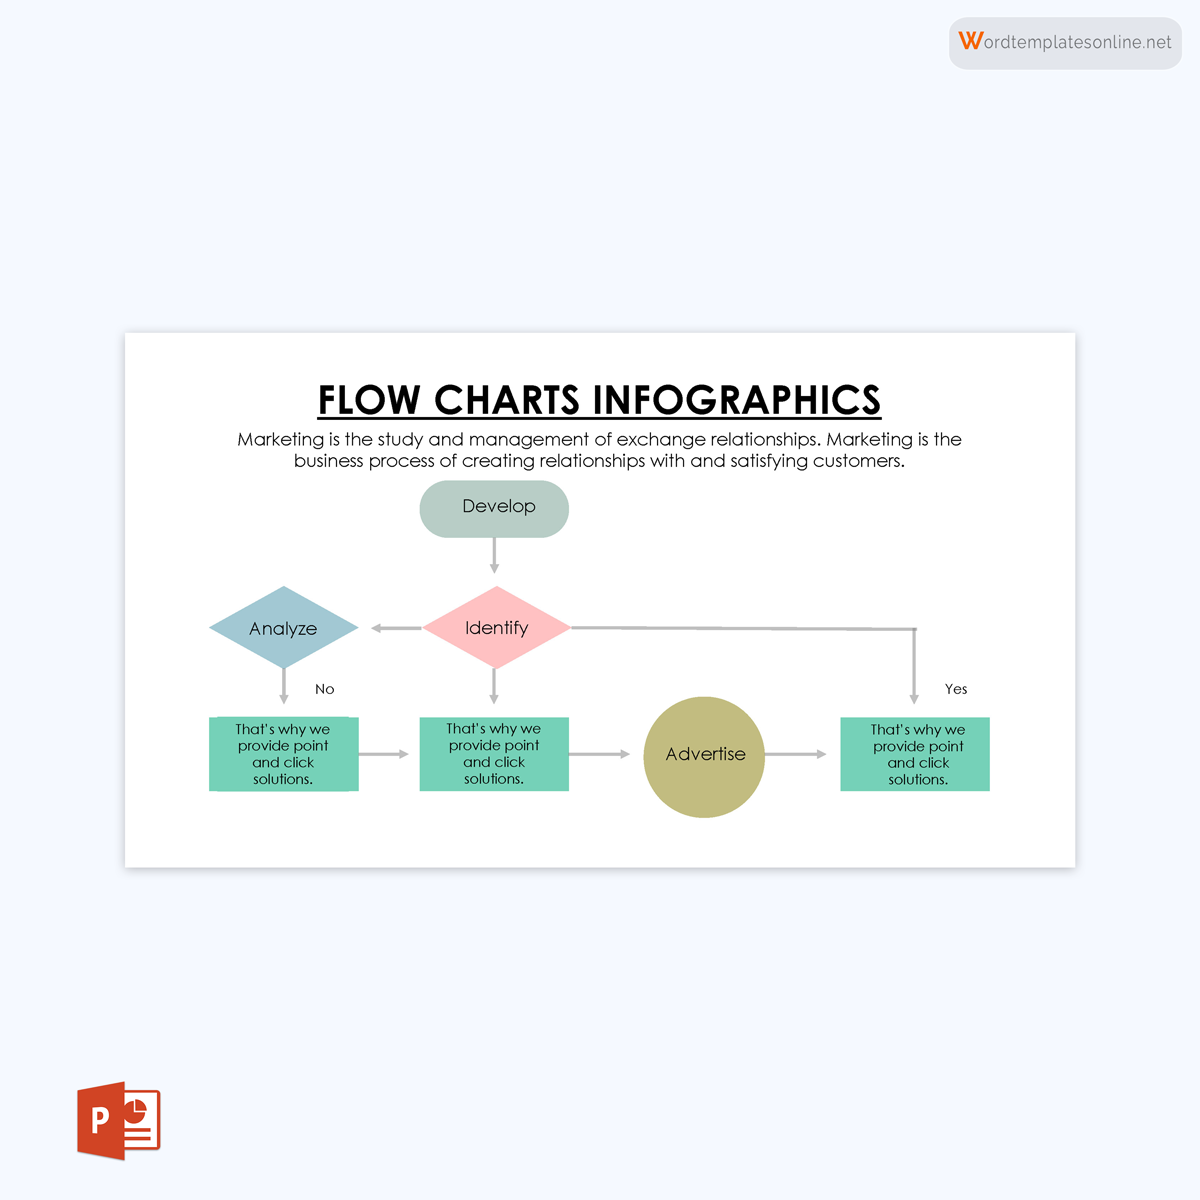
Decision

It is usually a diamond symbol that represents the decision point that leads to different outcomes. There is usually a question in the diamond
Also known as branching point, there are always two lines that come from the diamond shape to indicate the two possible solutions (Yes or No) of the decision made, which leads to sub-processes.
Document

This shape in a flowchart template represents a document which means a printout of either a document or report.
Data or input/output

This symbol represents any information that is leaving (output) or entering (input) a system.
EXAMPLE
An input can be a customer ordering a meal, and output can be a delivery being made to the customer.
Stored data
This symbol represents data that is not moving through the process in a filled flowchart template. That means that it is stored or resting.
Flow arrow

The flow arrow is usually a line that represents the flow of the tasks and the direction of the process being represented in the flowchart template.
Comment or annotation

This symbol represents any additional information regarding a particular step in a process.
Predefined process

This symbol represents a process that has already been named and defined elsewhere in the flowchart template. It is usually meant to depict sub-processes.
On-page connector/reference

This symbol usually has a letter inside. It means that the flow of the process continues where there is a similar symbol with the same letter inside, on the same page.
Off-page connector/reference

This symbol usually has a letter inside. It also means that the flow of the process continues where there is a similar symbol with the same letter inside on another page.
Delay or bottleneck

This symbol represents a delay in the process being shown in a completed flowchart template.
A flowchart template is an editable guide that helps prepare the diagram used to offer a graphical representation of processes and concepts. With a flowchart template, you have a convenient way of making your flowchart faster and easier. In addition, the templates ensure that you have all the right symbols and shapes in your flowchart.
Final Thoughts
A flowchart is a diagram used to visually represent a process or display particular information. Flowcharts are used in different fields, and they are important as they help illustrate and explain complex processes. You need to know all the symbols used in making flowcharts to prepare a proper one in MS Word.
About This Article