Every organization is structured in its unique manner. Structuring is essential to ensure that responsibilities are spelled out and there are no overlaps in the hierarchy. Any organization can have a structure, from established entities to start-ups, a small local candy store, to a multinational technology company. This structure can be illustrated through an organizational chart.
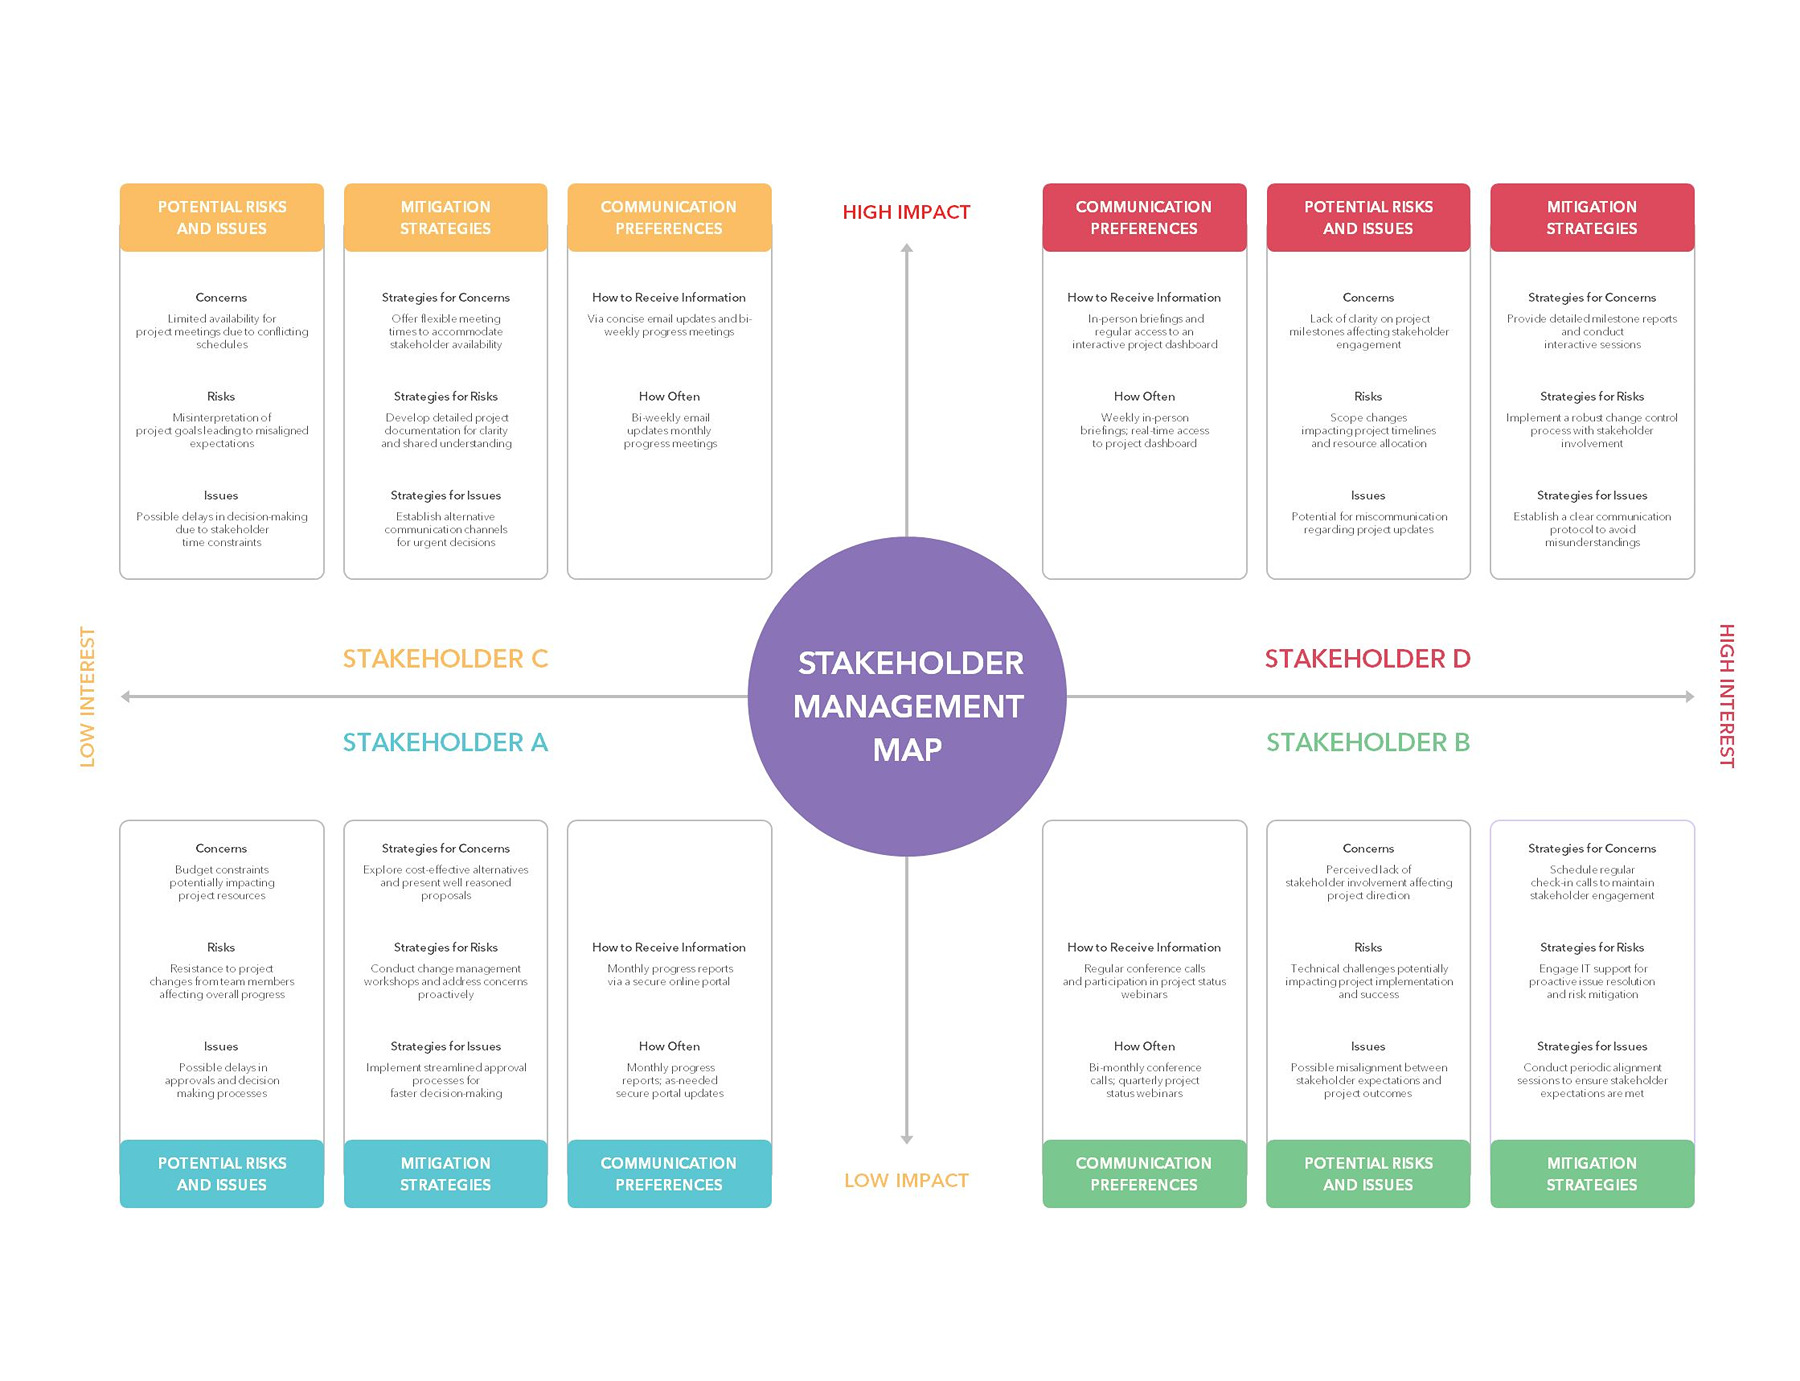
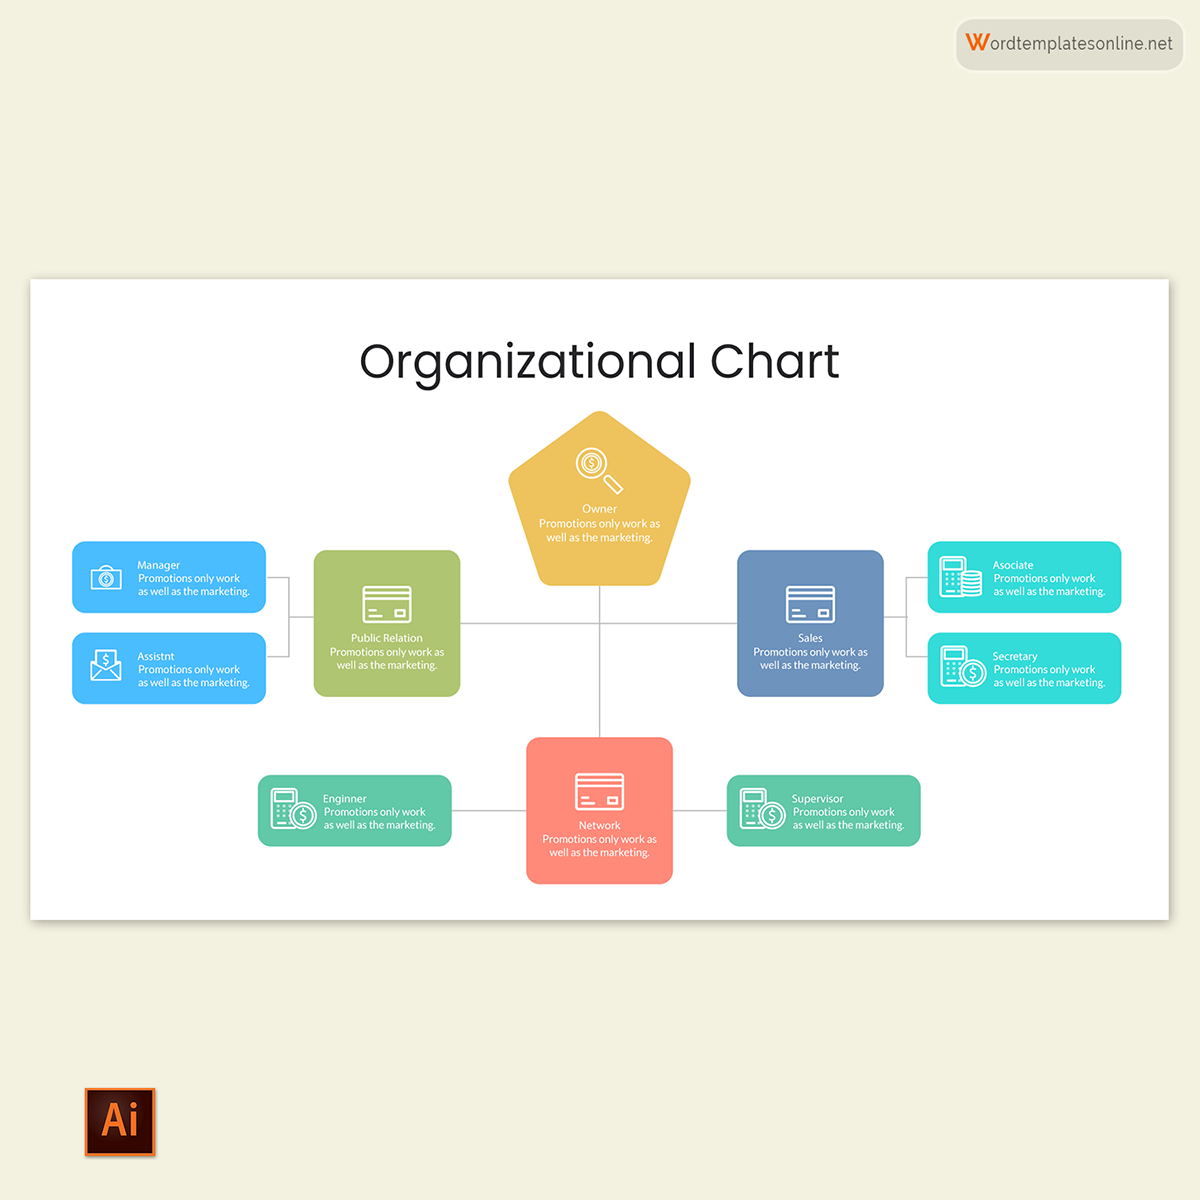
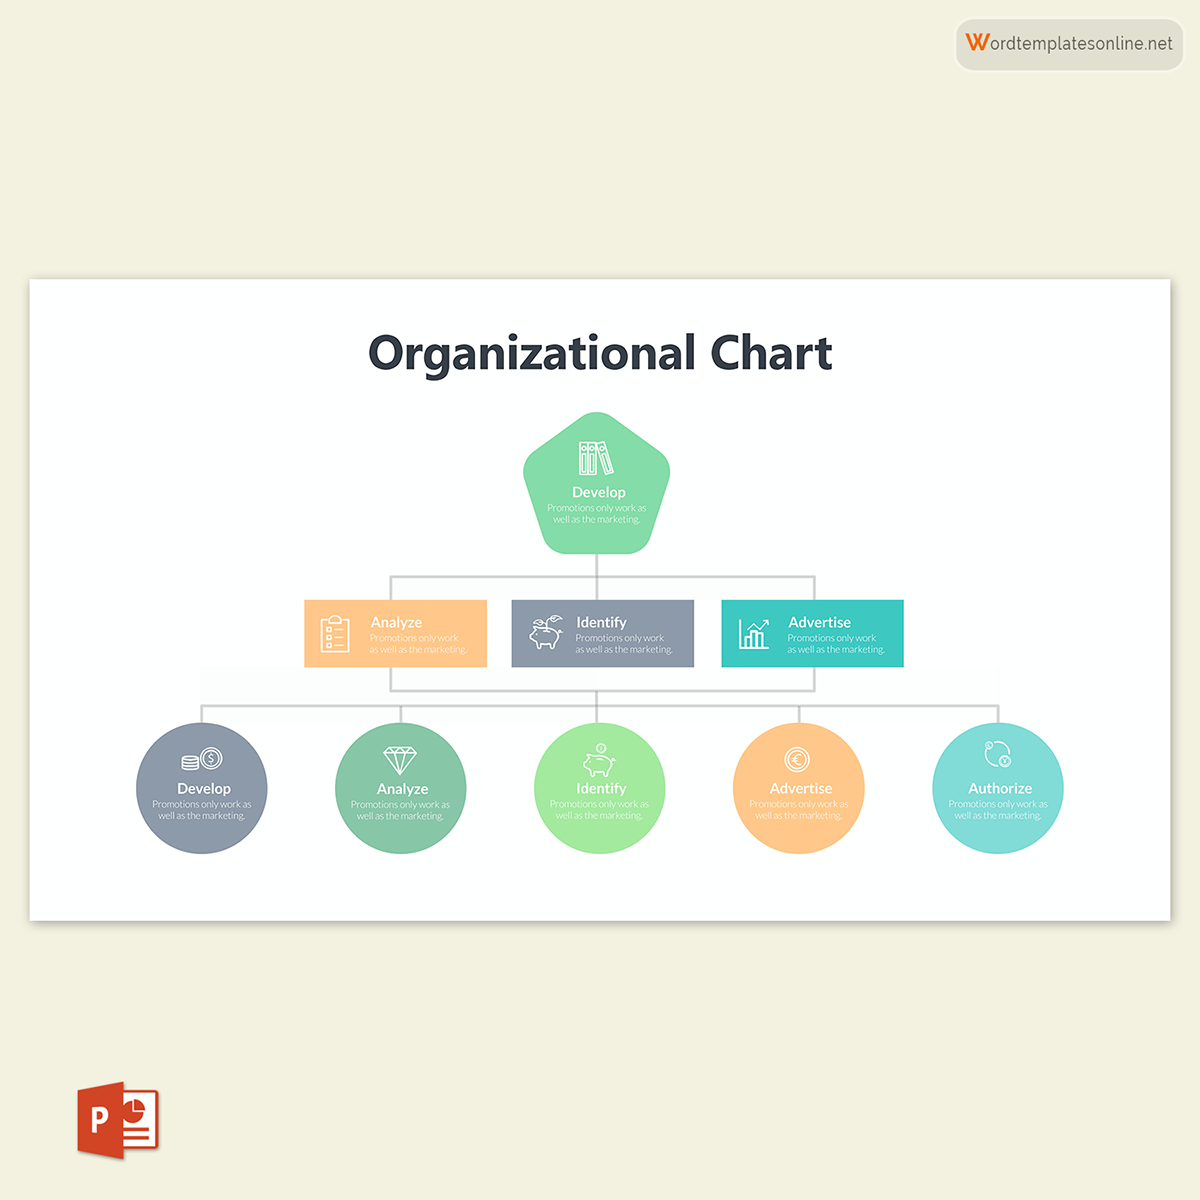
An Organizational Chart is a visual representation of an organization’s structure.
It is a diagram that shows crucial organization positions and, in some cases, the people occupying these positions. It uses symbols, shapes, and photos linked with lines to illustrate the relationship between the key positions and people associated with the organizational structure.
Organizational charts are alternatively referred to as:
- Organograms
- Org charts
- Feature box
- Shapes
- Photos
Free Organizational Chart Templates
Purpose of Organizational Chart
The overall purpose of an org chart is to communicate to third parties such as interns, investors, new hires, and shareholders who report to whom, the order of divisions, and how the organization’s departments are connected. This way, from the chart, one can put names and faces to positions and trace roles and responsibilities to positions.
Through this information, anyone can identify the internal structure and hierarchy of the organization. This way, employees know who to report to and who to consult when dealing with specific issues. In addition, by identifying the hierarchy, employees can trace the promotional channels and targets.
Organizational charts are also used as management tools. They are used to designate roles and responsibilities, to allocate staff and resources to different departments optimally. Additionally, an org chart is a one-stop-storage for employee information such as contact details; it, therefore, improves the lines of communication within an organization.
Types of Organizational Chart
There are distinct types of organizational charts. They vary depending on the organizational structure, adopted management philosophy, and purpose of the chart. In some cases, one org chart per organization will do, while sometimes it might be necessary to create several organograms to suit the audience or purpose.
Most businesses will, however, have either of the following types of org charts:
Functional top-down hierarchy
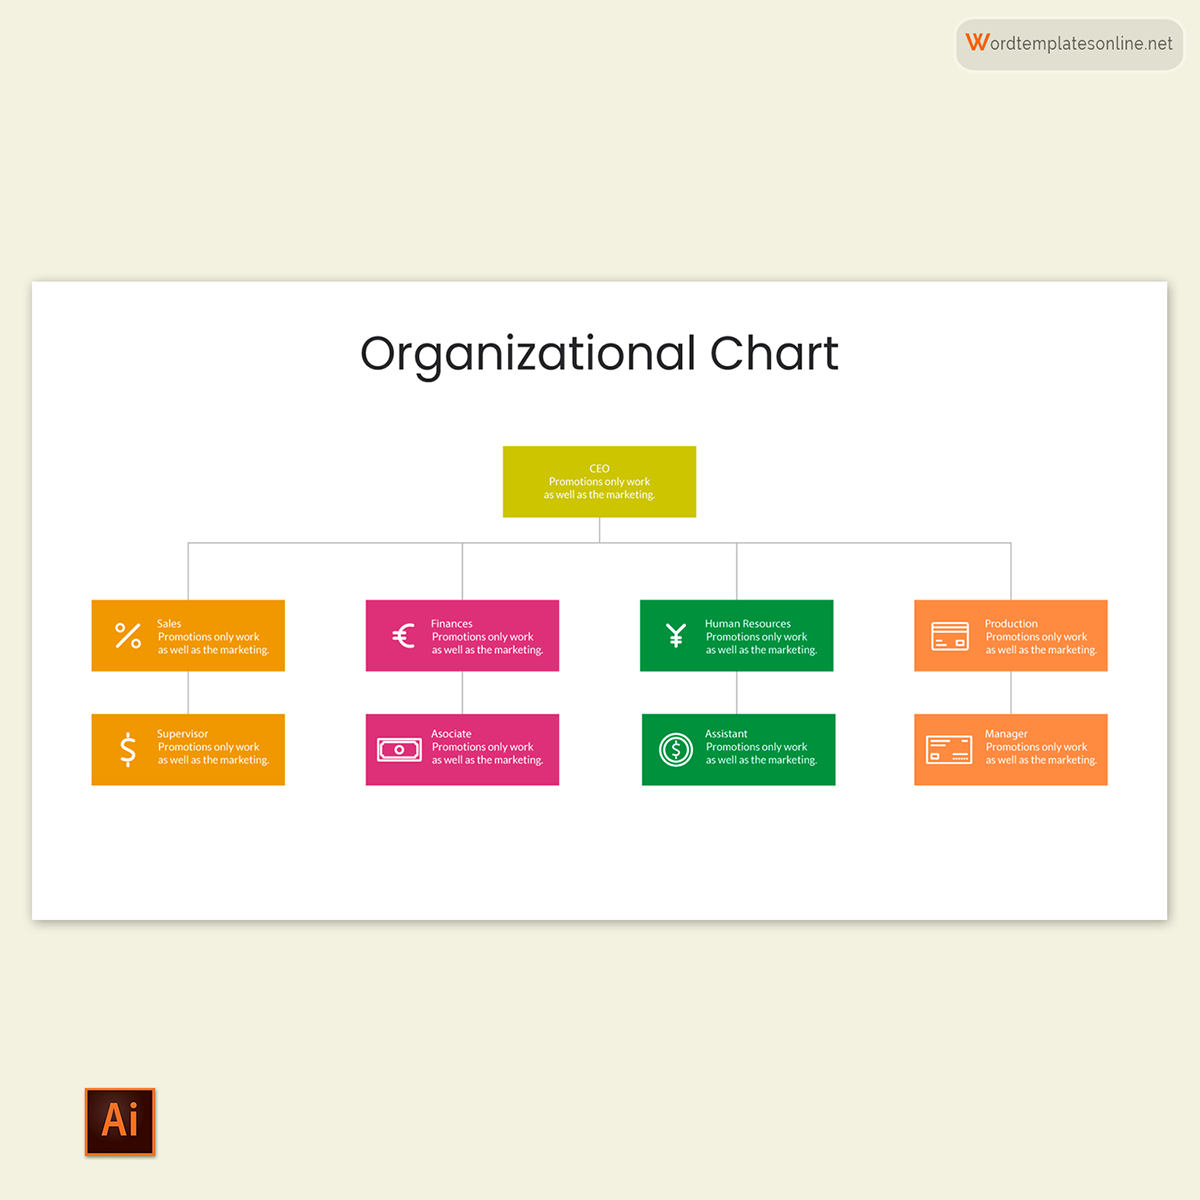
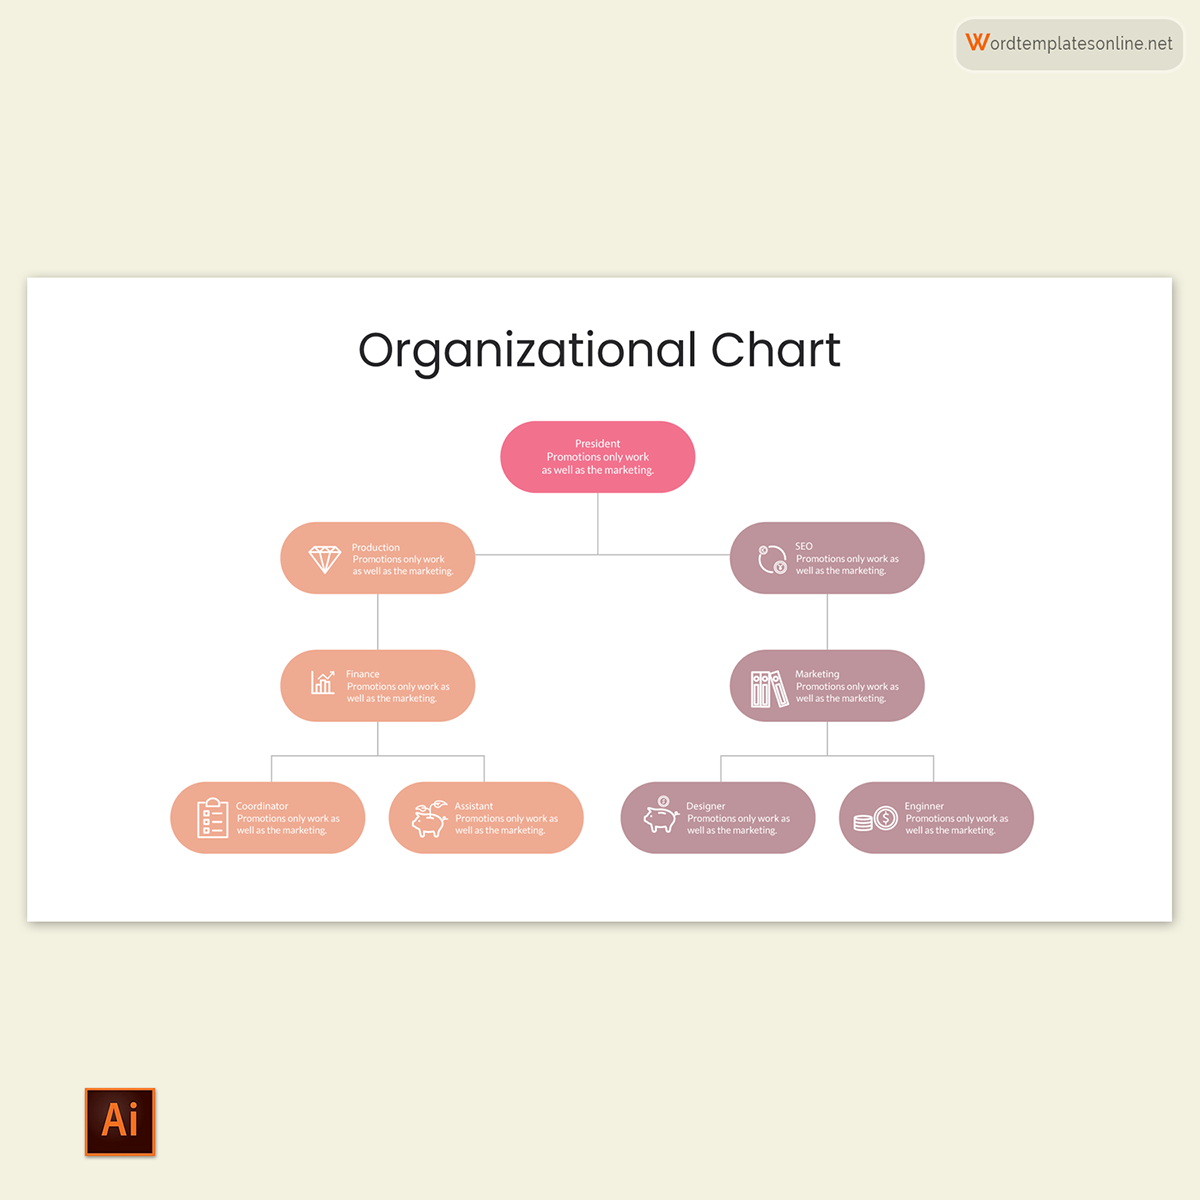
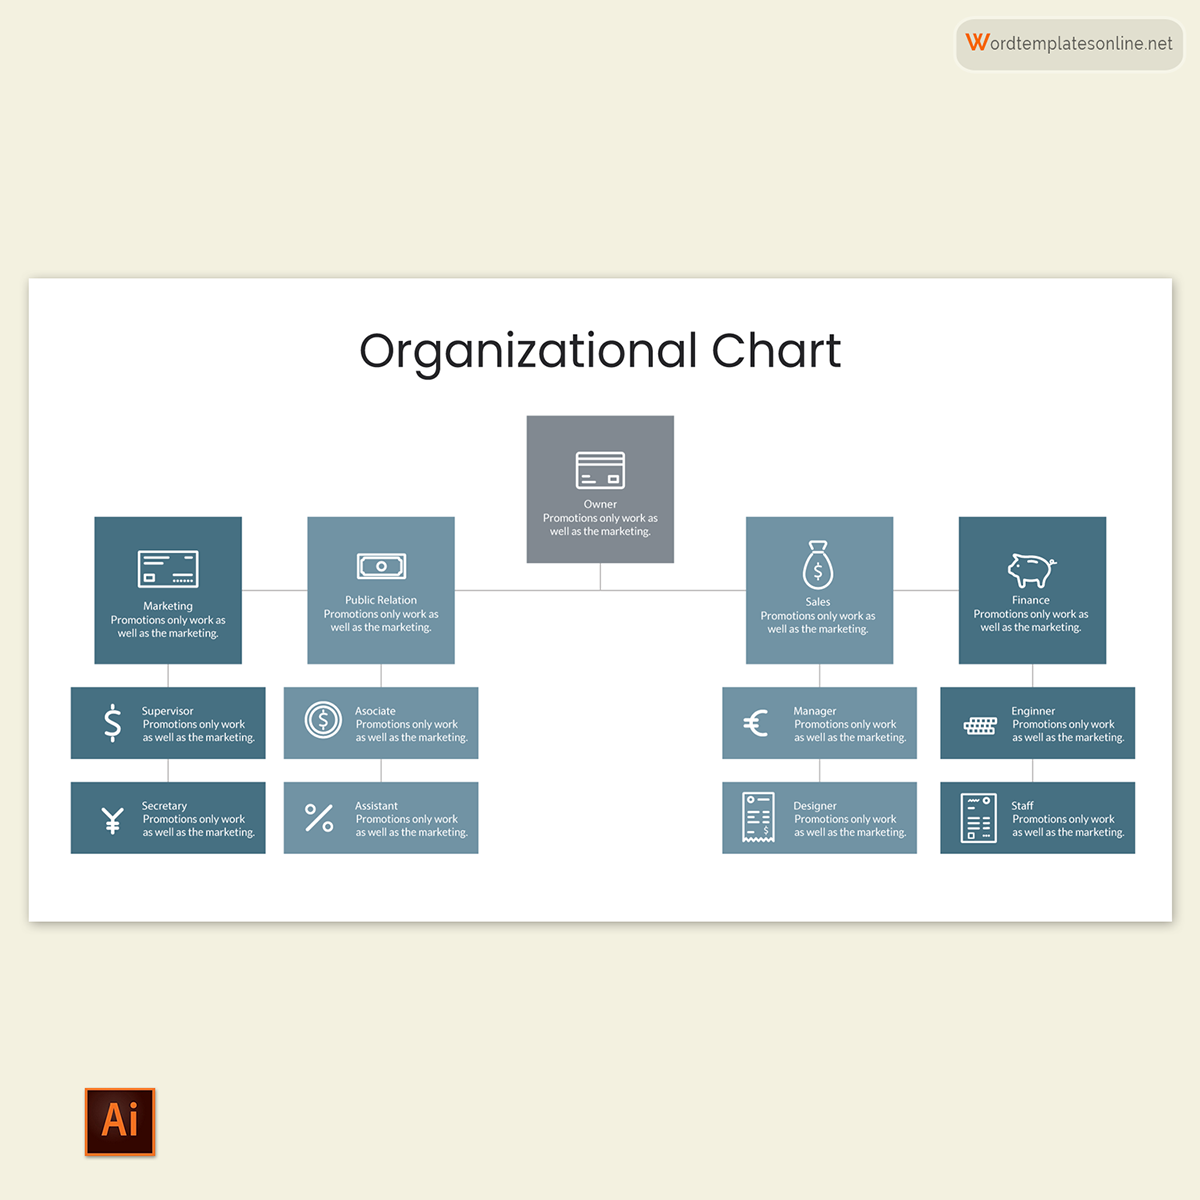
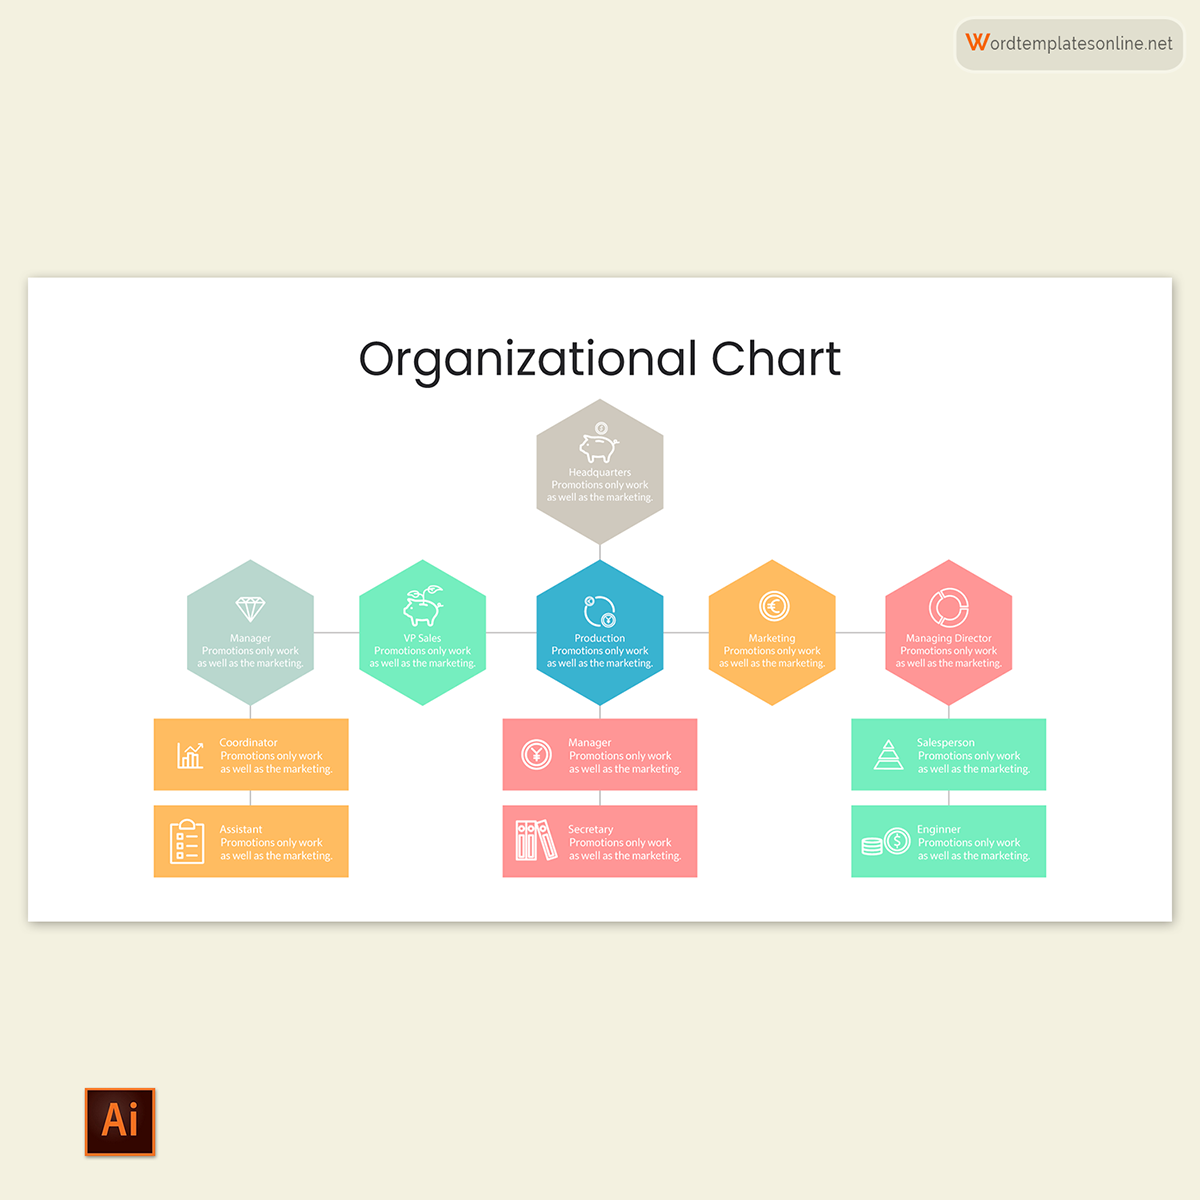
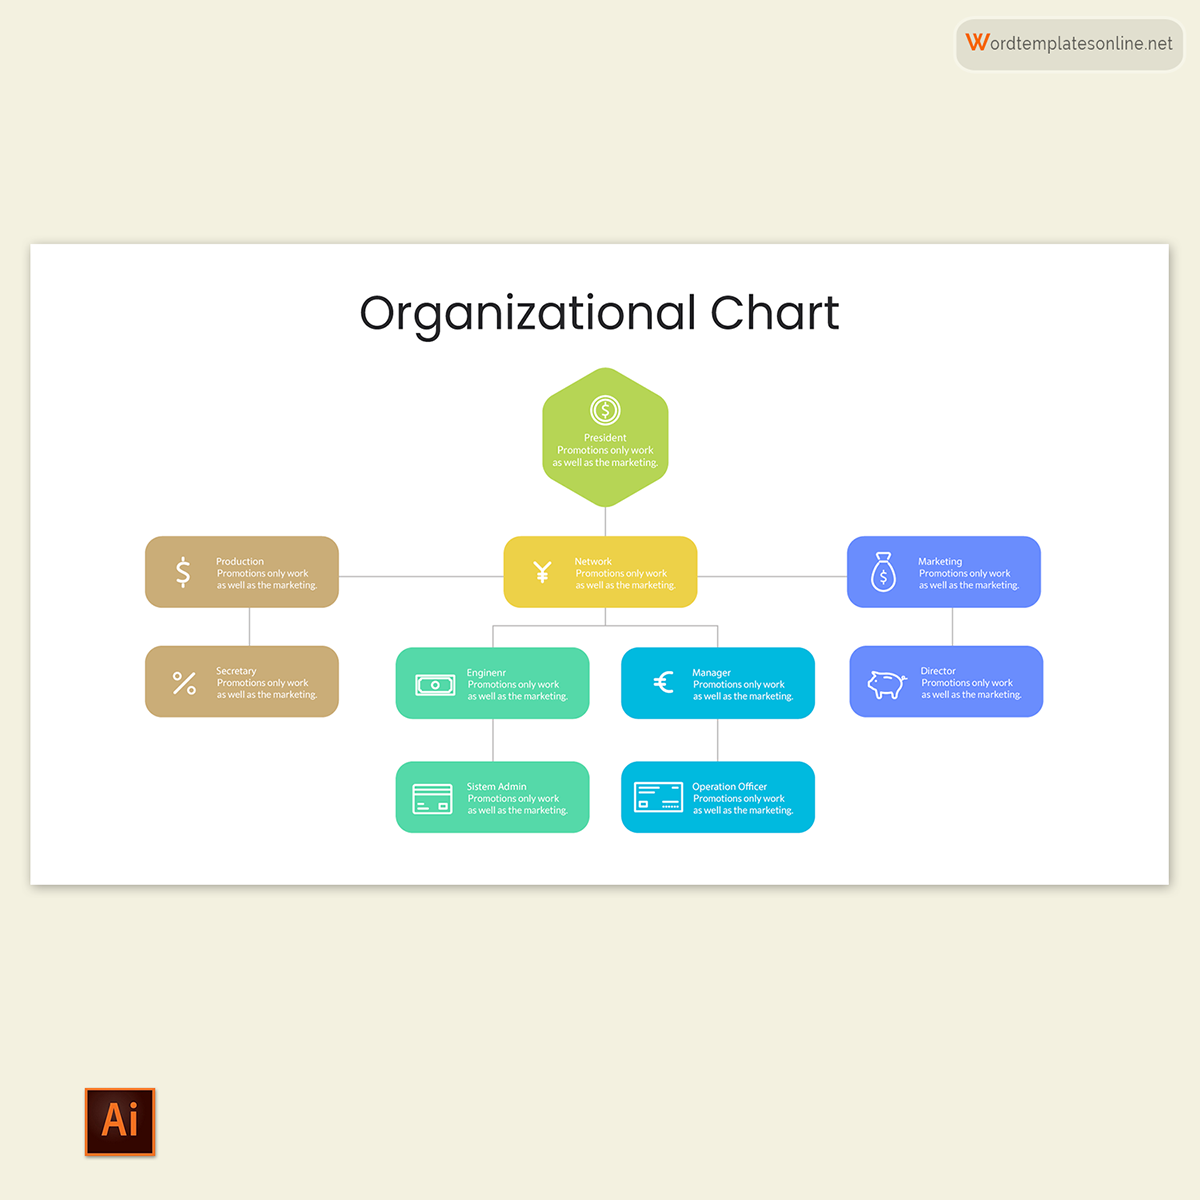
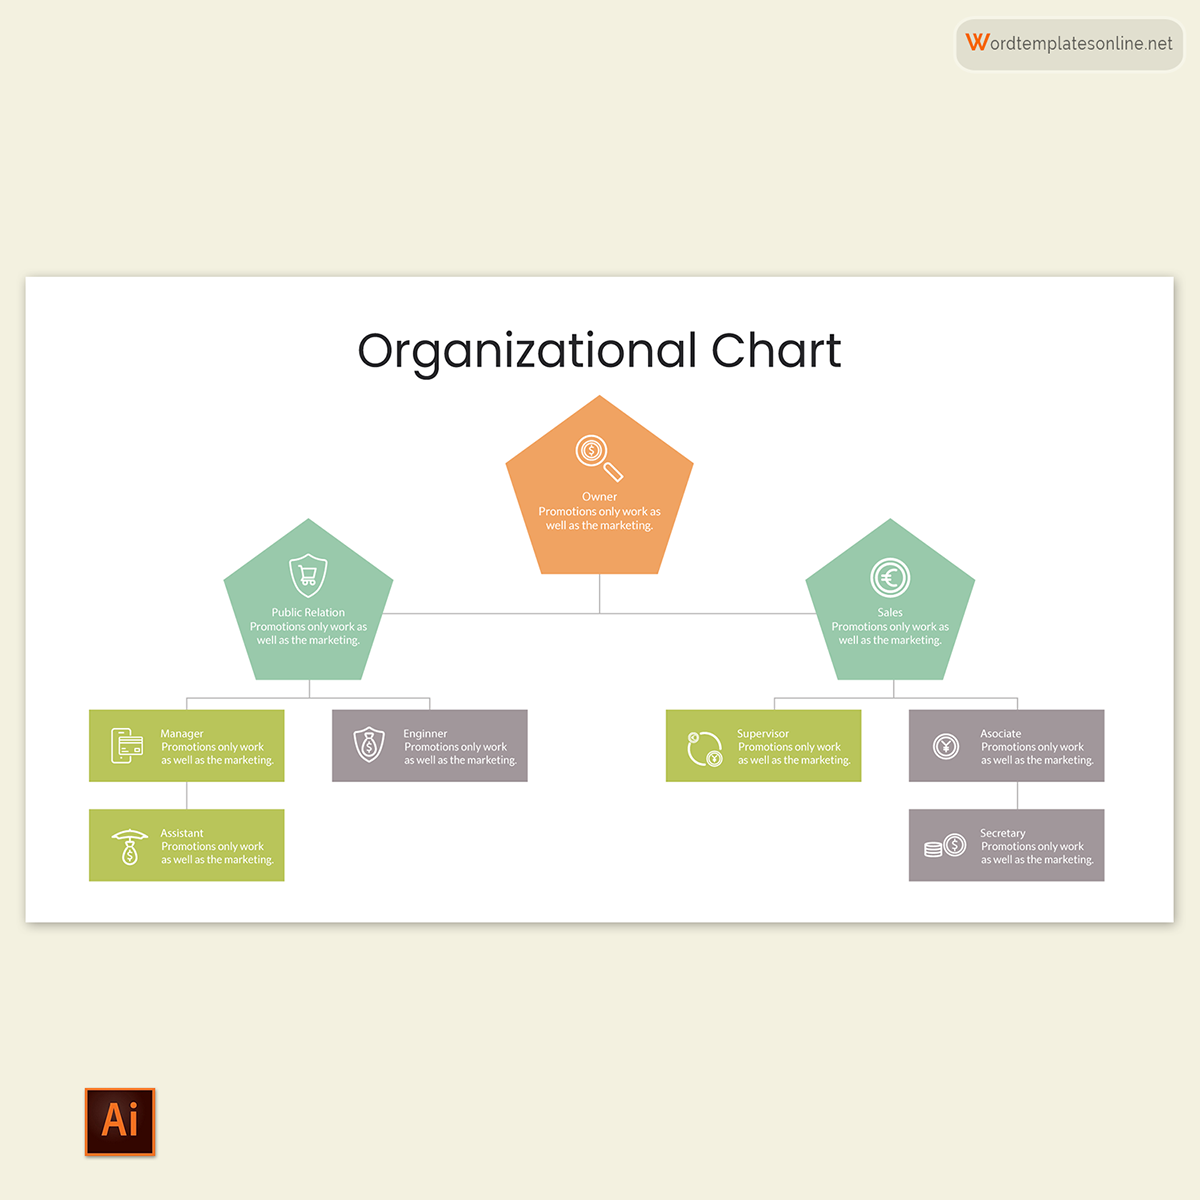
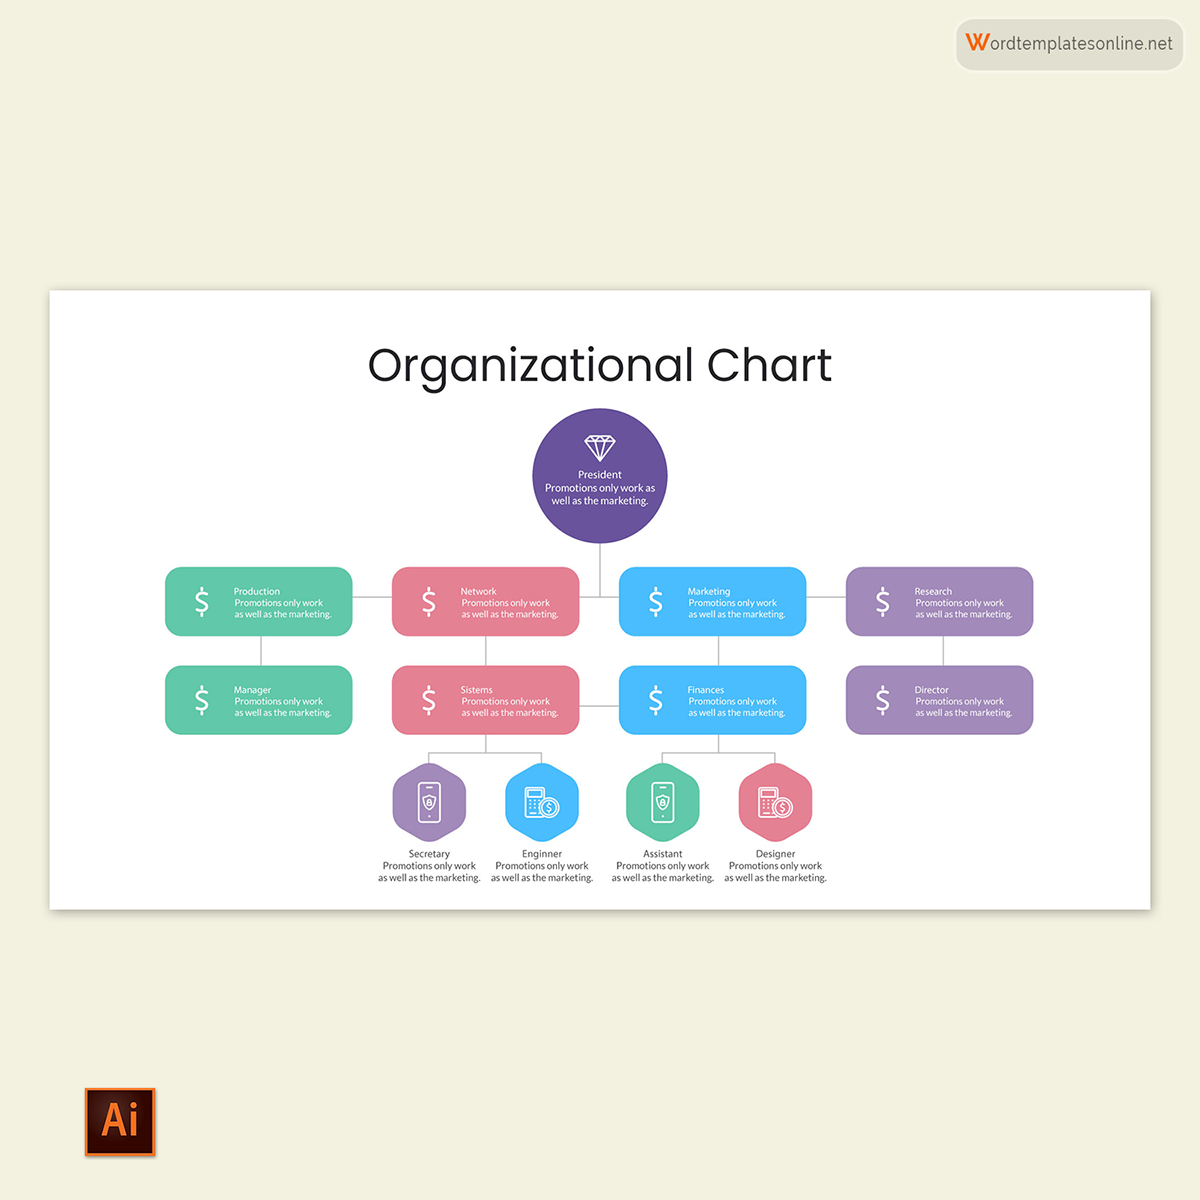
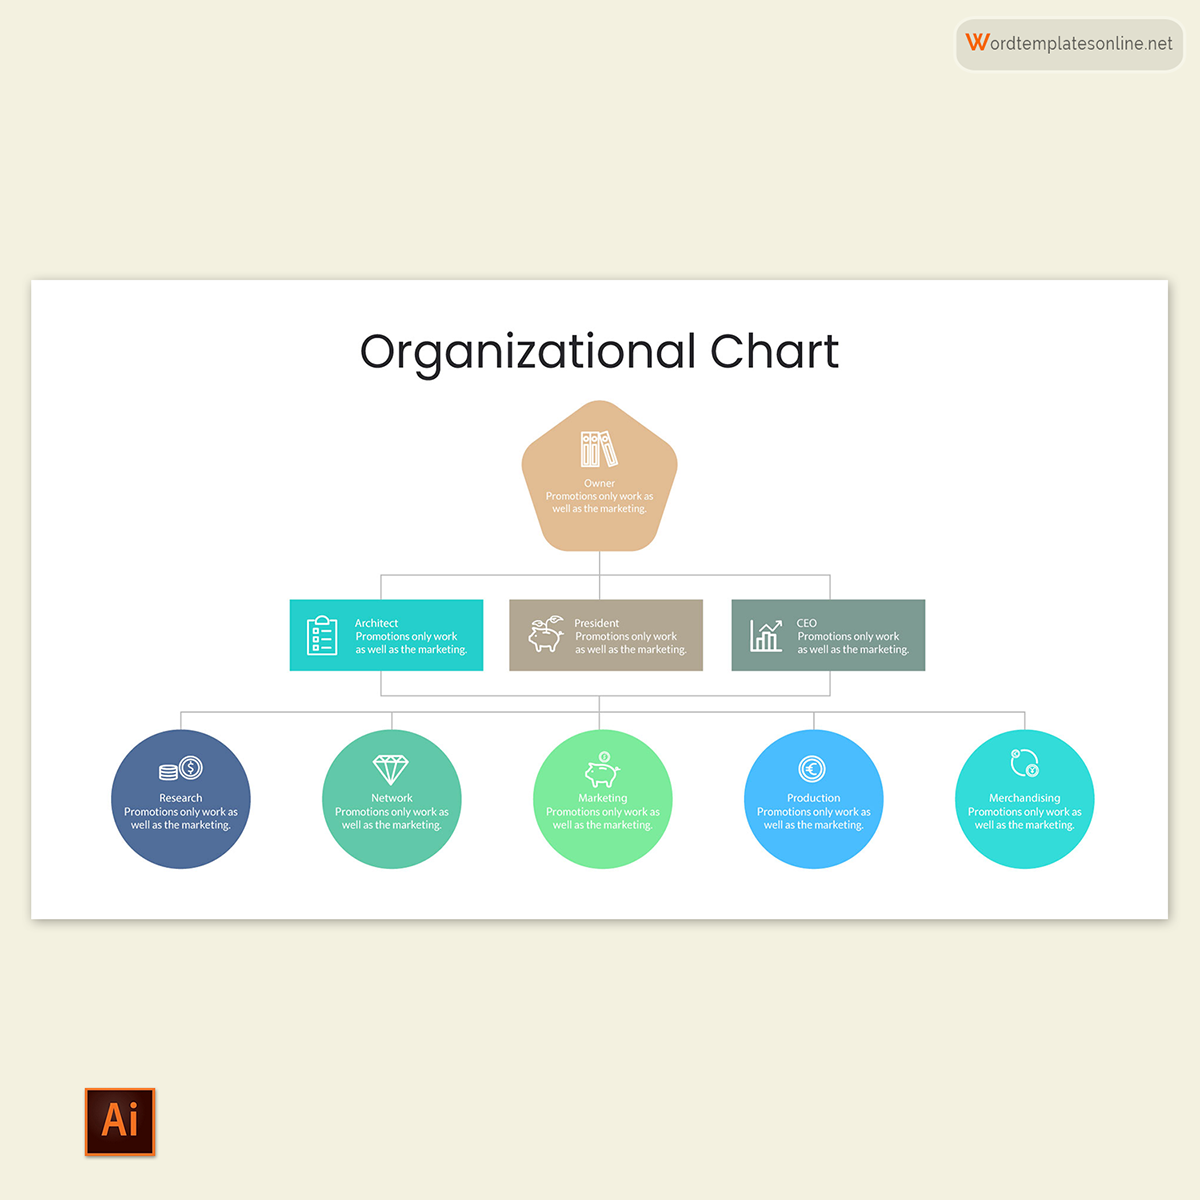
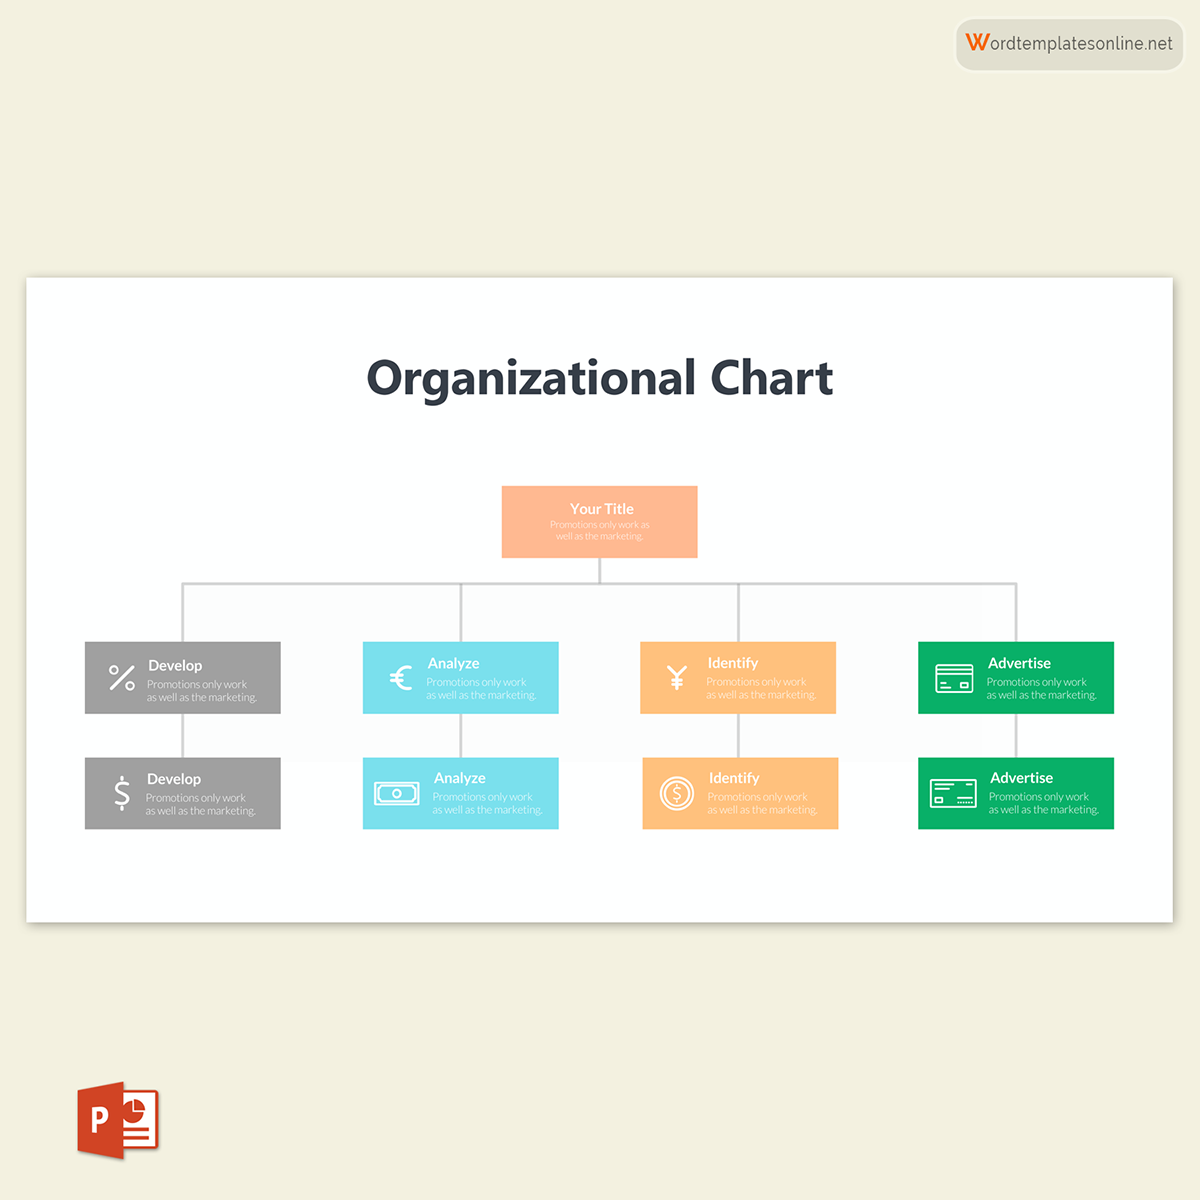
The functional top-down organizational structure is the most popular type. The grouping of employees under this structure is based on their function within the business. A functional org chart represents the traditional business structure. It starts with the topmost position and division and is then broken into the subsequent positions in a hierarchical order.
EXAMPLE
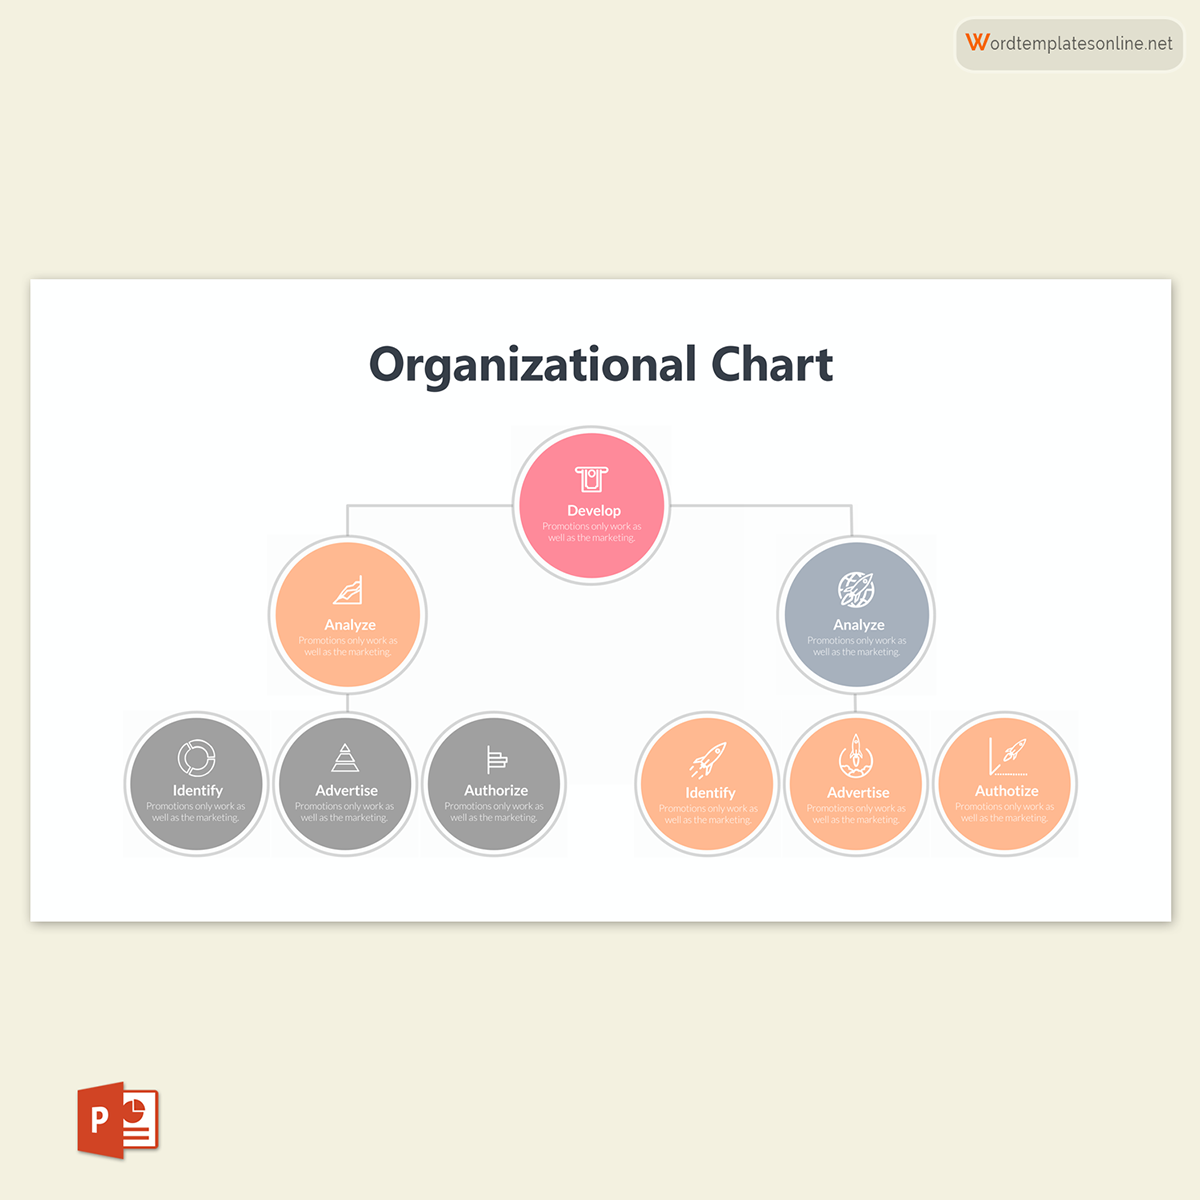
Each division is broken down into senior management, mid-level management, senior staff members, mid-level personnel, and finally, the junior staff members. As a result, this organizational chart assumes a pyramid shape, with the CEO being the topmost employee.
note
A hierarchical organizational chart is the easiest type of org chart to understand. However, its feasibility is compromised in organizations where there are multiple levels in the chain of command. Employees will often have difficulty knowing who to contact and when a case in point is when pitching new ideas in a hierarchical org structure.
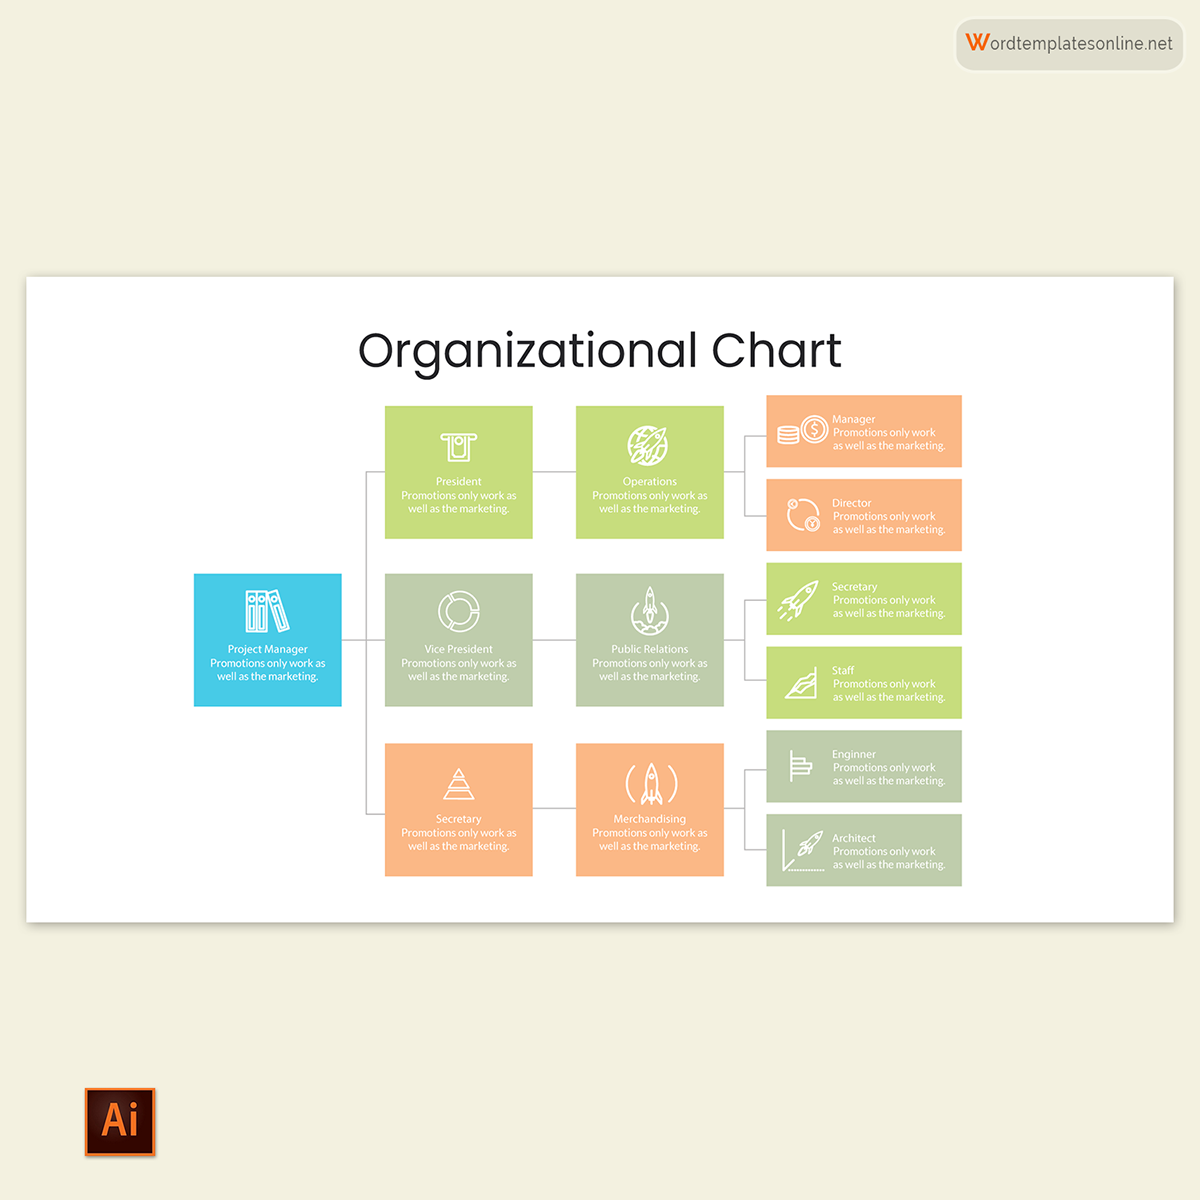
Divisional organizational chart
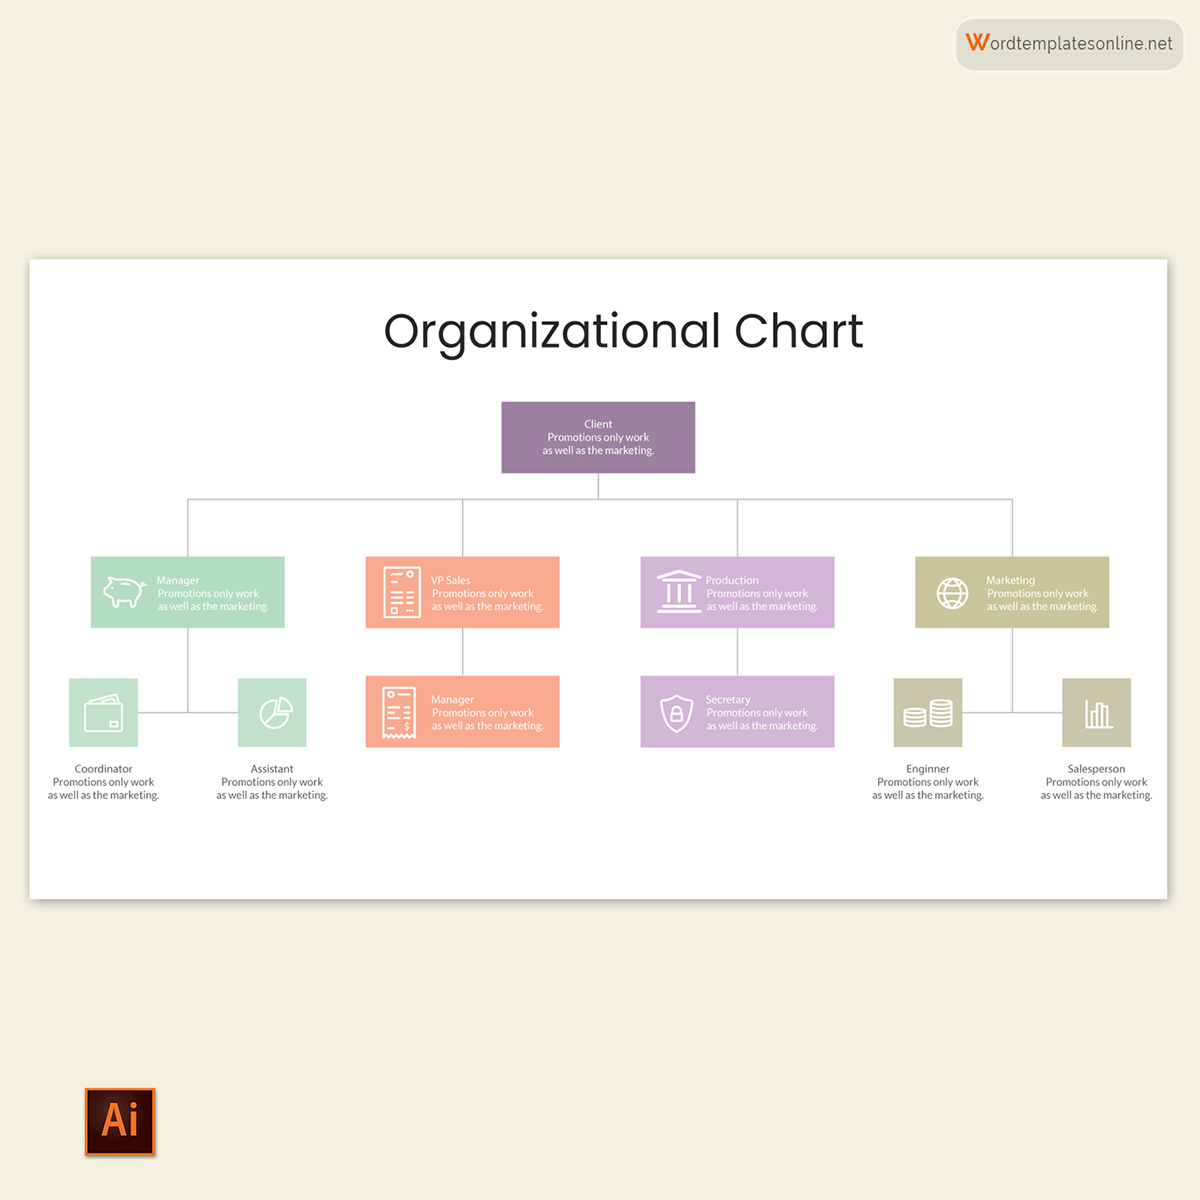
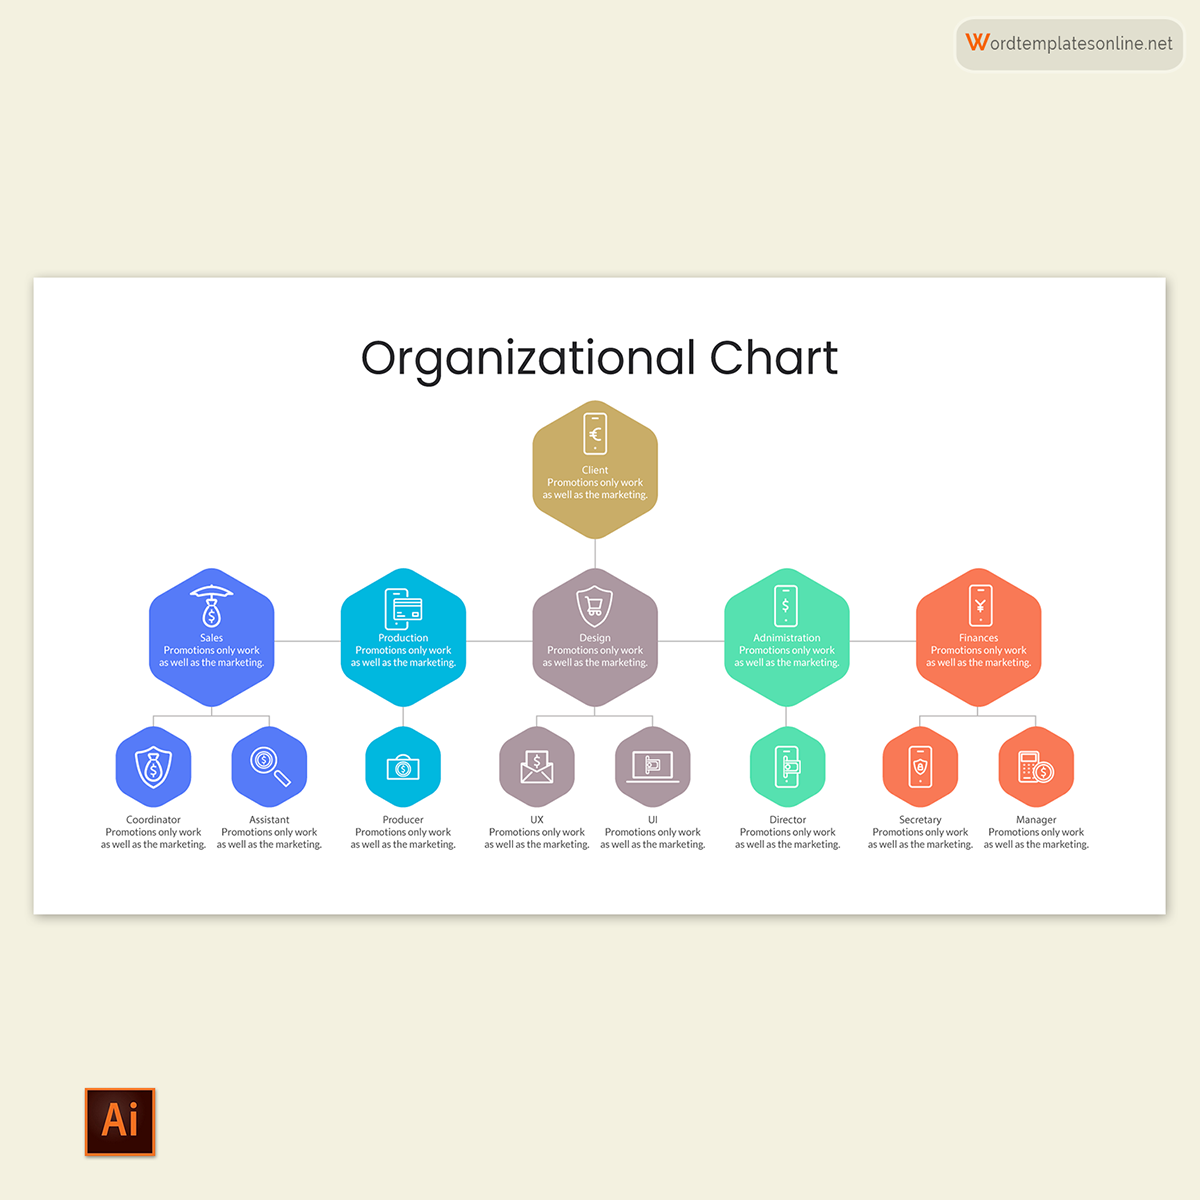
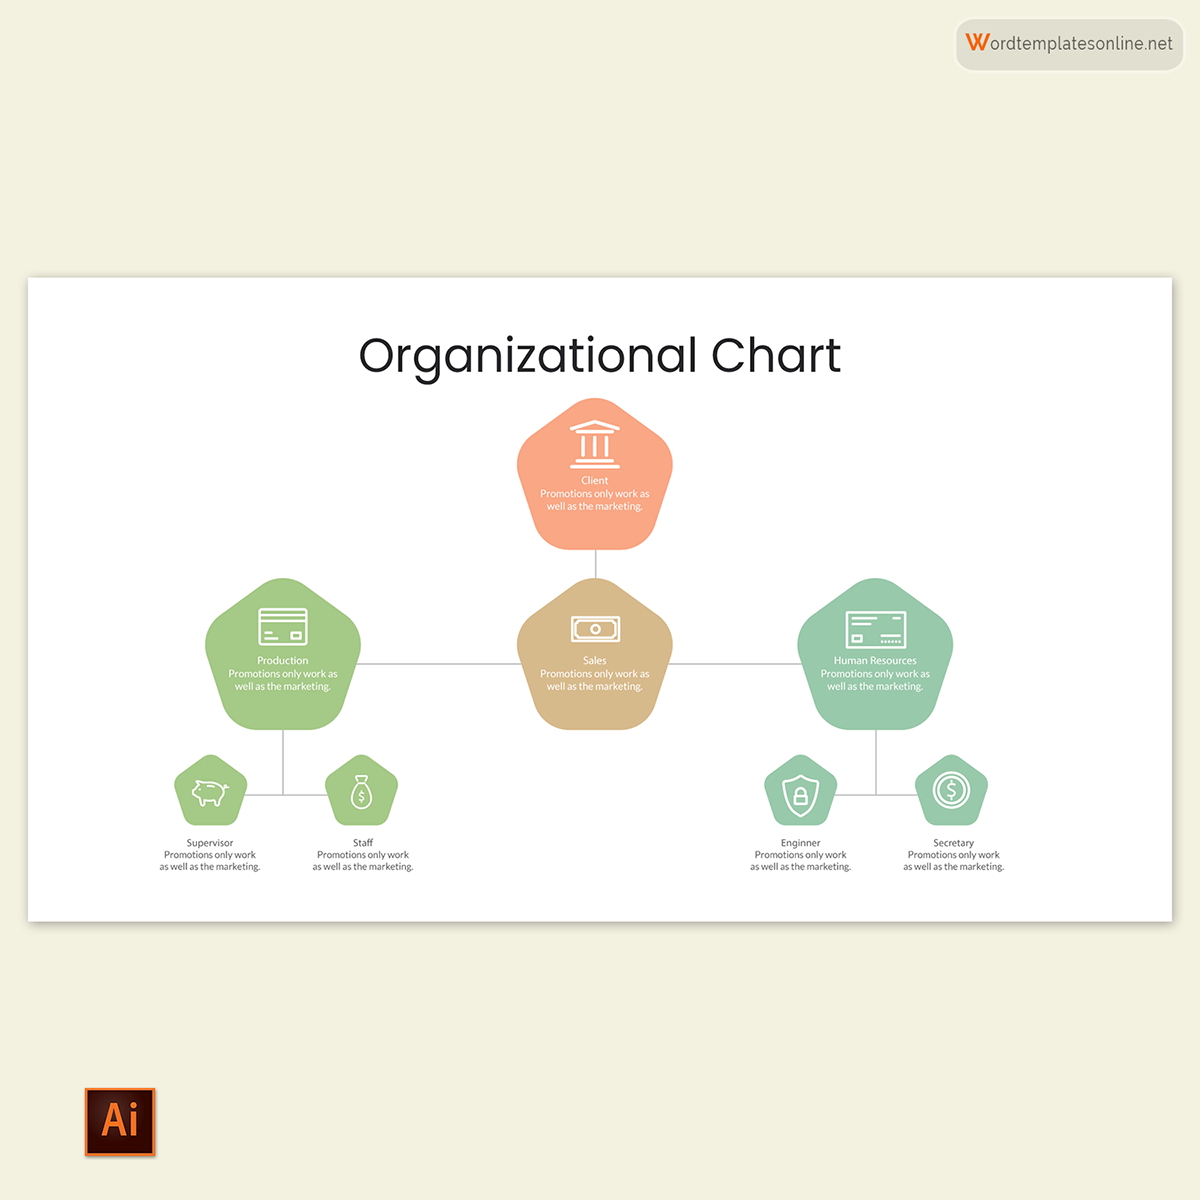
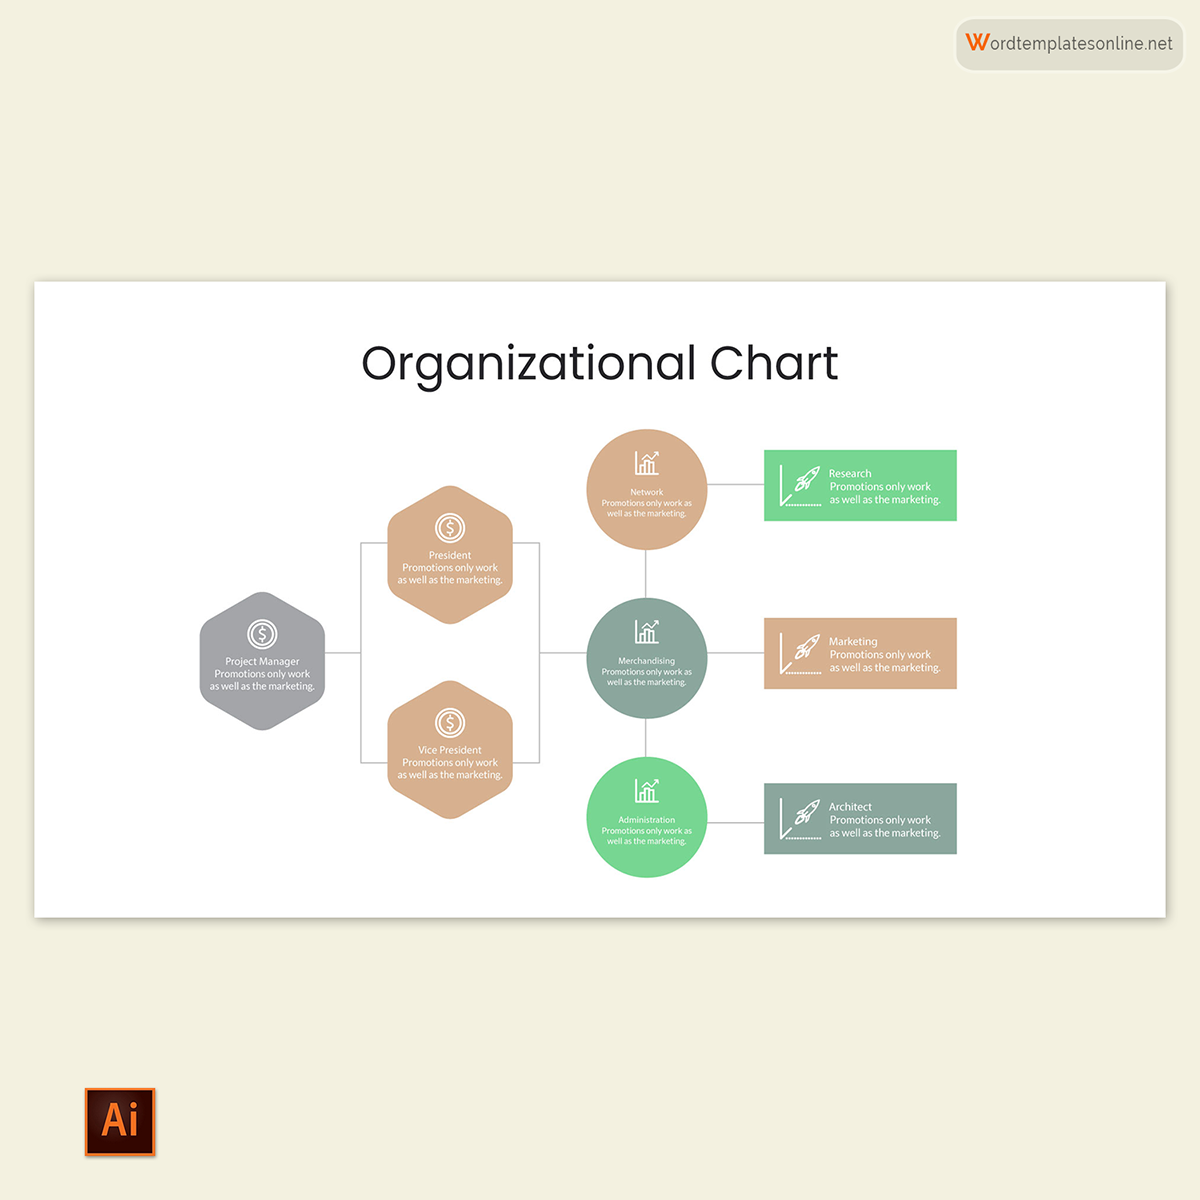
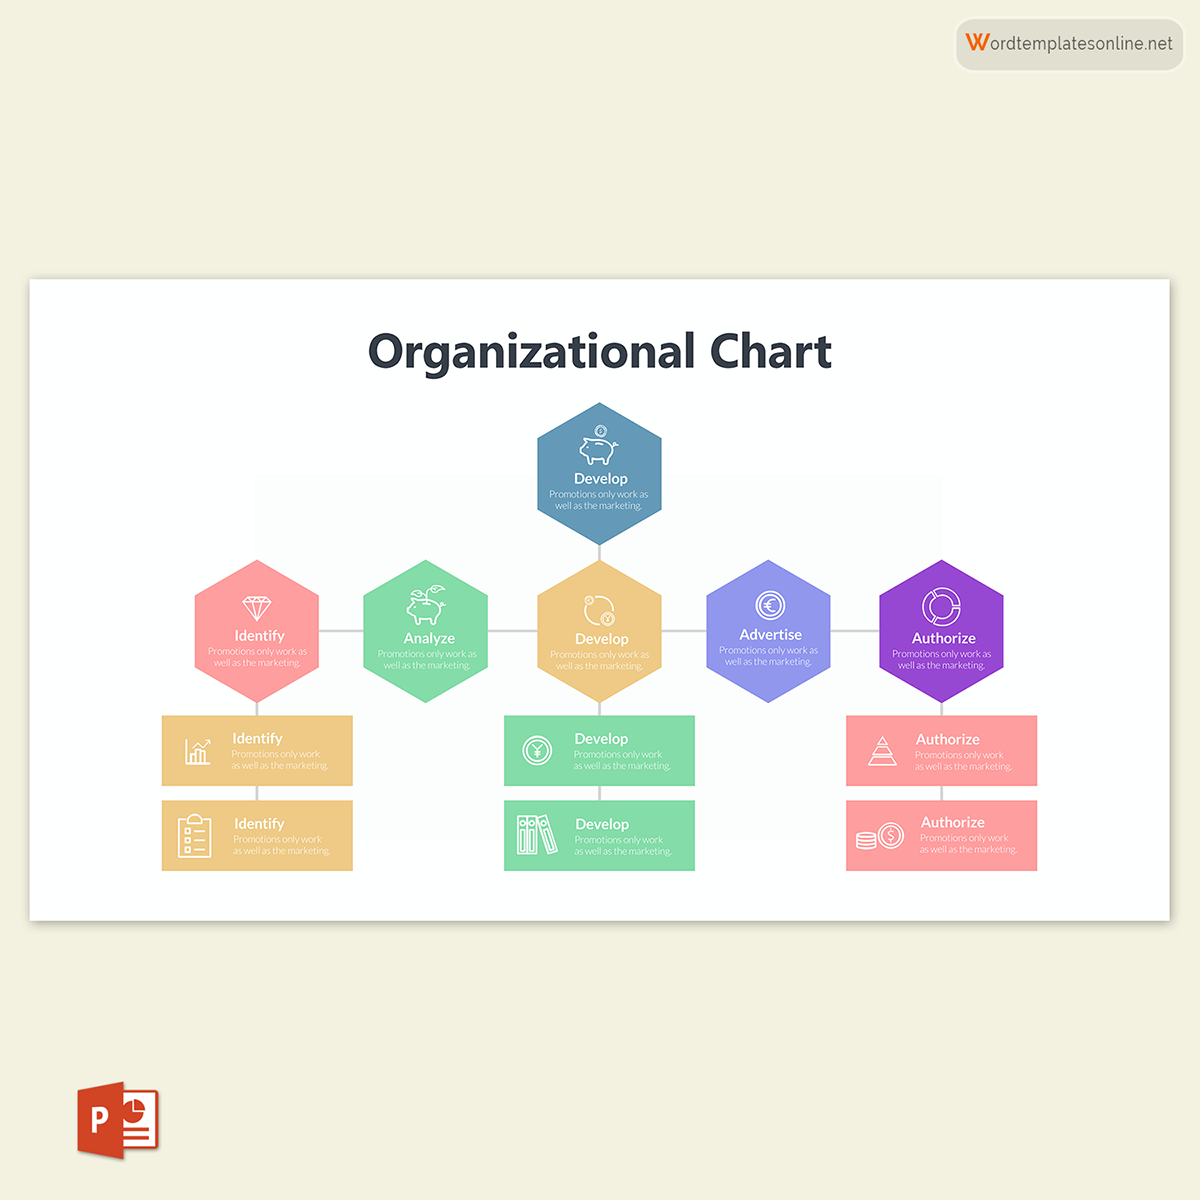
A divisional organogram is primarily based on a company’s product lines, geographic regions, or divisions/subsidiaries within a parent company. Each product line, geographical region, and division is taken to be independent of the other. Each divisional organizational chart starts with the CEO and the corresponding positions and employees associated with each line of business (LOB) or division.
EXAMPLE
Common LOBs are accounting, marketing, HR, etc. In a franchise (multidivisional structure), each subsidiary will have its divisional organizational chart.
A divisional structure allows independent operational flow where the failure of one subsidiary is not reflected on the others; however, it can lead to staff bloat and uncalled overhead expenses.
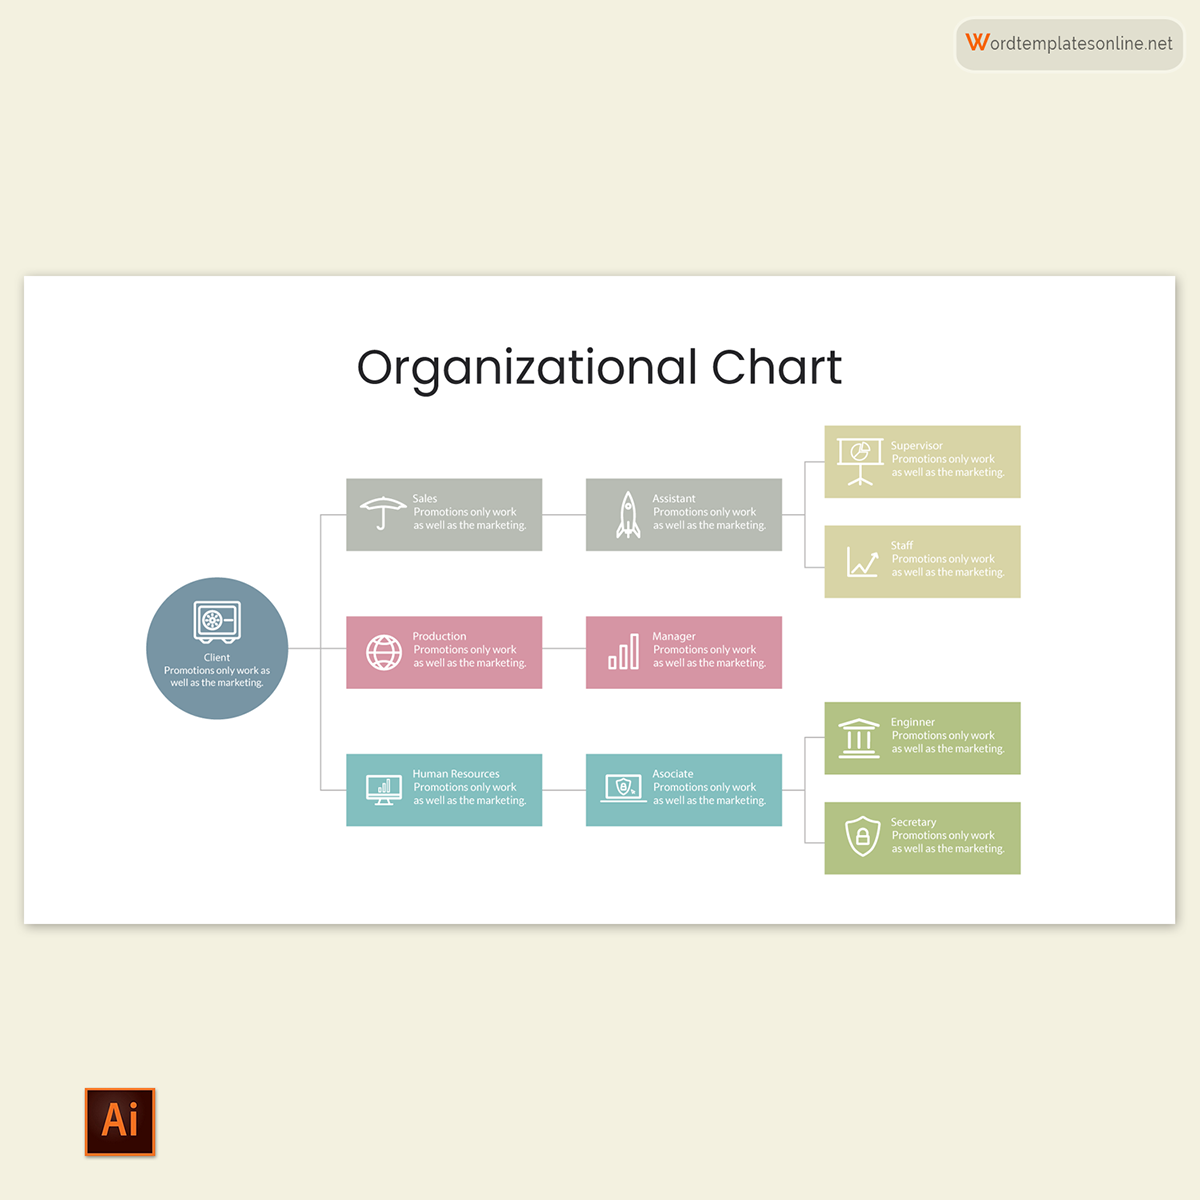
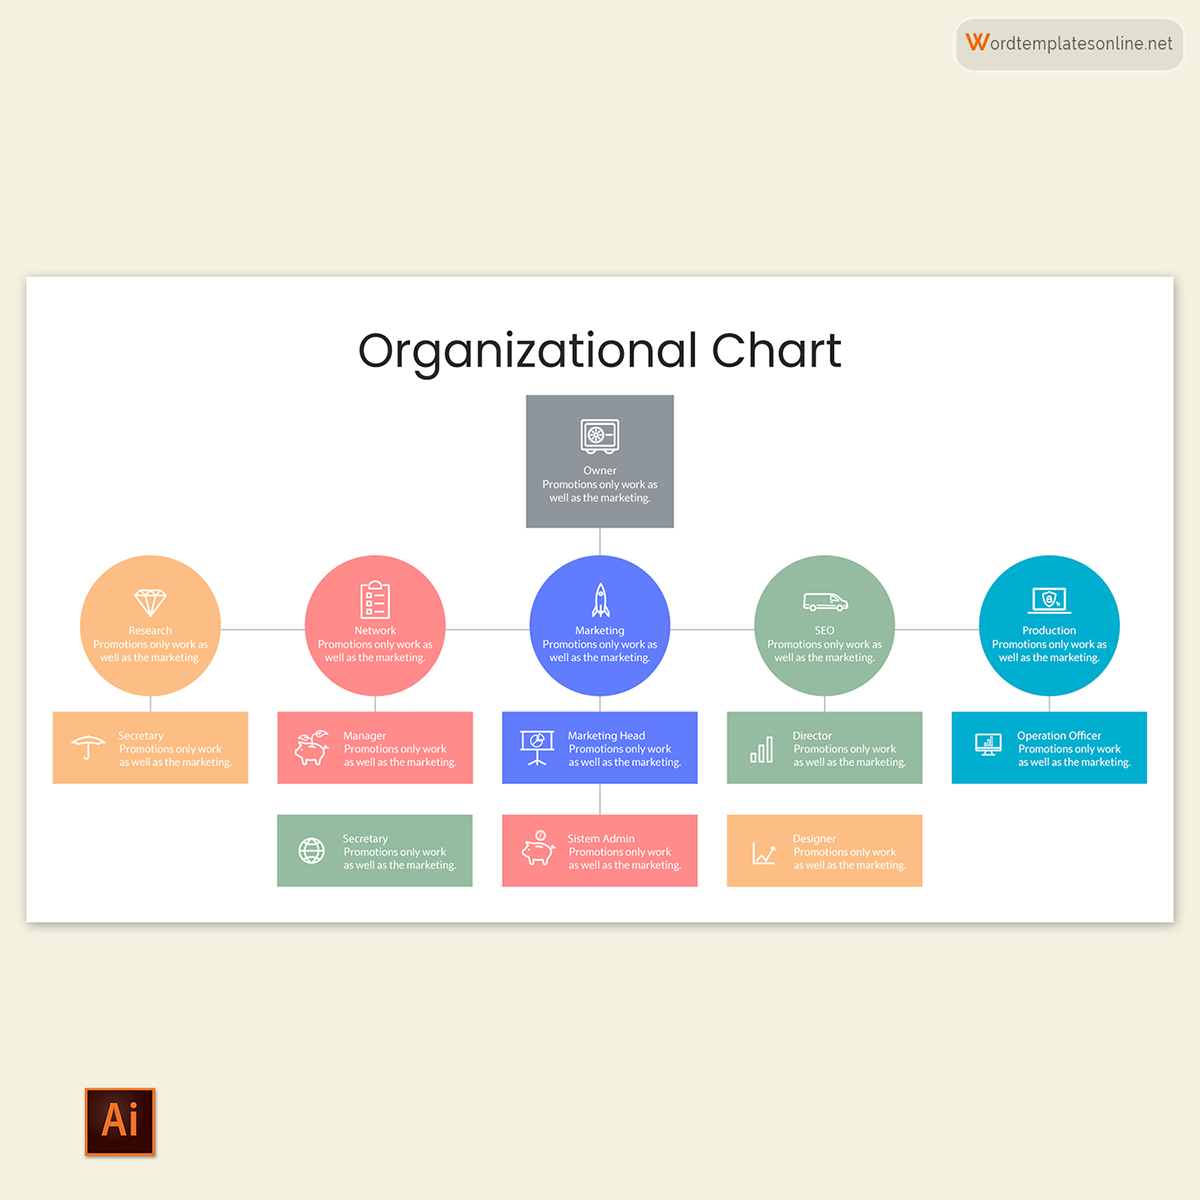
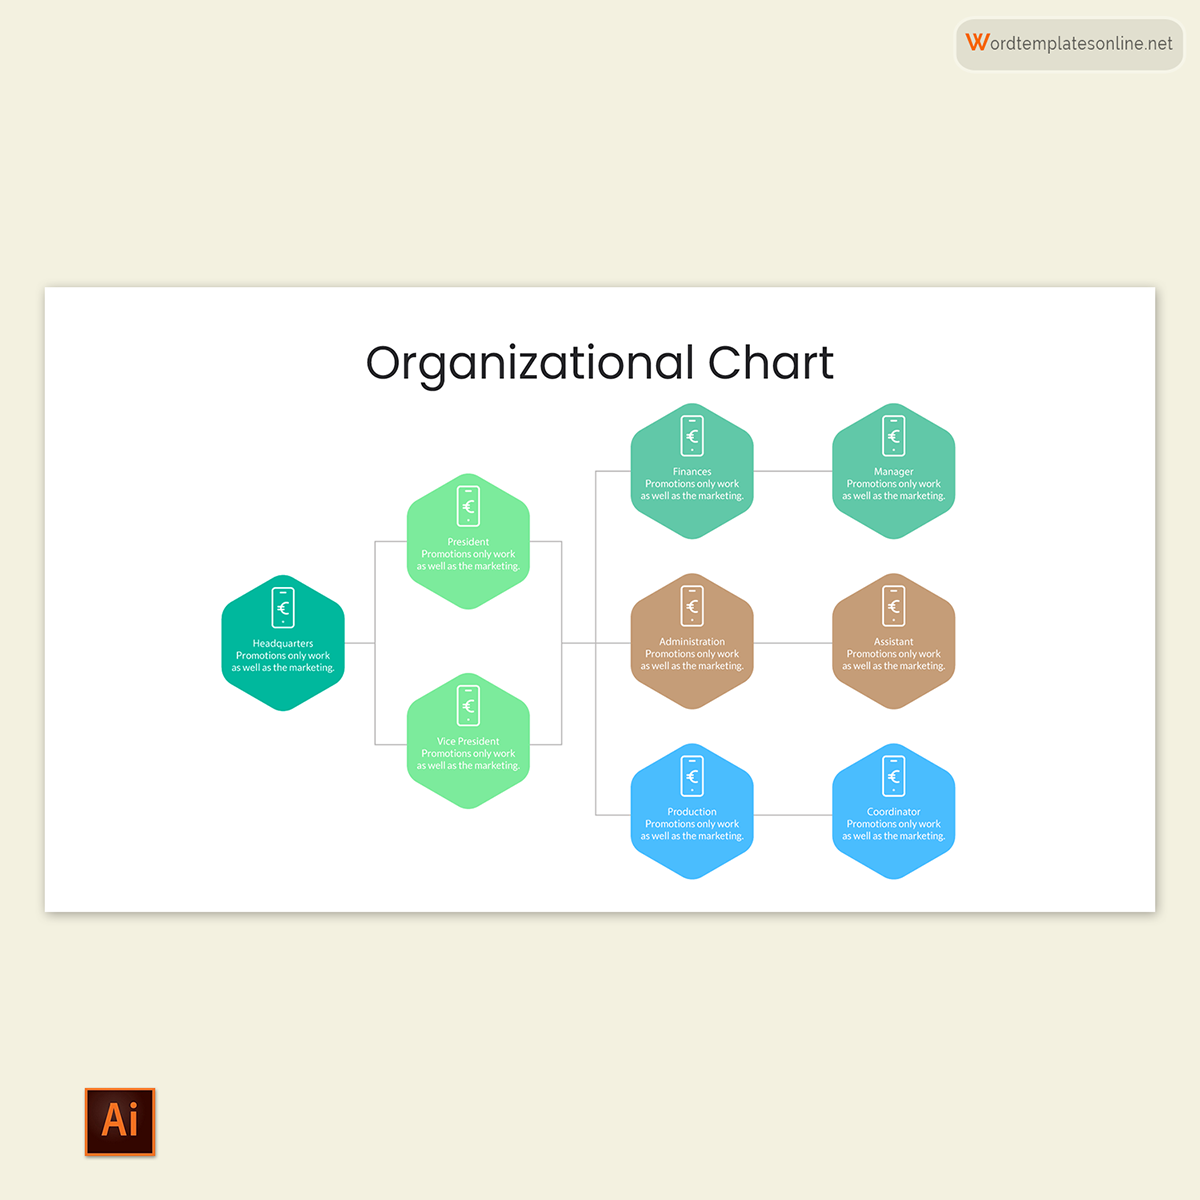
Matrix organizational chart
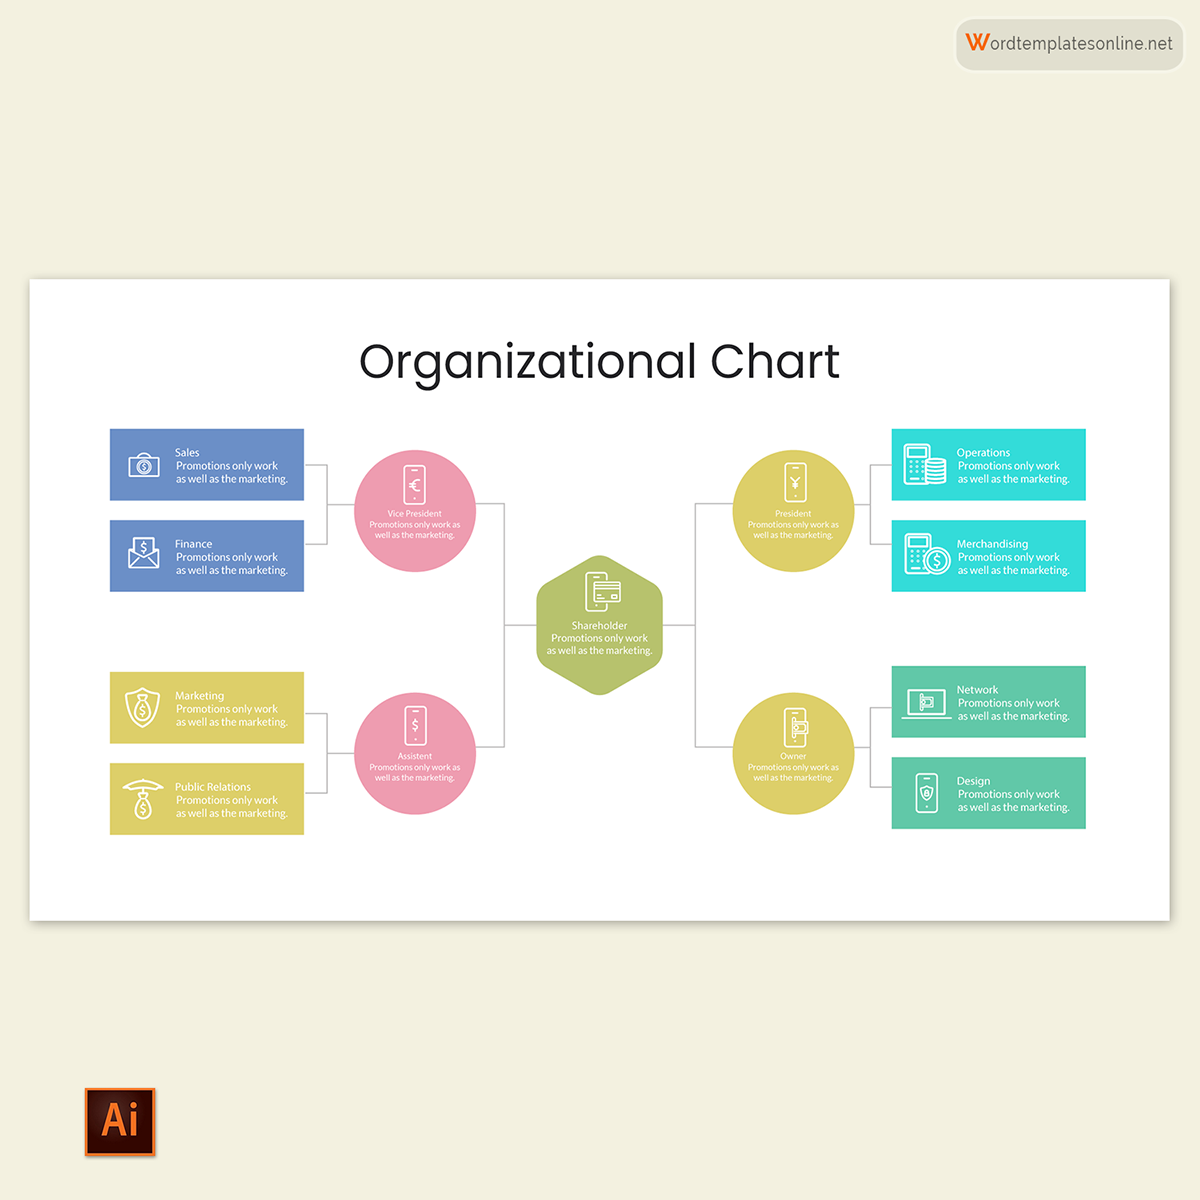
A matrix organizational chart is in companies where employees have more than one supervisor/manager. This, therefore, necessitates team members to work across different departments. A case in point is a website developer who has to consult with managers from different departments to develop an inclusive website for a company.
This type of organizational structure is advantageous in that it creates a more cooperative working environment. However, it can lead to confusion and misunderstandings for different supervisors who typically have different managerial philosophies.
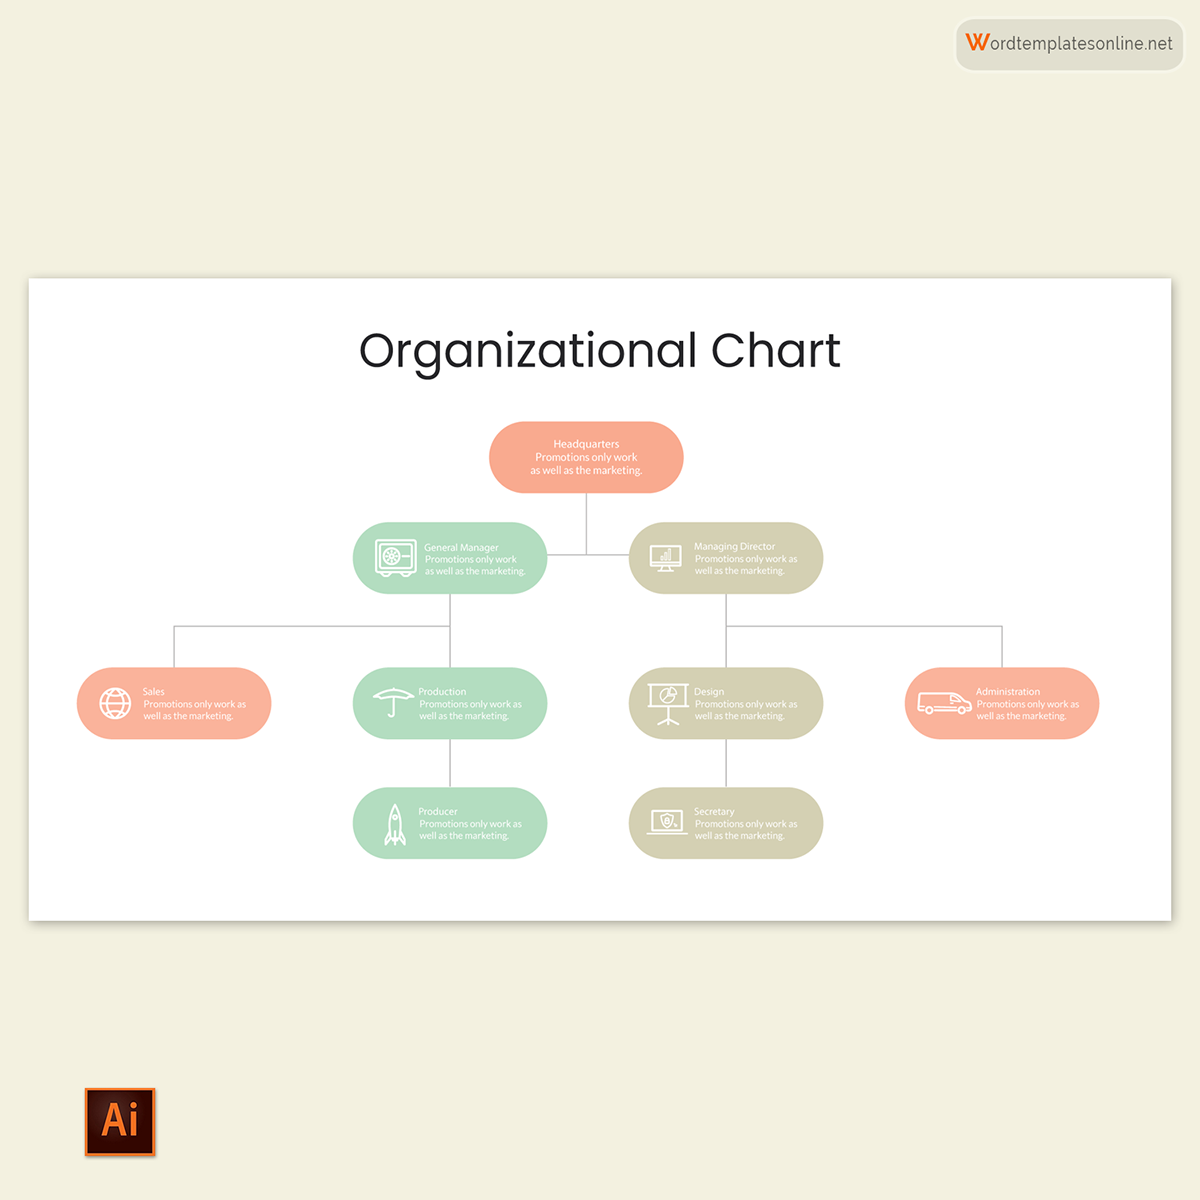
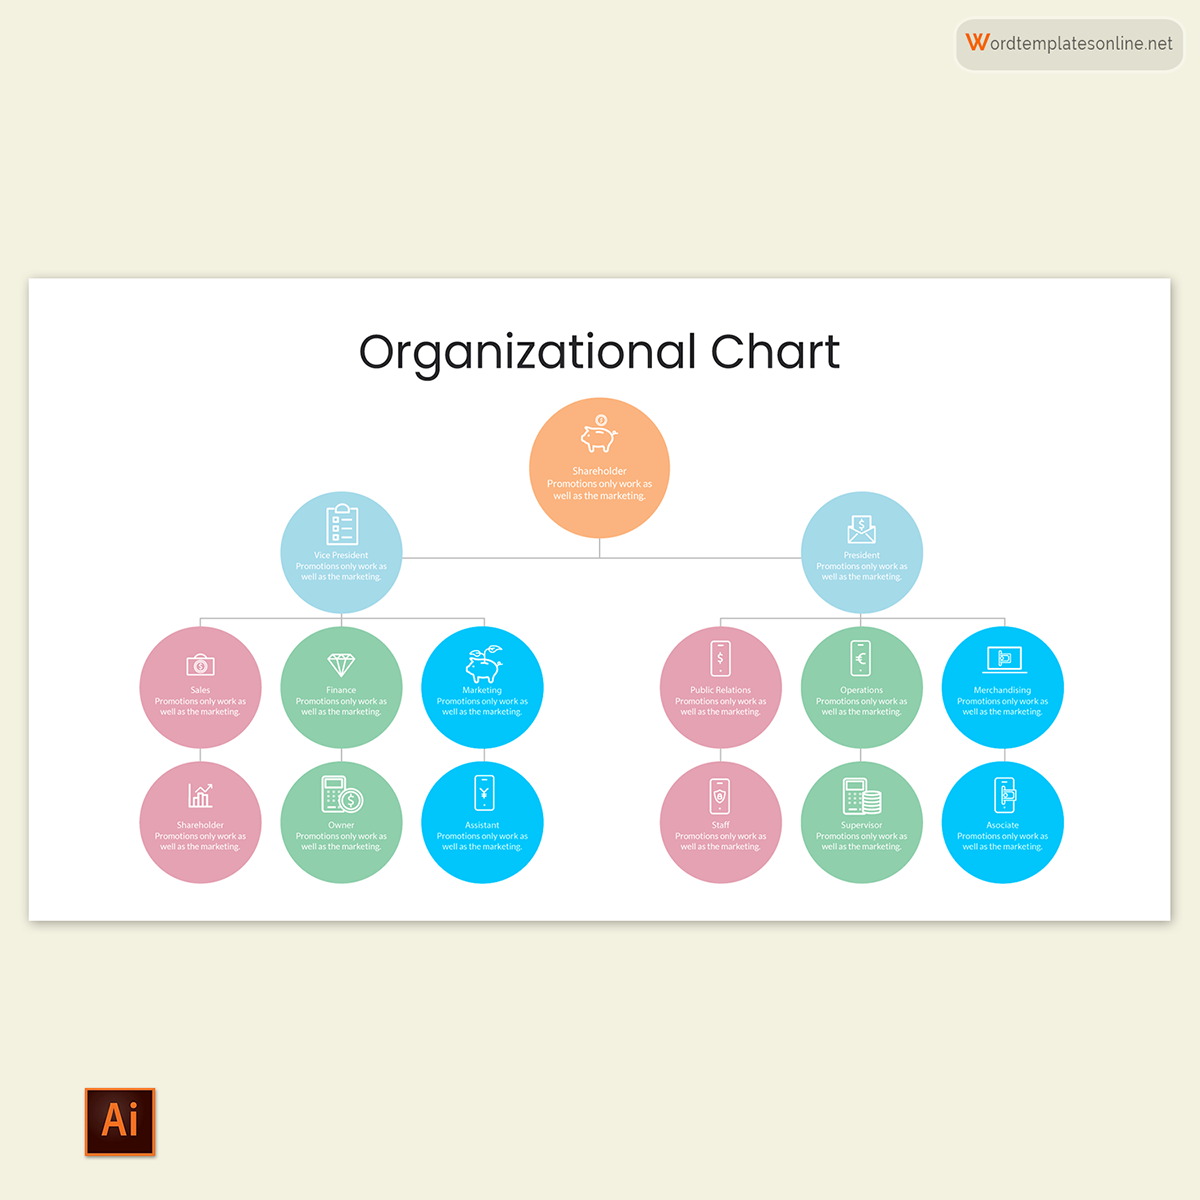
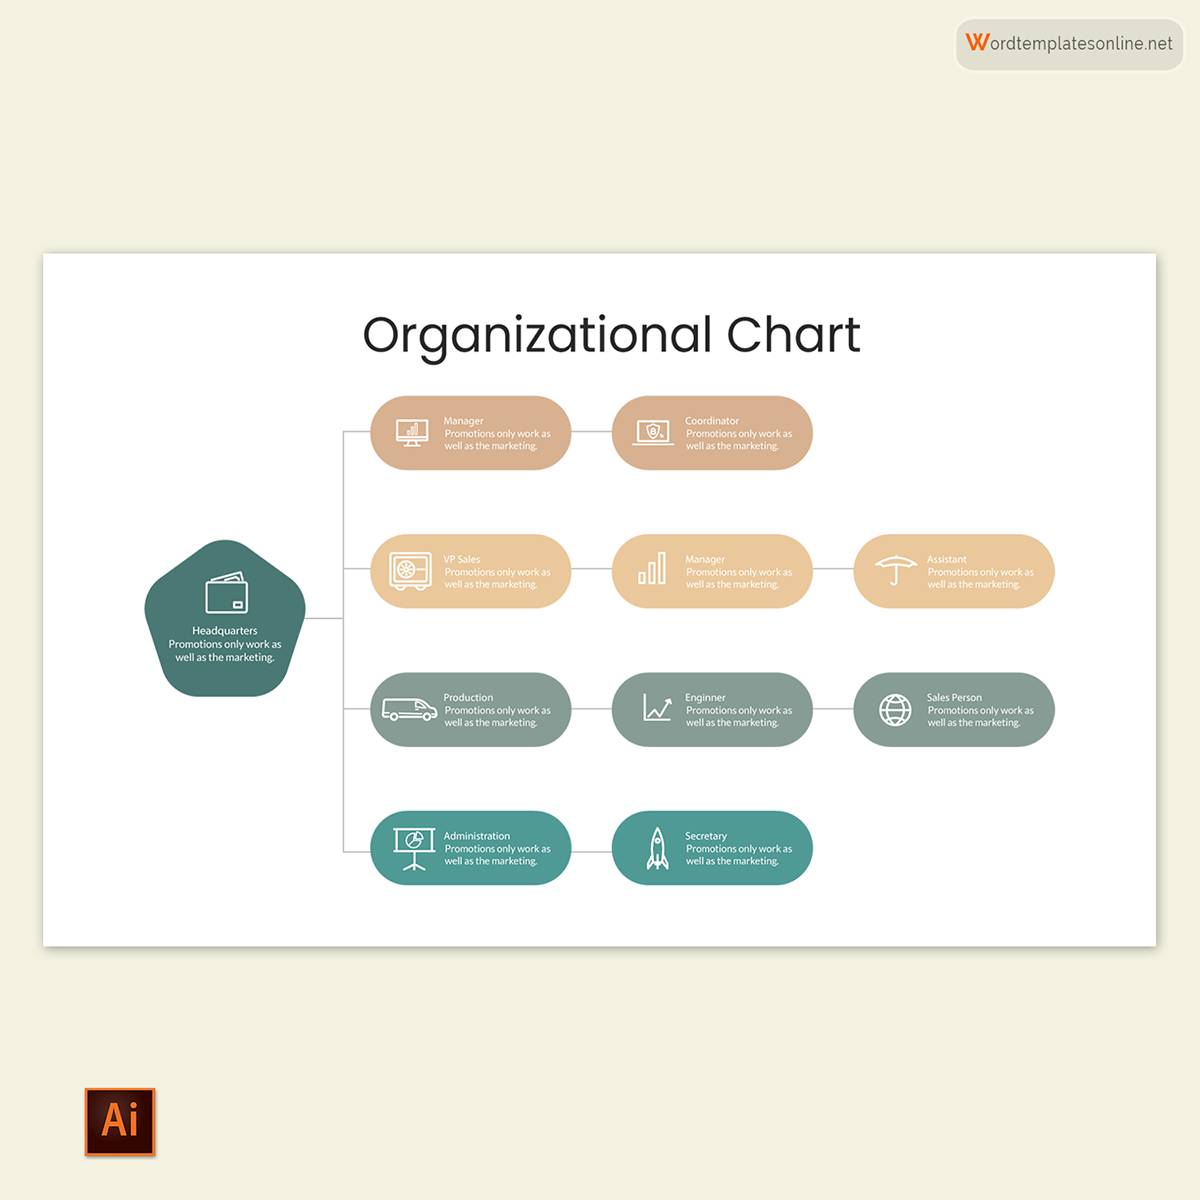
Flat /horizontal organizational chart
Small companies and start-ups mainly adopt a flat or horizontal organogram at their early stages.
Ordinarily, this type of chart has two levels: administrative and workers, meaning the mid-level management, are eliminated. Within the chart, solid lines demonstrate the principal chain of command, while dotted lines illustrate secondary chains of command.
Due to the minimal number of employees, decisions are made quickly. The employees will also have more responsibilities. The structure, however, does not work for large corporations with many employees and departments. Conflicts are also more prevalent in this type of structure.
How Can an Organizational Chart be Made With Software?
Org charts are documents customarily created by the software. Companies use various software to create personalized organograms.
This article will discuss these software and how they are used to make charts:
PowerPoint
PowerPoint is one of the software used to create organograms on top of its primary purpose of making presentations. Once all the employees have been identified and positions are assigned.
The following steps are followed:
- Create a new PowerPoint document.
- Move the cursor to the insert tab and click on the SmartArt command
- Scroll down to the Hierarchy group. Choose the type of org chart that best suits the requirements of the organization’s structure
- Click on the shapes to add text to write the details needed
- Add or delete shapes accordingly to provide suits to the company’s structure.
- Use the SmartArt Tools Design tab to move the shapes vertically, then use the Promote/Demote commands. To move the shapes horizontally, use the Move Up/Move Down commands.
MS Word
While it may not be a more popular way of creating org charts, MS Word can be used to create them.
The following steps are used for this process:
- Navigate the toolbar to the Insert tab and click on the SmartArt command.
- Scroll down to the Hierarchy option and select the preferred organogram chart template.
- Click on the respective shapes to add text
- To add more shape, under the Design tab, use the Add Shape command
- Use the SmartArt Tools Design tab to alter the order of positions, move the shape using the Promote/Demote or Right to Left commands. Alternatively, select the text to be moved in the text dialog box and use the Tab button to move them up or the Shift + Tab buttons to move the shape down.
Visio
Visio is software used to create org charts with data compiled in Excel databases or Active Directories. It uses a drag-and-drop canvas tool to create the chart automatically.
The following steps are used to create organograms using Visio:
- Open Visio and select the Organization Chart Wizard
- Click on “Information that’s already stored in a file or database,” or information can be added directly into the Organization Chart Wizard
- Answer the questions portrayed
- Select import to add any preferred images or pictures
- Select finish
MS Excel
Excel is a standard tool used to create organizational charts. It has excellent diagramming and organizing capabilities.
The procedure to use excel in creating an organogram with excel is discussed below:
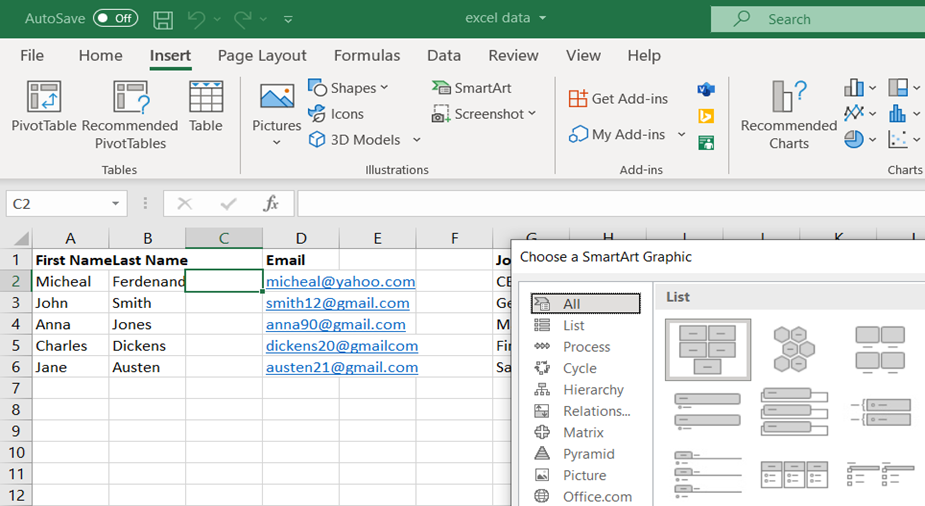
4.1 Click SmartArt
The first step is to open the application and select the Insert tab and click the SmartArt command.
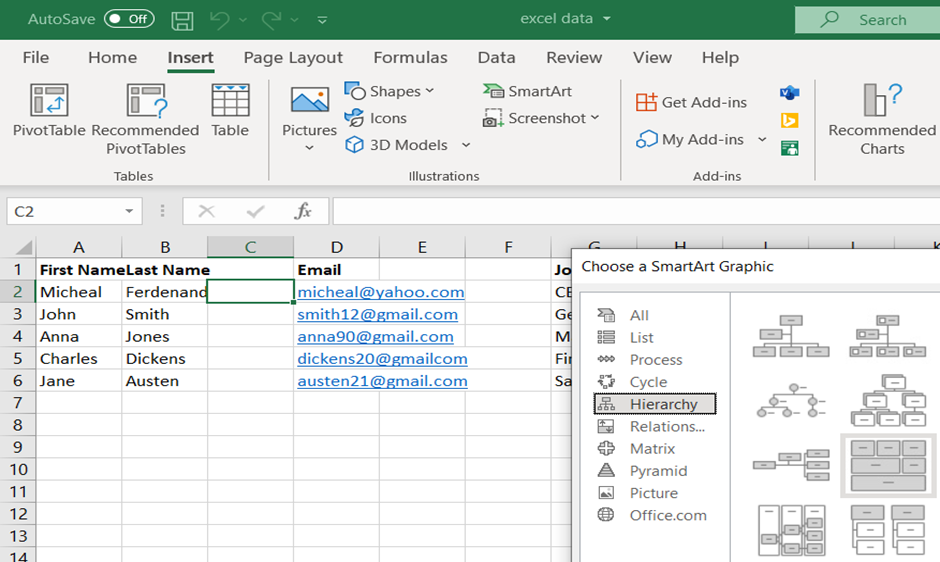
4.2 Click on chart in hierarchy fly-out
Next, select the hierarchy option. Several chart layouts will be shown. Then, select the chart layout of preference that best suits the organization’s structure.
4.3 Add text to shapes
Afterward, add text to the boxes of the chart. Ensure to follow the correct order that is adopted for the specific org chart.
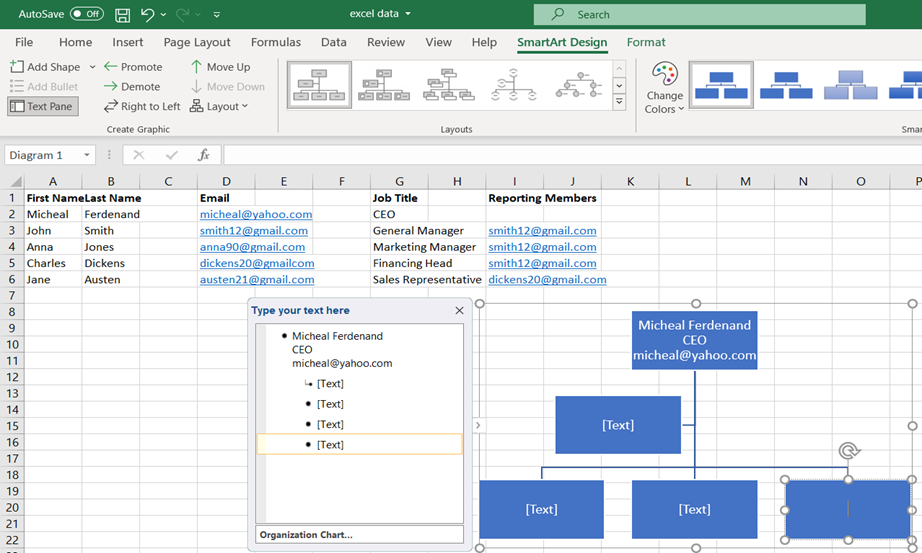
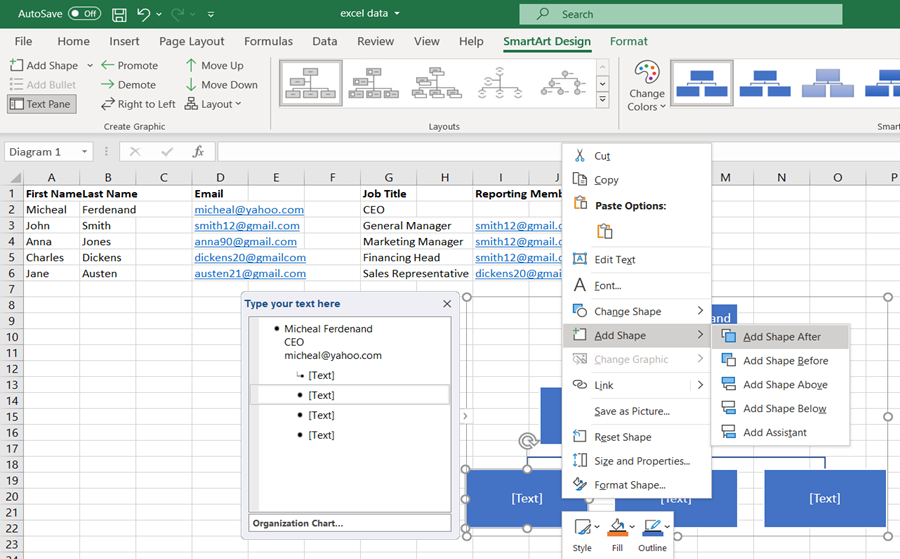
4.4 Add/remove shapes
The next step is to modify the chart to accommodate the number of employees and positions of the company. Two ways can be used to add shapes to the chart: clicking the “+” sign in the text dialog box or pressing the Ctrl + Right Soft Button and selecting where the shape should be added. The other symbols can be used to remove or move the shapes.
4.5 Update the chart
Excel allows users to customize organizational charts. The font, color, and shape can be customized to match the company’s brand by navigating to the SmartArt Design tab and incorporating the needed changes.
To change the organogram’s shapes or font when updating the chart, navigate to the Format tab and edit accordingly. One can change the boxes’ outline and background color and shape. Other than the font, the font color can also be changed.
Organizational chart in excel from a list of employees
An alternative way of creating an organogram using excel is using an organization chart template. For instance, the following steps can be followed to this effect.
5.1 Download the template
Firstly, download a befitting organizational chart template for Excel from the internet. There are numerous sources that are available free of cost. The template outlines all the necessary sections needed in a standard org chart.
5.2 Add employees
Next, add the necessary information such as names, designation, roles, and responsibilities. Once completed, the template acts as the employee database.

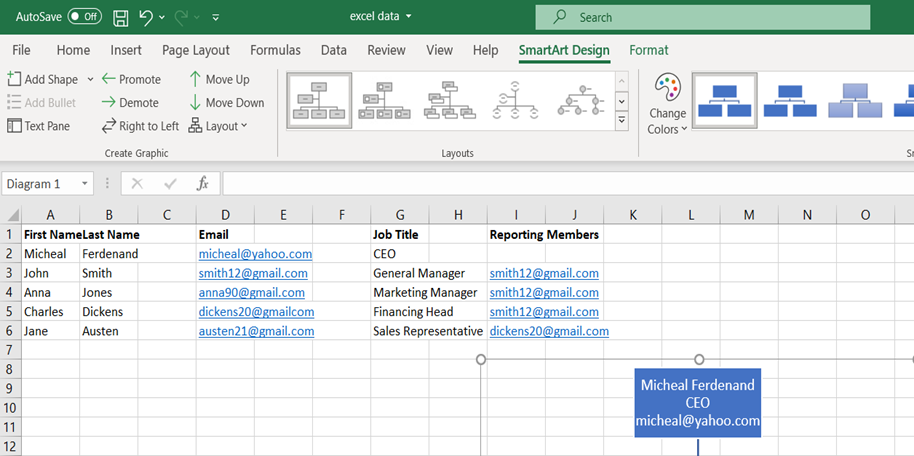
5.3 Copy/paste employee data
Once all the data has been filled out, clear the SmartArt dialog text box, copy and paste the data in the text box as employee data. Unwanted information can be excluded by hiding the column before copying the data.
5.4 Style employee data
Lastly, edit the data in the org chart. Each employee data pasted from the template will be in one long line, edited so that information is arranged in a particular order in different lines. For example, start with the name, title, and contact information, followed by responsibilities. It is recommended that one should start with organizing the data from the most junior employee.
Tips for Creating an Organizational Chart
The presentation of org charts can be improved by incorporating certain elements that improve its appeal to its intended audience.
The following tips are known to add flavor to org charts.
Right size it
Create appropriately sized organograms. Too large org charts are overwhelming to review, and it is not easy to trace specific information. It is better to have multiple charts than have one long chart. However, it should be ensured that the different charts lead the audience back to the highest position in the organization.
Use shapes/color consistently
Use the same shapes and colors throughout each division/level or department of the organogram.
EXAMPLE
Designate a specific shape for the top-level staff, mid-level employees, and junior employees. Use a single color for each division within the company.
Add sufficient information
- Include additional details about the employees. For example, contact details, specialties, and location assist individuals looking for specific assistance for the organization’s staff.
- Show assistant with sidebars.
- Use sidebars to indicate assistants to managers. This adds value to the org chart as it helps people know who they should contact to reach the manager.
- Pay attention to spacing
- Boxes or shapes should be equidistant from each other. This element creates a professional outlook of the chart and makes it easier to read.
Key Takeaways
- An organizational chart is designed depending on the organizational structure of a company. Each type of structure will have its advantages and disadvantages. It is, therefore, to select a type of chart that befits the company in question.
- Common types of org charts are functional top-down/hierarchy, matrix, divisional, and flat/horizontal.
- They are meant to represent the staff members, divisions, and departments within an organization. It can be made to include details such as names, job titles, and contact details of the employees.
- Org charts can be created using different software such as MS Word, PowerPoint, Visio, and Excel. Companies can then create personalized org charts that align with their brand and structure.
About This Article