Project management utilises different tools, among them being a RACI chart. This chart offers a simple way to document roles and responsibilities. It allows project managers/businesses to quickly clarify and organise information regarding the different responsibilities within project tasks.
The chart can organise each task, milestone, and project phase. The chart helps project managers ensure that each team member knows their role in the project. This simplifies decision-making.
This can be very useful in a team or organisation with many members. This article will discuss the following:
- What is a RACI chart?
- The steps in creating the chart for any project.
- The pros and cons of a RACI chart
- Alternative methodologies to the chart
What is a RACI Chart?
It is a visual aid that designates roles and responsibilities to team members and outlines their level of involvement in the project.
A team member can be responsible, accountable, consulted, or informed about a specific area/task of the project, depending on their role. The chart is utilised throughout the project to track the duties of the team members.
Free Templates: RACI Chart
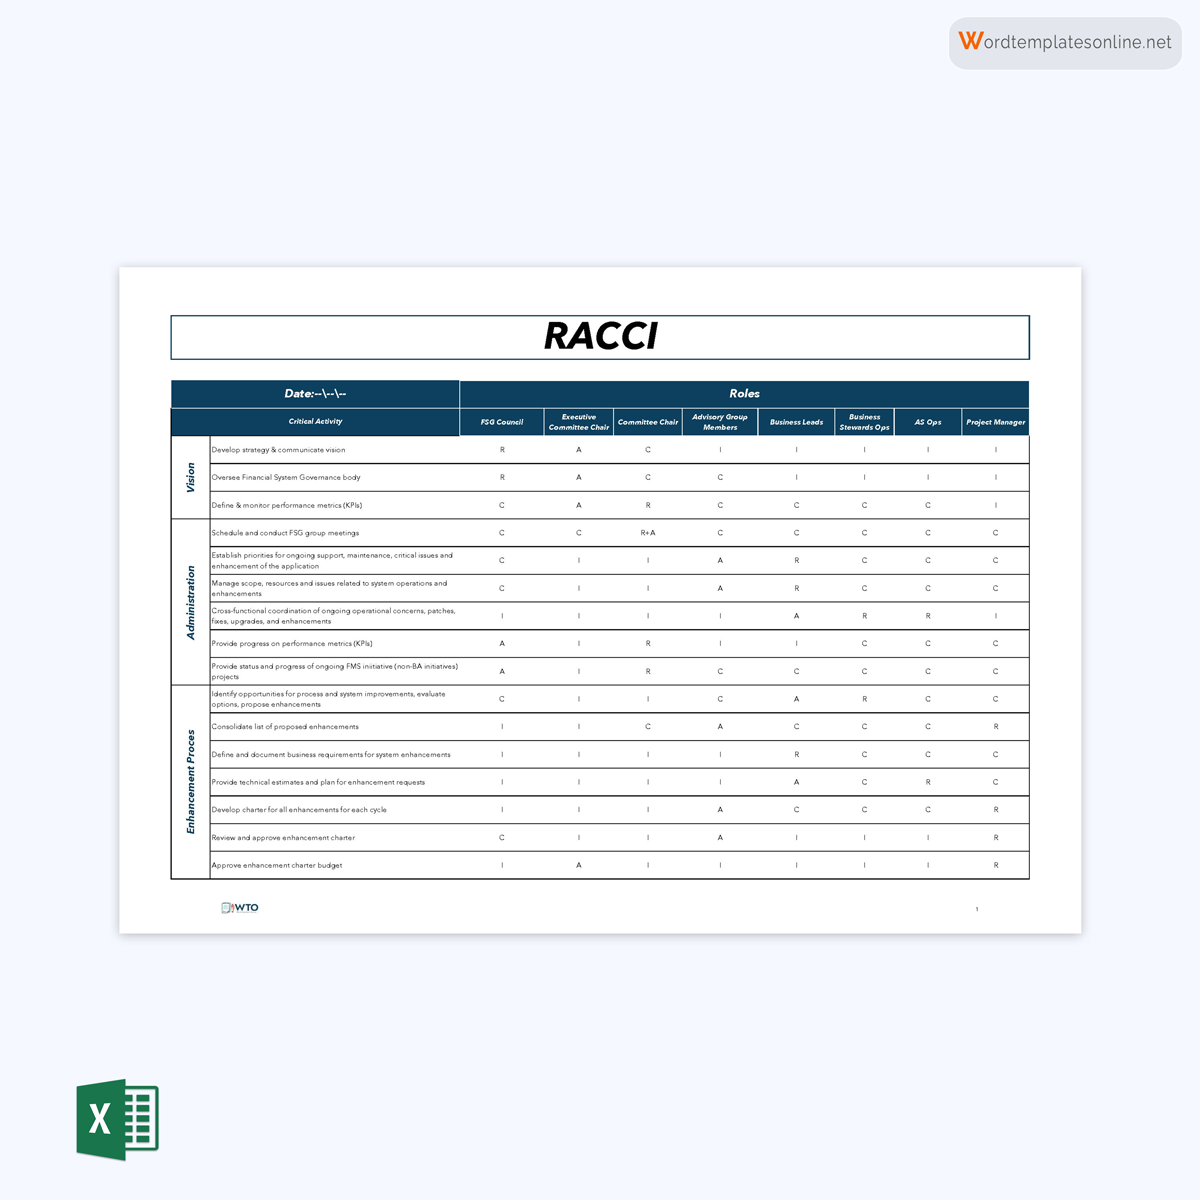
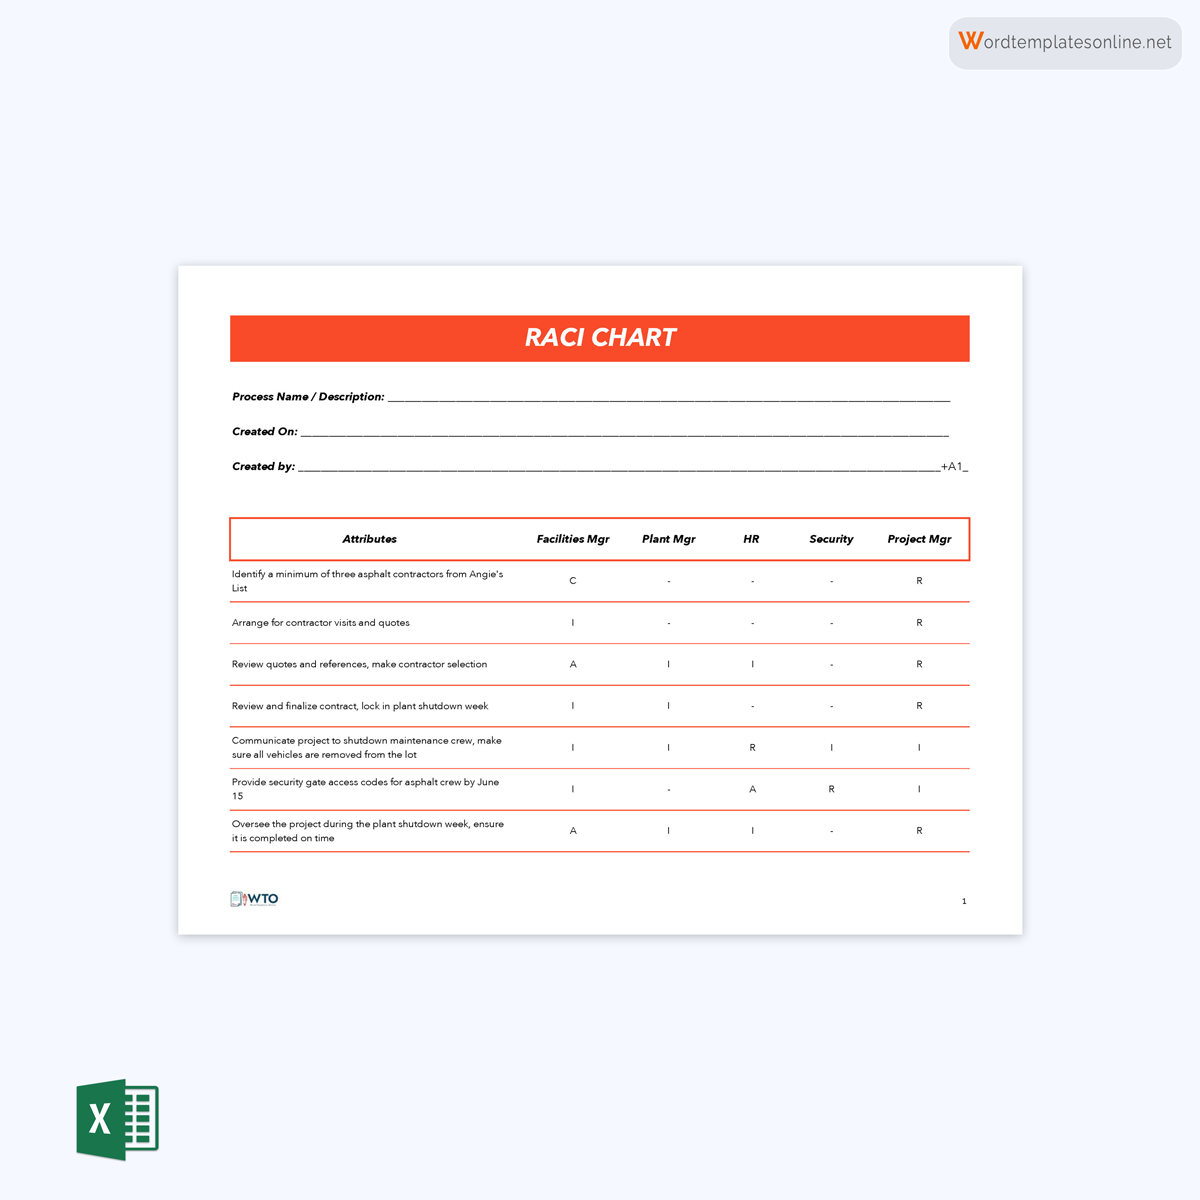
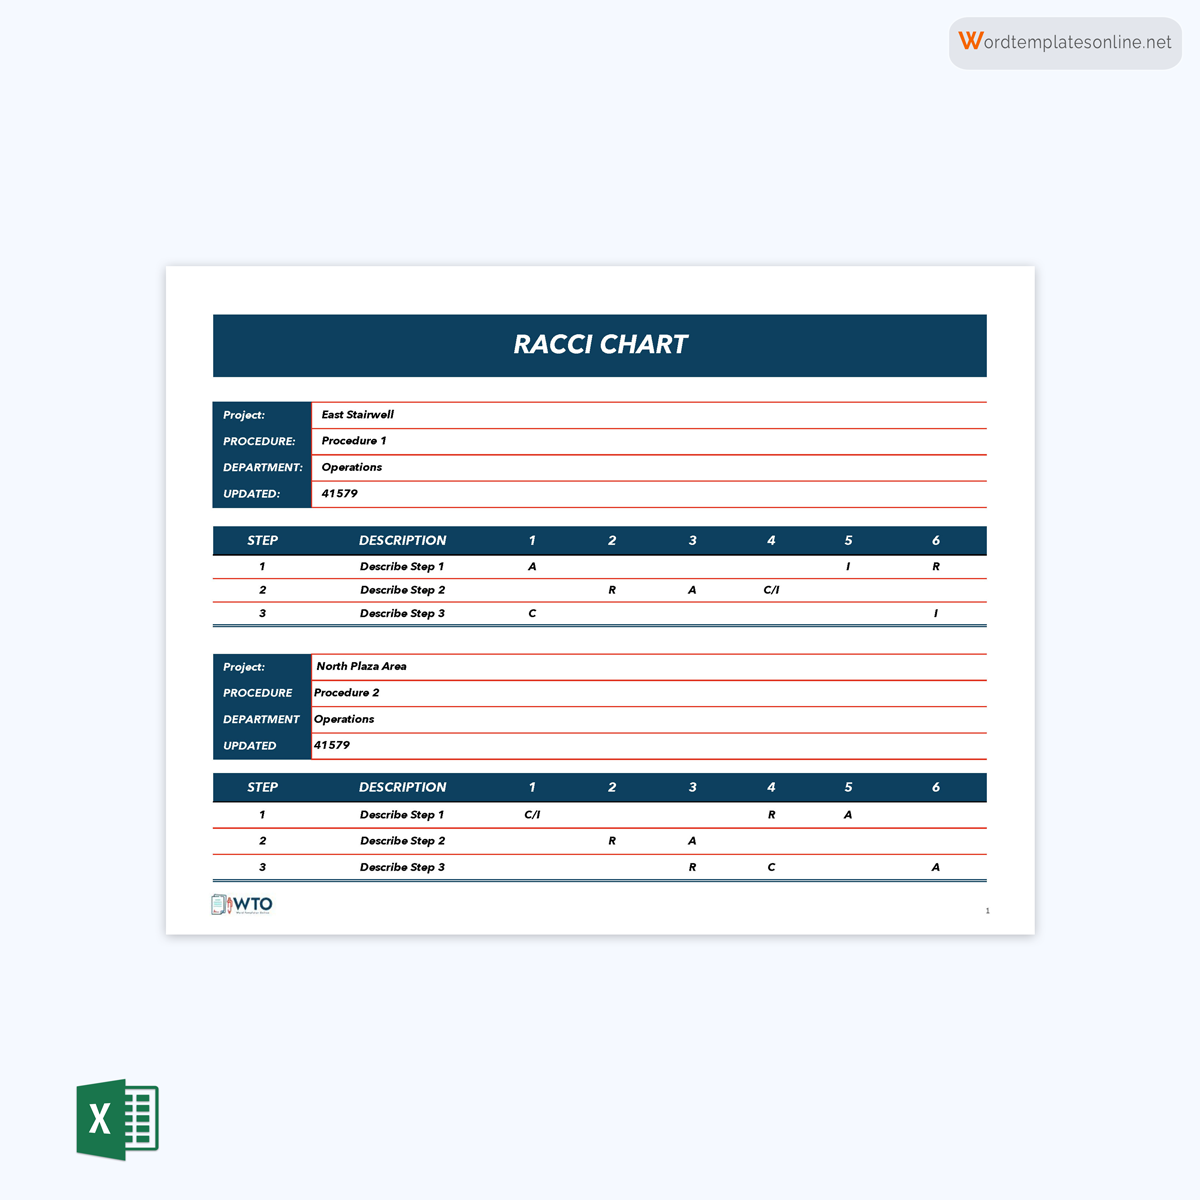
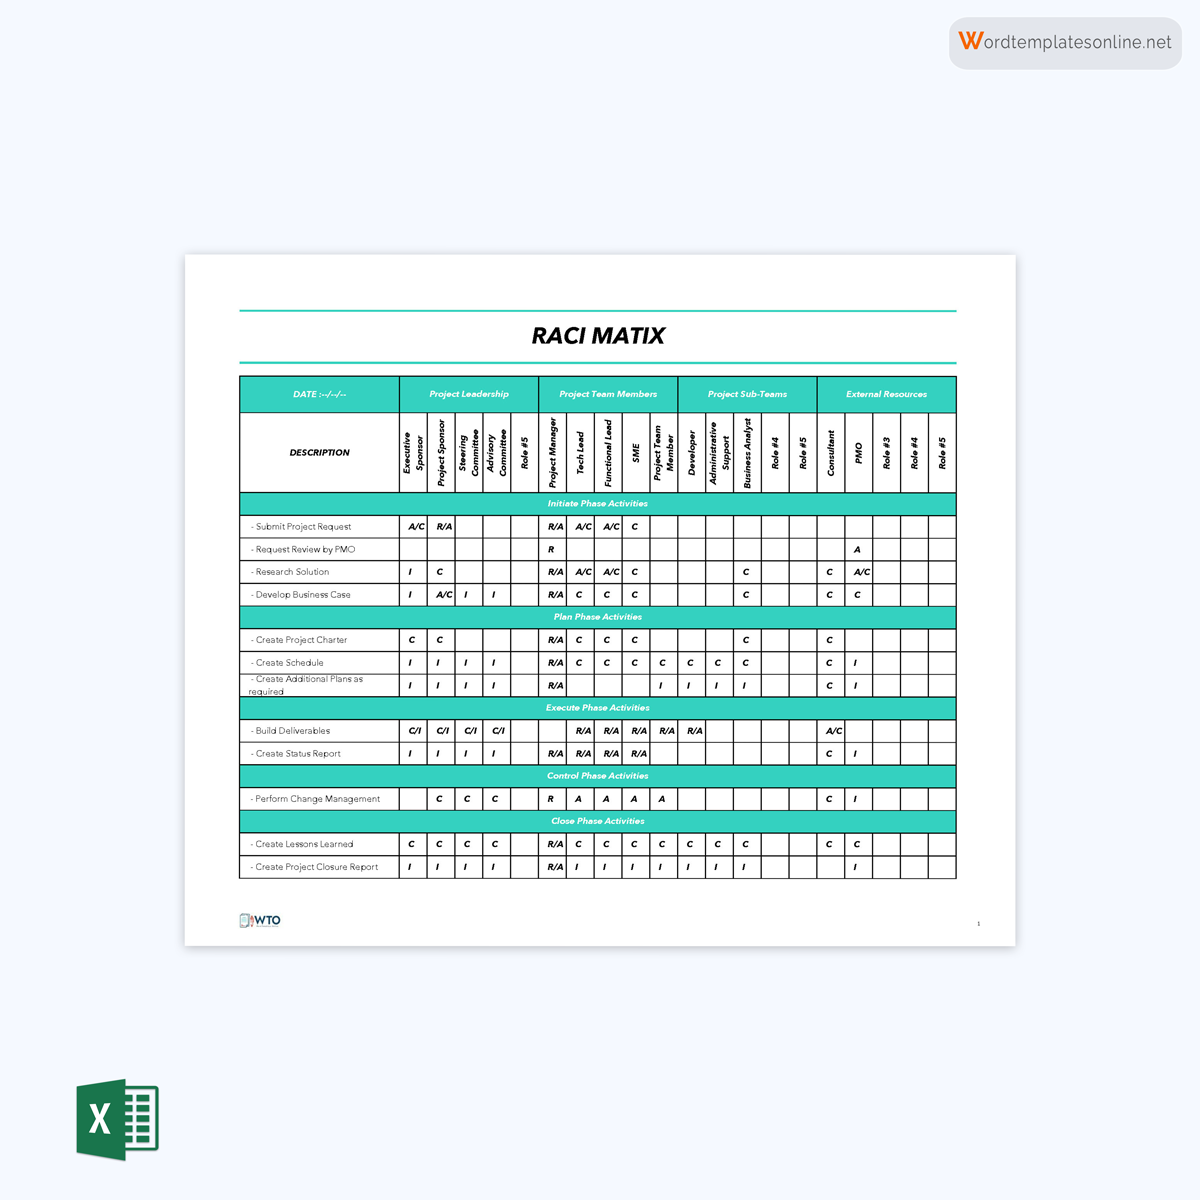
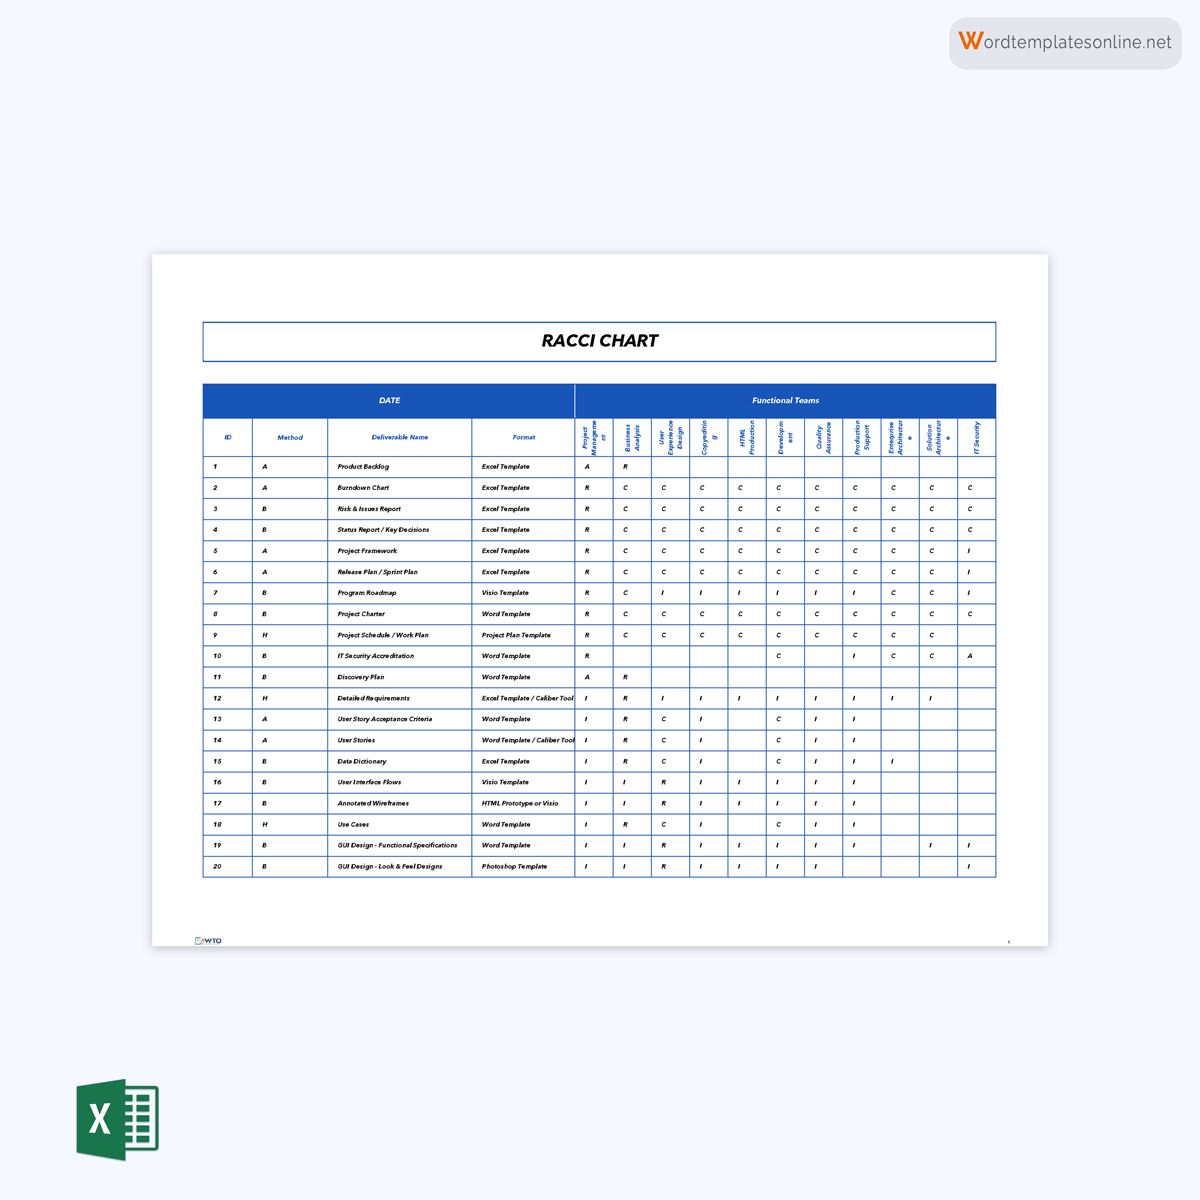
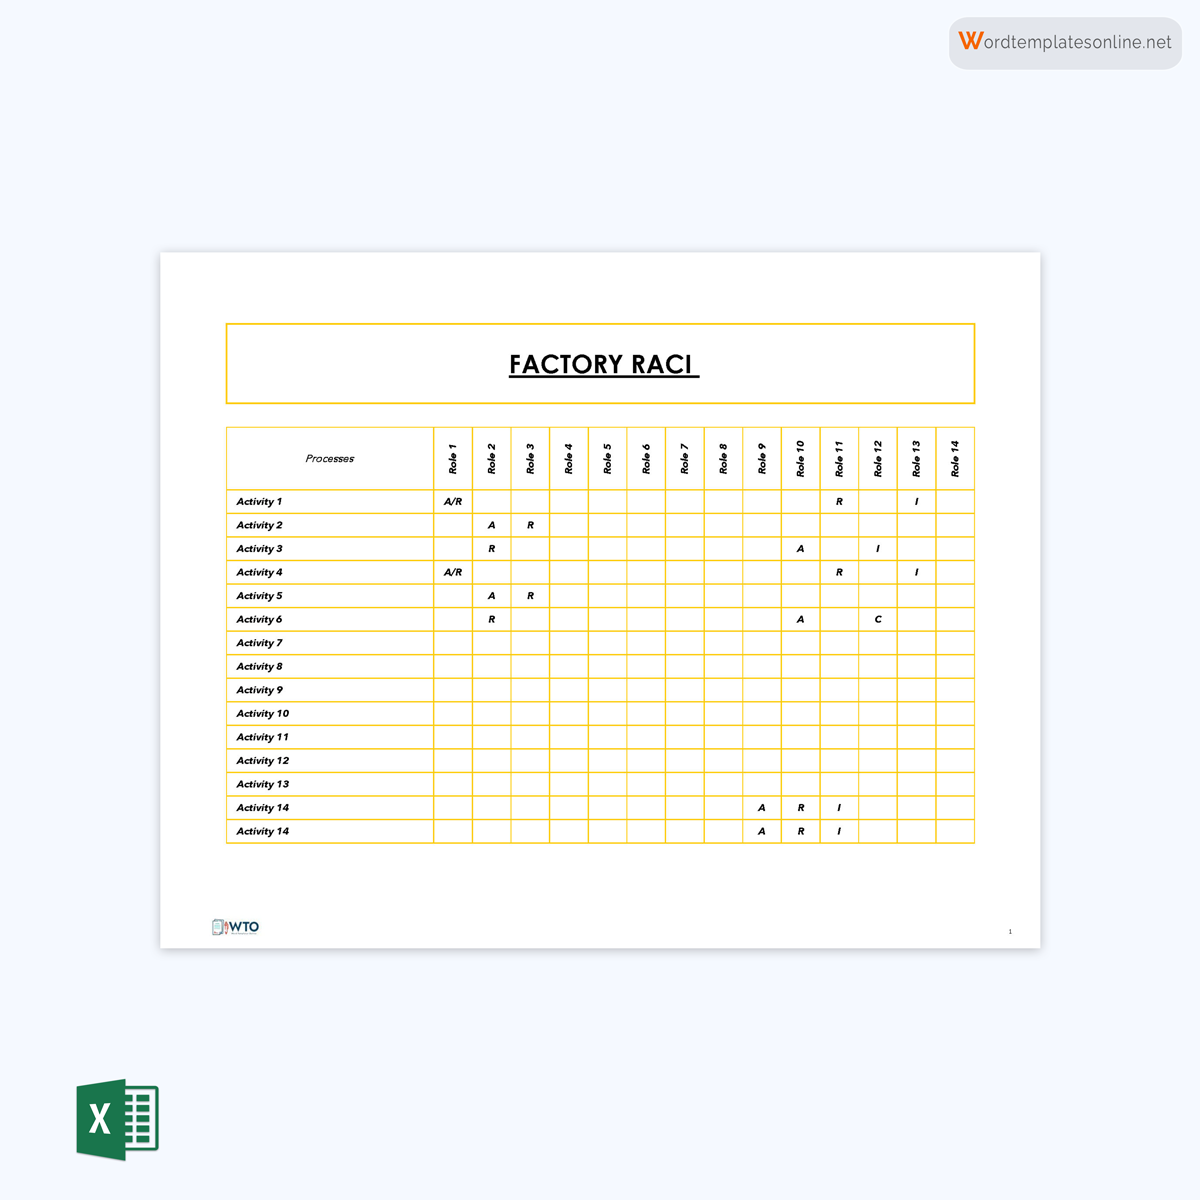
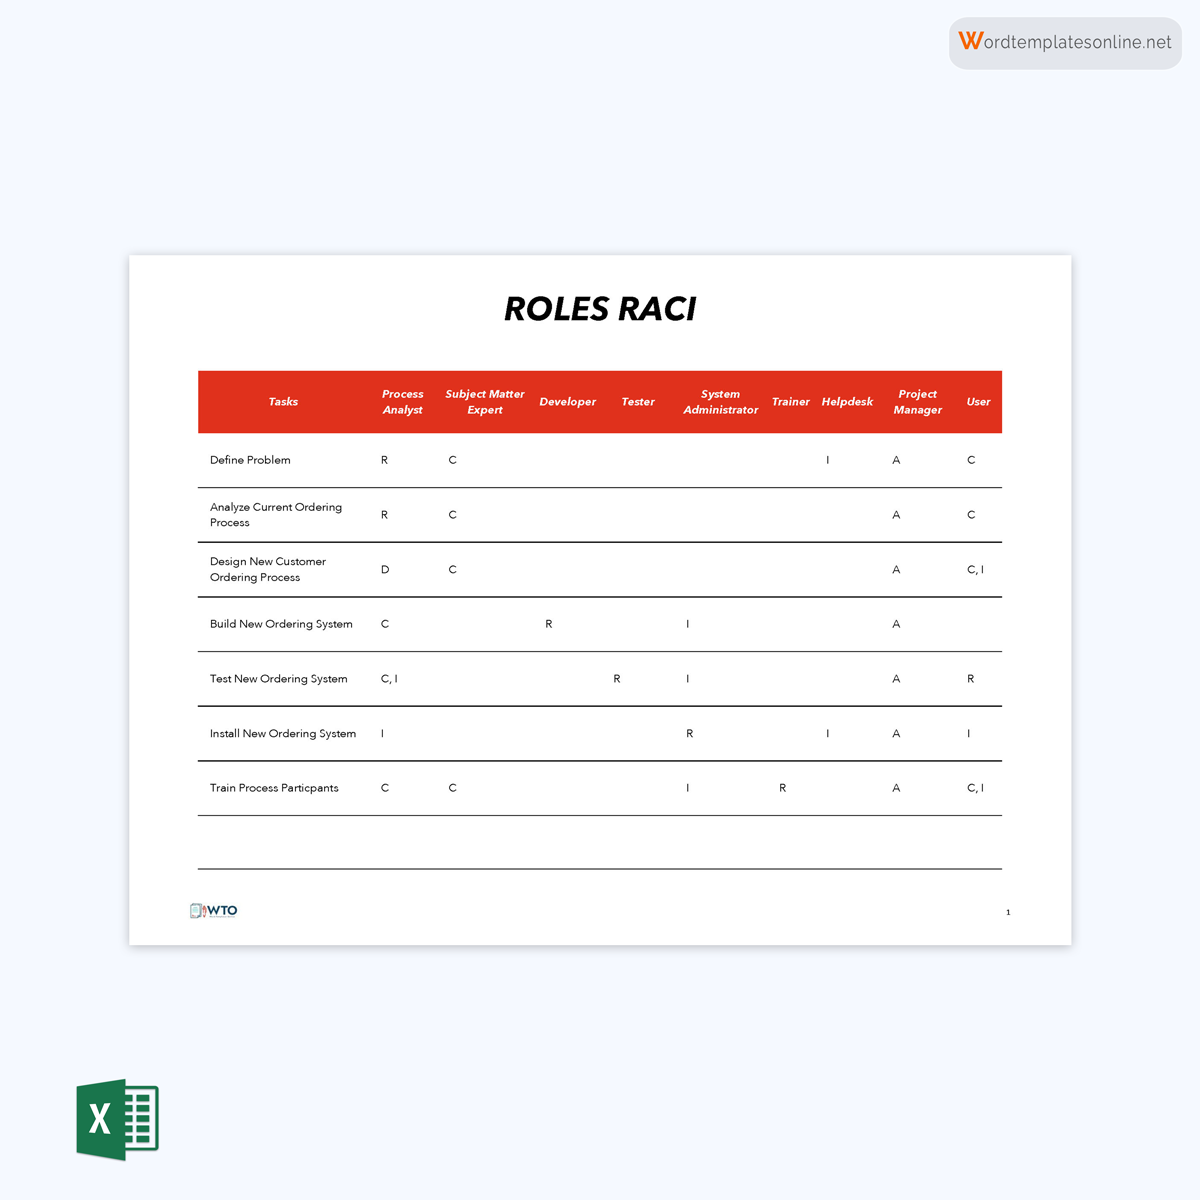
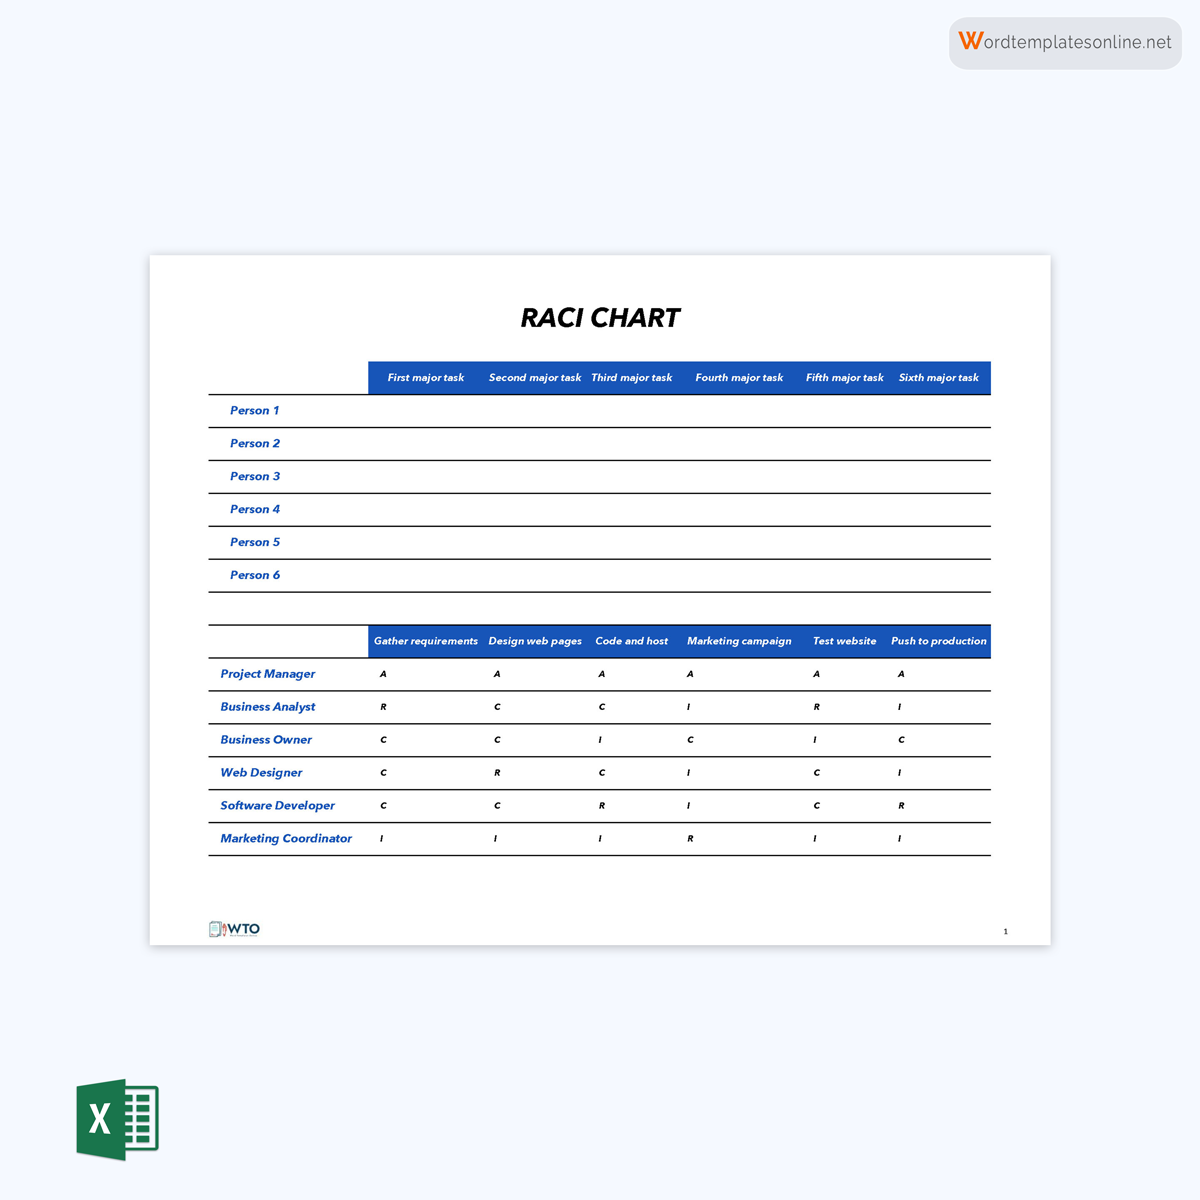
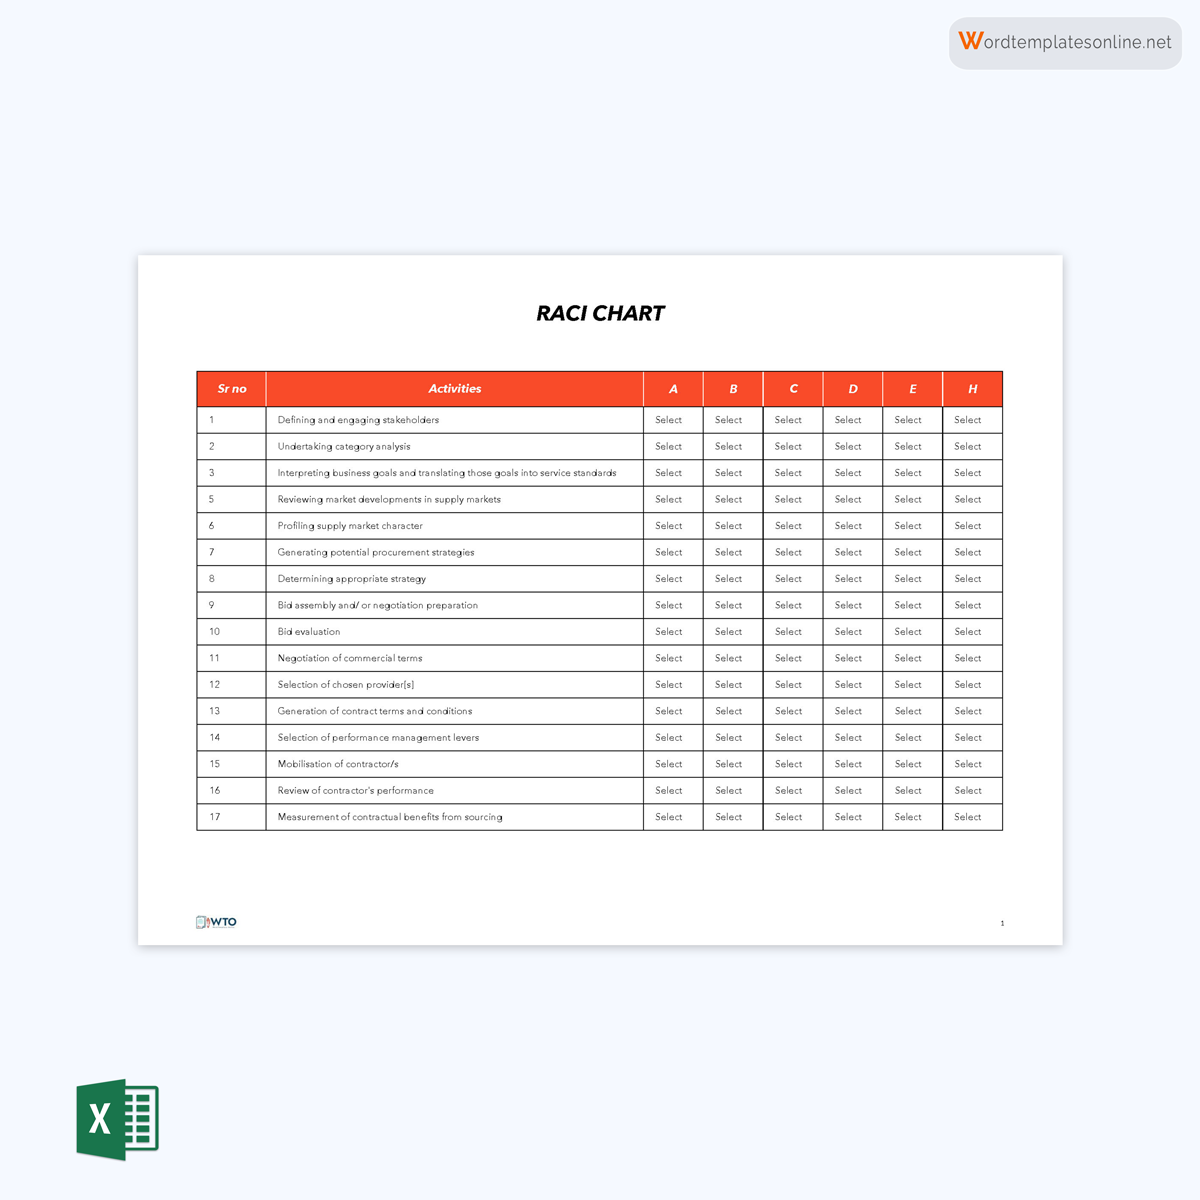
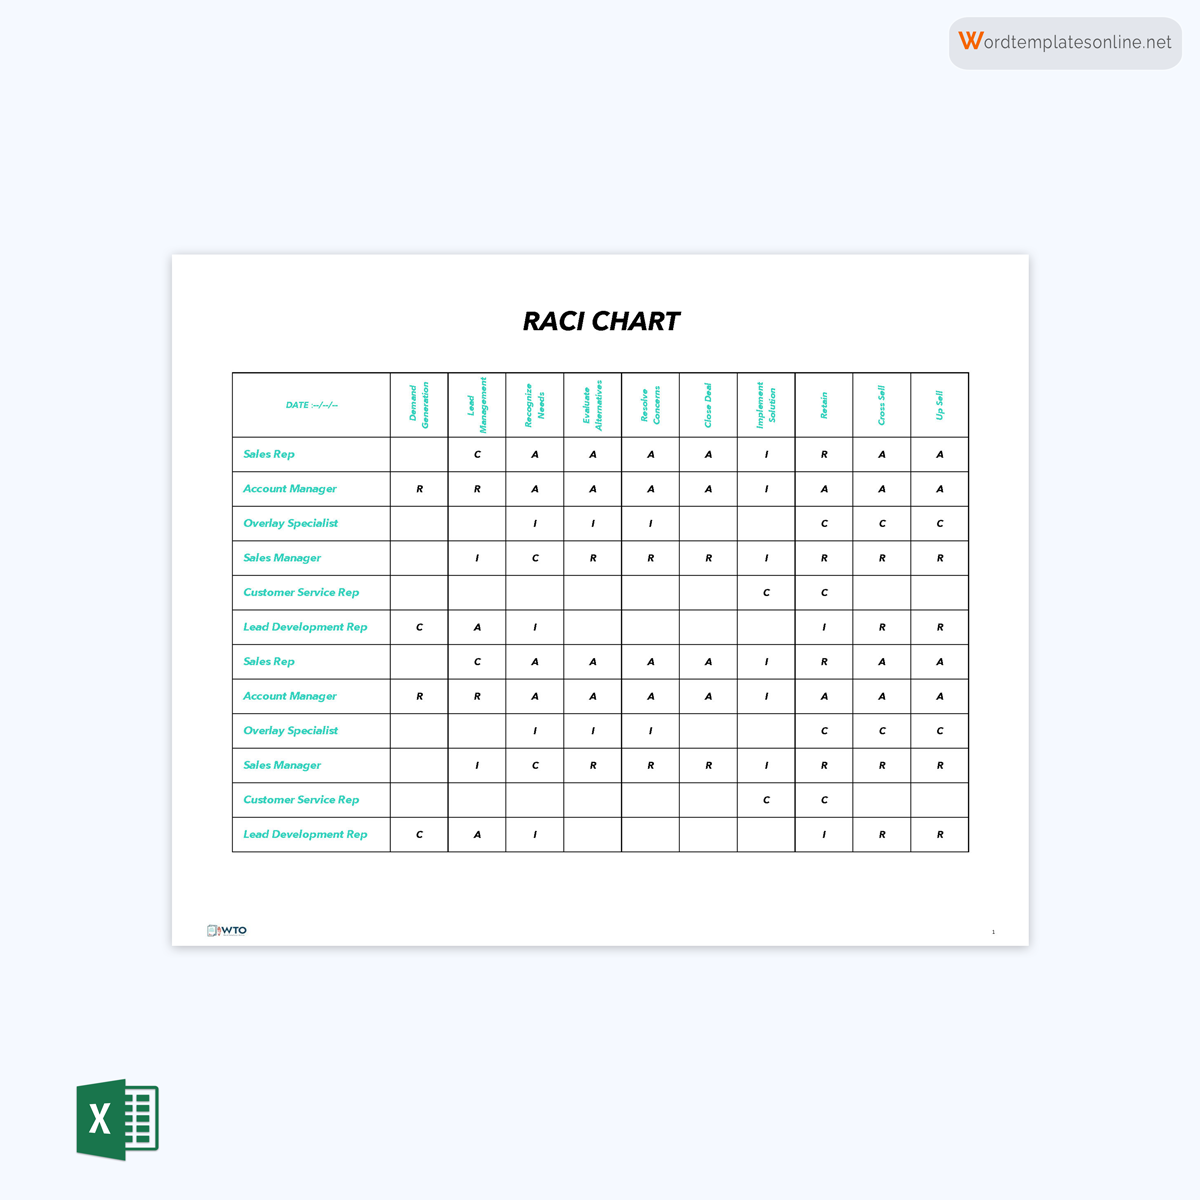
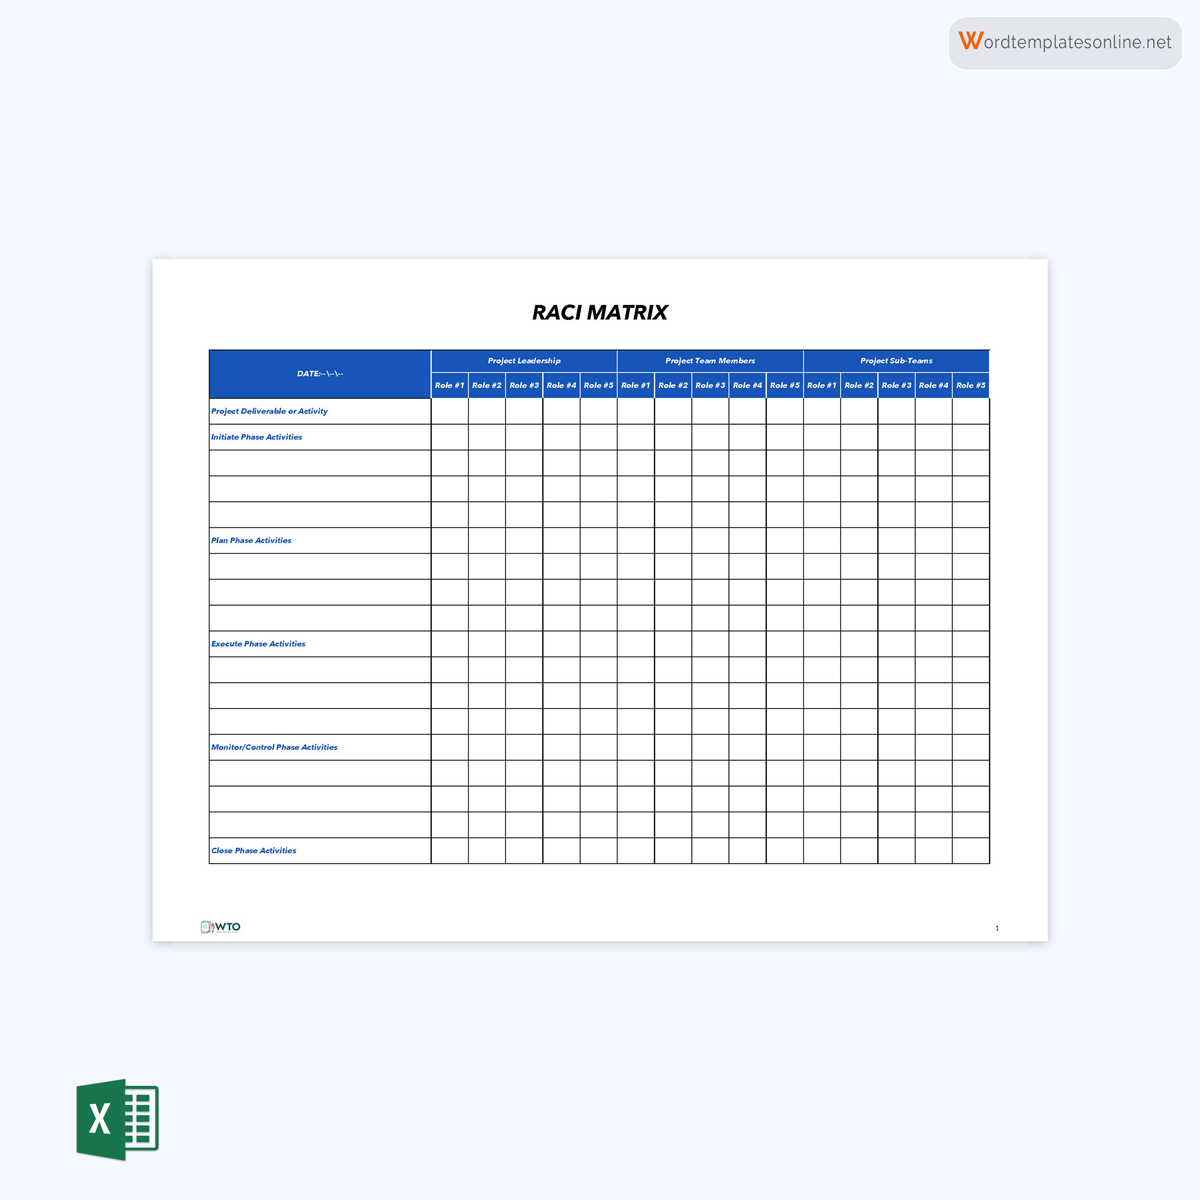
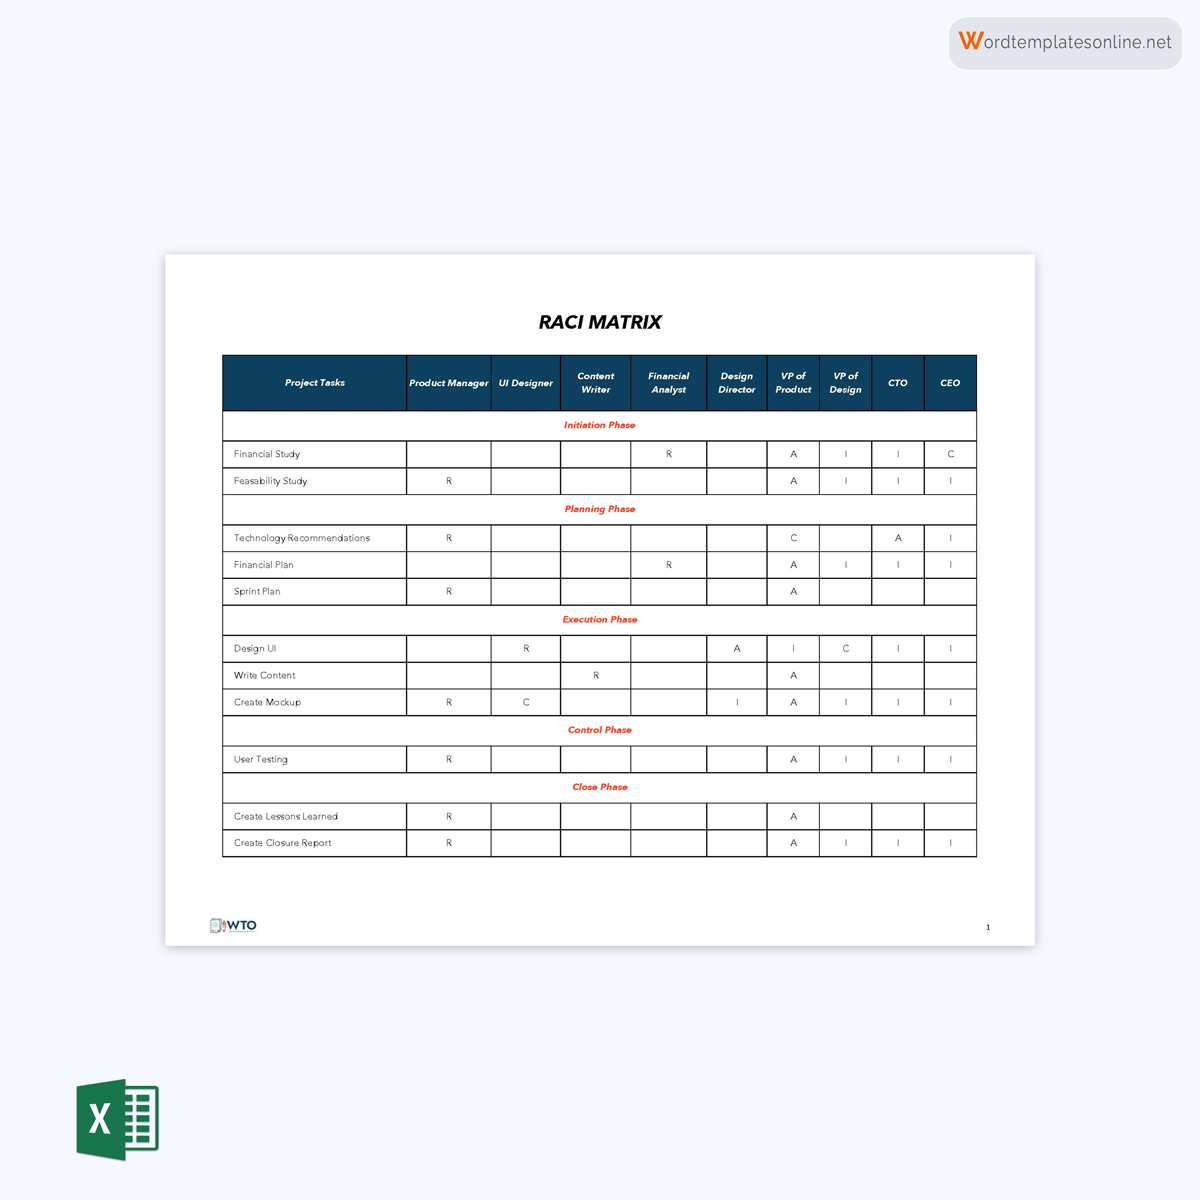
What Does the Acronym Stand For?
The chart derives its name from the different duties each team member can have based on their assigned role. A team member can be responsible (R), accountable (A), consulted (C), or informed (I) about a task or deliverable.
Explaining the terms
Each role represents a different level of involvement in the associated task or deliverable. Therefore, each role is distinctively different as follows:
- Responsible – R: This duty is assigned to the team member or members who are supposed to do the work required to complete the project task or deliverable. They are directly in charge of completing the task. It is advisable to have one member take up the responsibility of completing a task. This is so that they can be the point person in case of any questions or updates regarding the specific task. However, you can assign several members responsible for a single task or deliverable if necessary.
- Accountable – A: This role implies that the team member shall be held accountable for ensuring the task is completed, or the deliverable is delivered. Typically, they will not be directly involved in the task but will delegate and oversee its execution. This role will involve communicating stakeholders’ expectations to the responsible member(s), approving the final work, etc. The team members assigned this role will typically be part of the project’s leadership/management. This role should be assigned to one team member rather than several.
- Consulted – C: This role is for team members who offer input/advice or feedback on the tasks undertaken. They will typically review the deliverable as the outcome may affect their current or future work. They are consulted on most issues and will have input on how the project task should be carried out, for example, a subject matter expert. Consulted parties also include team members or individuals outside the team whose work depends on the deliverables from the particular team. This role is vital as they will have insight and input regarding the project deliverables. To carry out their functions, members assigned this role require communication with the responsible members. Persons in this role will be consulted before a task begins, throughout the work, and after completion.
- Informed – I: Persons assigned to this role are individuals who are aware or informed about what a task entails and the work needed to complete it. They will have no input or decision-making duties regarding the work. However, they must be updated on the progress as the outcomes may impact their work. Often, the informed parties will be in different departments. Examples of such roles are senior leaders or heads of affected teams.
Alternatives names for RACI
Other names used to refer to the RACI chart include;
- RACI matrix
- Responsibility assignment matrix
- RACI diagram
When Should the RACI Chart be Used?
As much as this chart is helpful in project management, it may not be viable and effective in every situation.
Some of the instances where this chart would be useful include the following:
- The chart is beneficial in cases where utilising the chart as early as possible in the project’s life cycle is ideal. Using the chart ensures that all the roles assigned to the team members are defined and clarified from the start before work begins.
- The chart is suitable for projects that involve collaboration between different teams.
- Also, knowing who is responsible, accountable, consulted, or informed about tasks is greatly important when a project has a lot of task dependencies.
- A RACI chart is suitable for projects where many decisions must be made constantly. This is because, with the chart, the roles are clearly defined; thus, it is easy to determine who is responsible for making decisions at any point within the project execution.
- The chart is helpful when onboarding new members to the team. Because it provides a simplified guide on how roles and responsibilities are shared within the team. Consequently, this expedites onboarding and helps the new members understand their roles.
tip
The RACI chart can be used with agile project management. However, there is ambiguity about whether the chart is necessary for such a project management style. In addition, such charts are known to facilitate communication between the team and stakeholders. Thus combining the chart with the Scrum and Scrumban methodology seems redundant as they facilitate regular communication. However, in some projects combining the two may prove beneficial for additional communication and clarification of roles and responsibilities.
How to Create a RACI Chart?
The need for a well-crafted chart cannot be overstated. The steps involved in the preparation of this chart are straightforward.
Here is a simplified guide to creating the chart for any project:
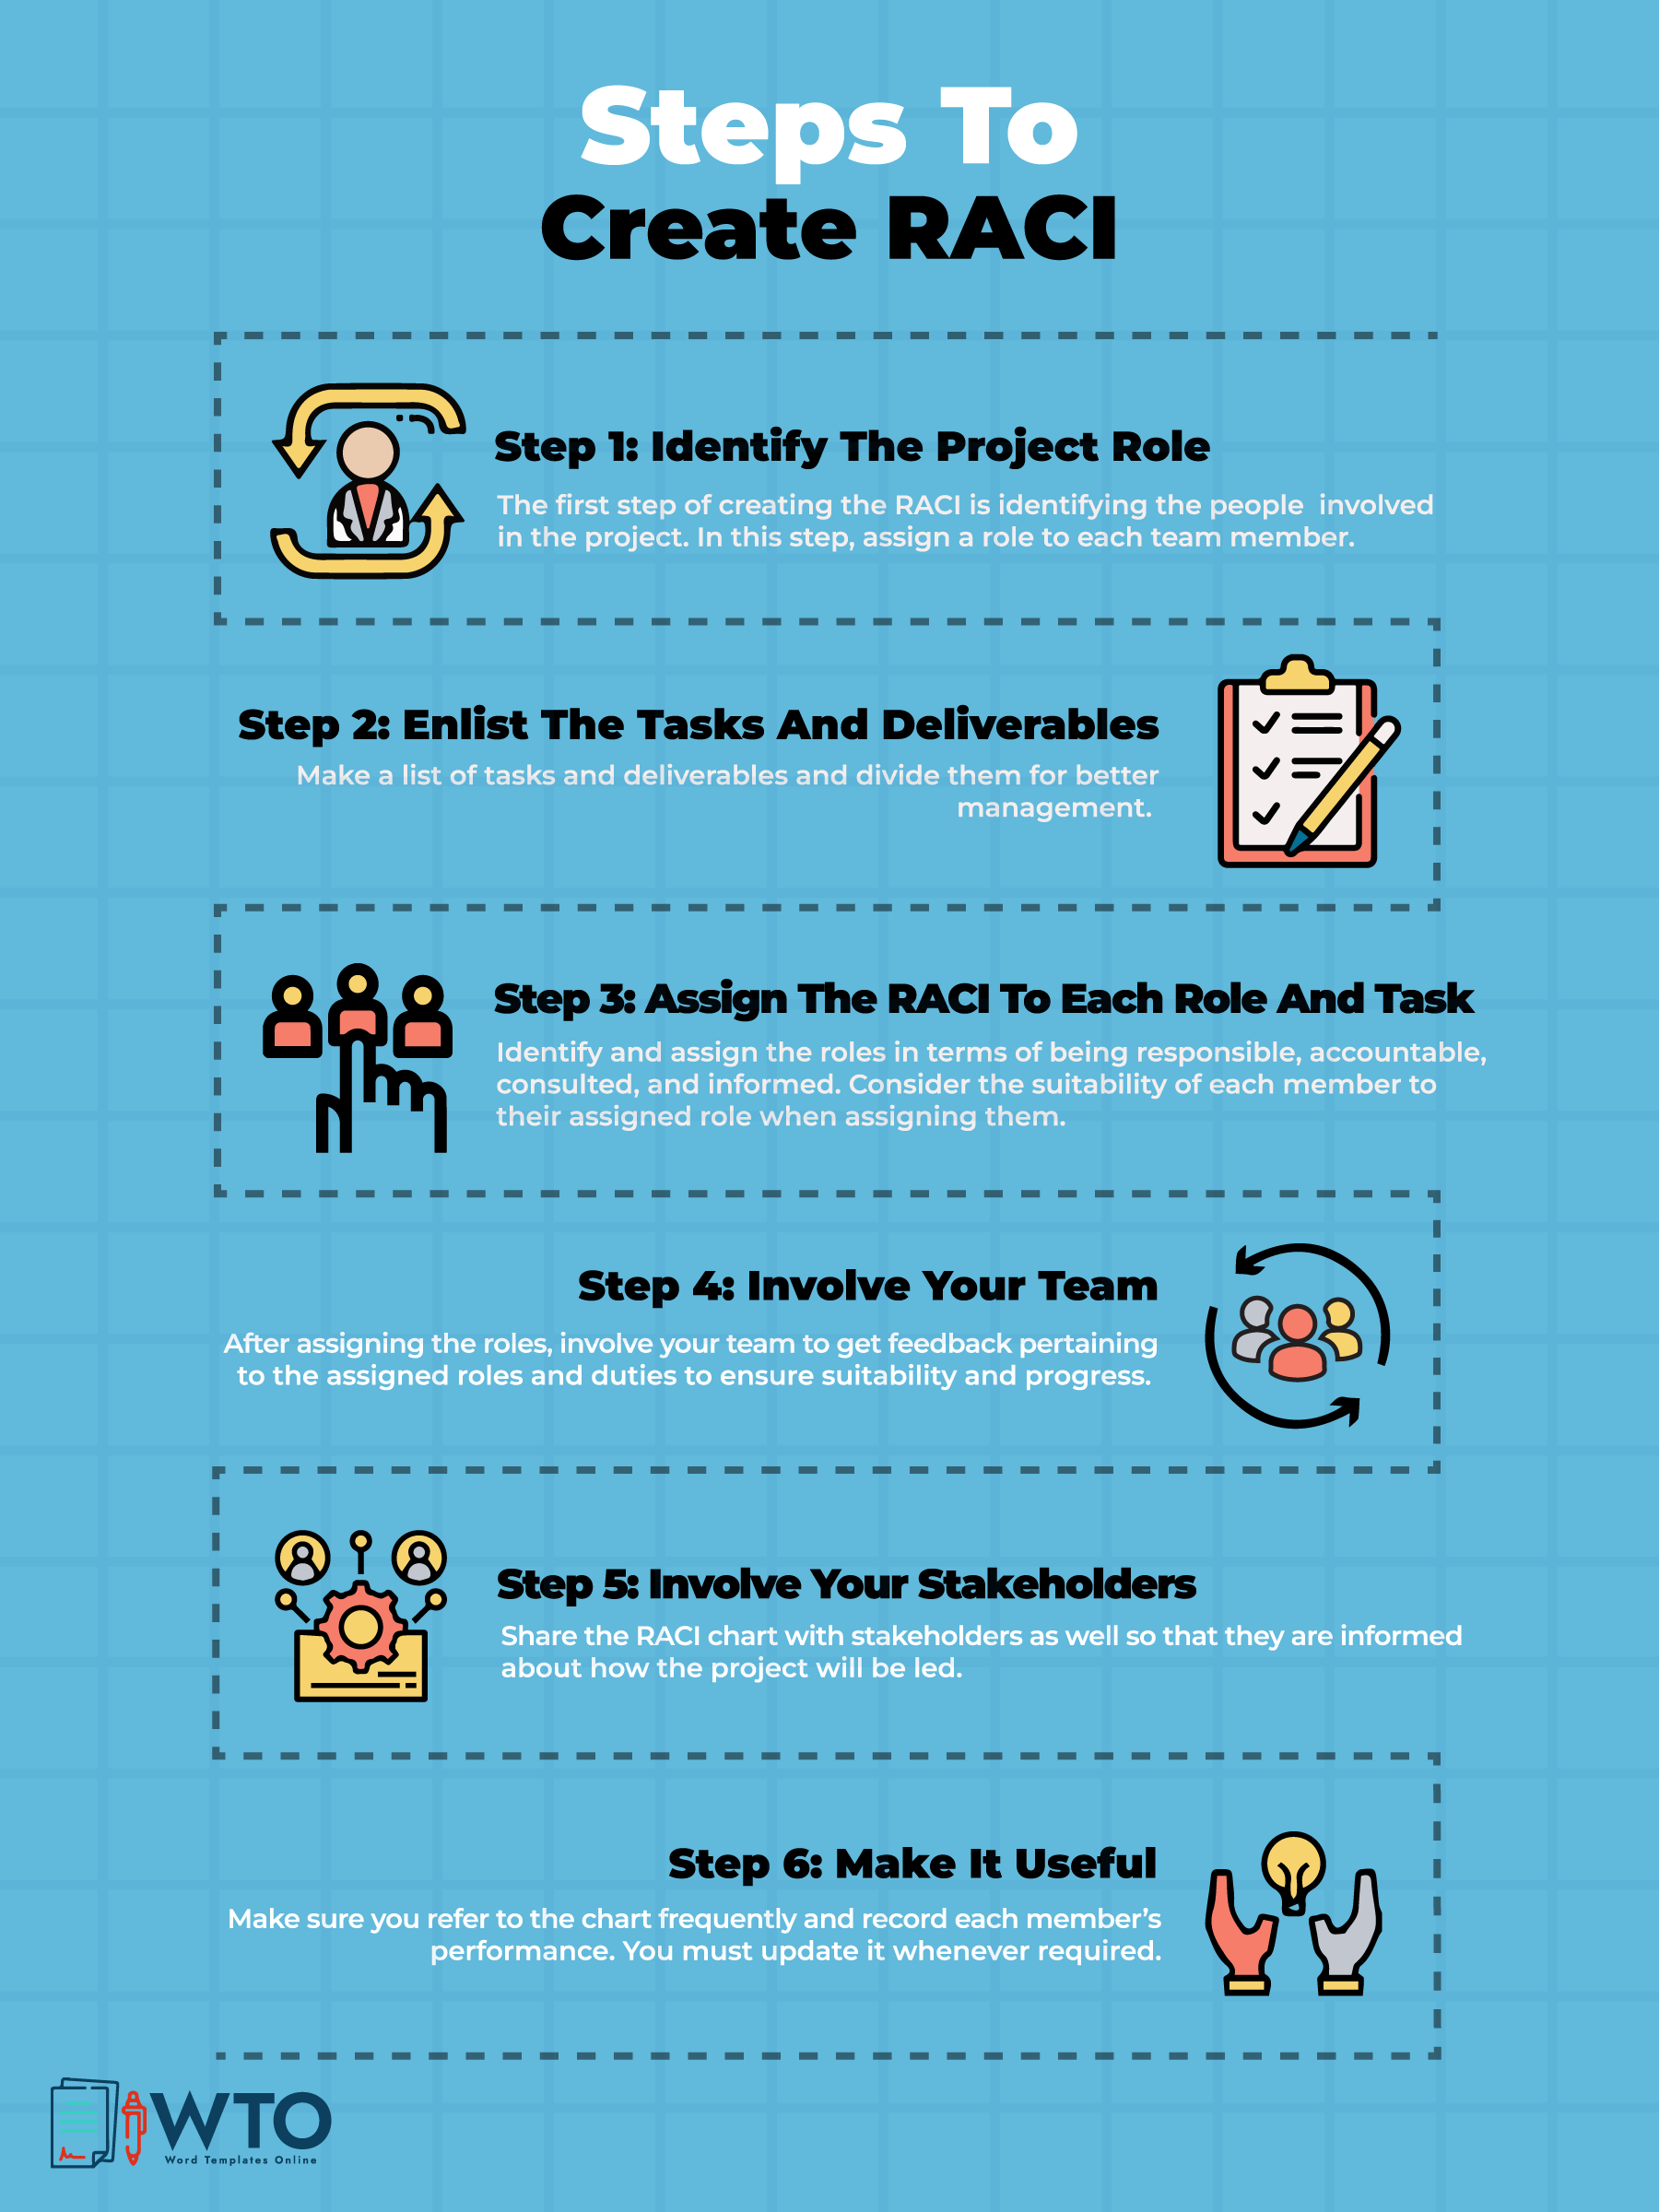
Step 1: Identify the project role
The first step in creating a RACI chart is to identify who will be assigned the various roles in the project. Their names should be enlisted – each name in its column. Alternatively, you can opt to enlist the job titles associated with the people instead of their specific names. The allocation should be based on individual knowledge, skills, and experience relevant to the roles performed. Each alternative is used for different reasons.
You can specify the role/job title if one oversees multiple roles. It prevents mixing up names of broader groups such as managers, consultants, etc., which can apply to different team members.
Enlisting the team member’s name is used as it is more straightforward and specific on who is being referred to. It is ideal for a situation where multiple team members are undertaking similar roles. For example, when two data analysts are in the same project team.
Step 2: Enlist the tasks and deliverables
The second step is to list the tasks and deliverables to be undertaken. This involves brainstorming the tasks that must be completed to achieve the project’s objectives. Each task is listed on a separate line. When identifying the tasks and deliverables, you must avoid focusing on minute ones, as this may lead to a complex and crowded chart.
Step 3: Assign the RACI to each role and task
Next, assign each team member their associated level of involvement in each task. This can be done by specifying who is responsible (or accountable), consulted, and informed of each task. Usually, there will be one or more tasks per role, so you must allocate the tasks accordingly. Always ensure that only one member or role is accountable for a task or deliverable. Also, specify who will be informed when a task is complete.
Step 4: Involve your team
Once you complete the chart, have each team member review the chart. They should verify their associated duties and confirm if they agree with the roles assigned. Then, ensure everyone is familiar and satisfied with their role, which can influence their motivation to undertake their duties. Also, inform everyone of any assumptions you have made in the designation of roles to ensure everyone is on the same ground.
Step 5: Involve your stakeholders
The stakeholders are usually senior leaders and those interested in the project outcome. You should inform them of their assignments, associated roles, and responsibilities. This can be done via meeting or call. It would be best to keep the phone call or meeting brief to avoid receiving overwhelming feedback and lengthy discussions. Also, identify who should be informed once an agreement has been agreed to.
Step 6: Make it useful
Once all steps mentioned above have been completed, you have successfully created a RACI chart. Your next step would be to ensure that your team can easily access and use the chart. You can do this by providing an online version of the chart. The online version can be offered through Google Docs, Confluence, or any project management software used in the project. This will ensure that the chart is readily available and used by all.
Also, you can refer to the chart whenever a task or deliverable is initiated to ascertain who is responsible for which task or deliverable.
Also, ensure the duties and responsibilities assigned at the beginning of the project are still being undertaken as designated. Lastly, you must refer to the chart after project completion and determine how useful it was. Confirm if the roles and responsibilities were successfully fulfilled, whether the right people were involved, and whether the project was short-staffed or over-staffed.
Consider the Tips During RACI Chart Creation
The chart used should be effective and unique to the specific project it is meant for. This requires thorough attention to detail when preparing the chart.
The following tips will assist you in creating a helpful RACI chart:
- Before creating one, think through how the chart will be used and why it is essential to the project.
- Allocate the “Accountable” role to a single member and not a group of people. Having one person accountable for a task or deliverable eliminates confusion over who should make decisions and answer questions regarding the task or deliverable.
- You must make sure you have a clear understanding of the RACI chart’s terms. You can have the definitions of the terms readily available as you prepare the chart.
- Not everyone should be informed about each project task or deliverable. Typically, this role is assigned to those impacted by the task or deliverable or who have a specific interest in the outcome of the project task.
- You can engage the team members and project stakeholders when creating the chart.
Pros and Cons of RACI
There are various pros and cons of these charts that one should consider before creating one. They include:
Pros
- The chart helps you promote cohesiveness in the team when completing each task. Consequently, everyone produces the best results possible in their rightful capacity.
- The chart clarifies expectations and decision-making concerning the project as the duties of each role or team member are clearly outlined.
- Also, the chart helps the project manager ensure that only the right people offer input on the task.
- Using the chart prevents overwhelming certain team members with work that can be redistributed.
- The chart reduces confusion over who is in charge of which task, thus speeding up task completion.
- With a RACI chart, stakeholders are prepared on how the project deliverables will impact their work.
- The chart also helps team members understand each other’s roles and responsibilities, thus encouraging collaboration.
- Lastly, it ensures that no two people are working on the same task and resources are not directed towards one deliverable at the expense of another.
Cons
- The RACI chart does not indicate the stakeholder’s level of involvement with the overall project as it focuses on the granular level of involvement.
- Also, the chart does not outline each project task in an effort not to make it too complex. Therefore, some tasks may be overlooked.
- The chart can be disadvantageous as any changes to the project can make it outdated as it cannot adapt quickly to project needs in real-time. In addition, this makes it difficult to track how far the tasks have reached in real-time.
- With the chart, the roles are rigid, which may not represent a person’s involvement in the project.
- The chart may be difficult to interpret, especially for those stakeholders who cannot differentiate the terms.
- Lastly, the chart may be difficult to comprehend for large teams. This can ultimately lead to confusion.
Alternative Methods to RACI
Other methods of allocating project responsibilities can be considered alternatives to RACI charts.
The following are the most common methods:
RASCI
This variation of the RACI chart follows the same sequence of assigning roles but incorporates an additional supportive role between accountable and consulted. The supportive role represents the team member(s) assigned to offer support/assistance to the person responsible for the task. This role entails actively participating in completing the task compared to “consulted,” where the person being consulted gives information, advice, or feedback only.
CARS
CARS is abbreviated from the following terms – Communicate, Approve, Responsible, and Support.
The roles are defined as follows:
- Communicate implies consulting and informing roles,
- Approve implies the decision-making role,
- Responsible refers to the team member doing the actual work
- Support implies the team member(s) supporting the person responsible for the task.
CARS is more specific to the actions taken by the assigned member than the chart.
RAS
This variation retains a CARS model’s three roles – Responsible, Approve and Support –. It is simple and direct but does not specify the owner of the task, which can lead to confusion.
DACI
The DACI variation is more action based than the RACI chart. It redefines the term responsible as Drivers and Accountable as Approvers but retains the other terms (consulted and informed.)
CLAM
This alternative introduces the terms Contributes, Leads, Approves, and Monitors to formulate CLAM. It is also more action-based than RACI.
Wrapping Up
RACI charts are one of the most popular and widely used processes for allocating roles to project team members. The chart can be used as a guide to help the team members understand their roles and how they are expected to complete their tasks. The chart tends to be rigid, thus hindering its flexibility and adaptability – qualities that would be necessary if unprecedented changes occur. However, alternative tools offer more flexibility while clarifying project expectations and decision-making among team members. Such a chart is easy to comprehend and does not require much effort to create. This is because templates can be used to simplify chart preparation. As a result, the chart is a popular management tool among project managers.


