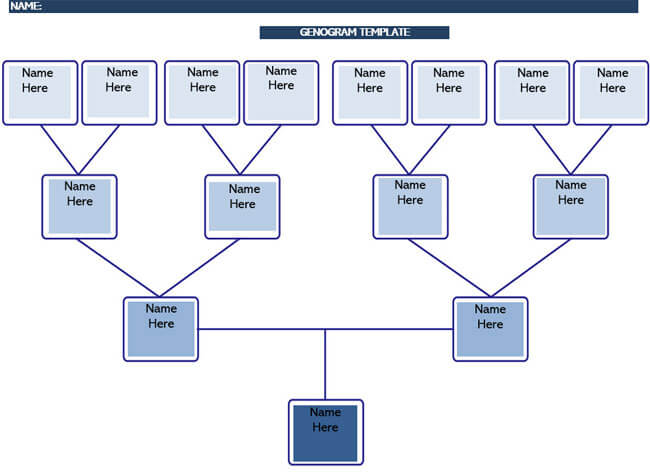
A genogram template is a tool that enables you to visually present data about someone’s family.
It looks like a family tree, but it focuses on more specific aspects of family ties and has a much more technical appearance.
What is Genogram?
Genogram is a graphic representation of the necessary information for at least three generations of a family.
It includes information about its structure, the medical histories of the members, and the relationships among them. It is used to collect and organize information about a person’s immediate background. This information serves as an input for clinical or educational intervention. However, anyone can do their genogram to get to know themselves better. It is instrumental in finding patterns of hereditary diseases, inter or intra-generational conflicts, and psychological factors.
A template allows you to easily visualize the family structure of a person. In many cases, it will enable the development of a hypothesis about the causes of a particular personality problem, like managing emotions. Likewise, they are valuable instruments for increasing knowledge about an individual.
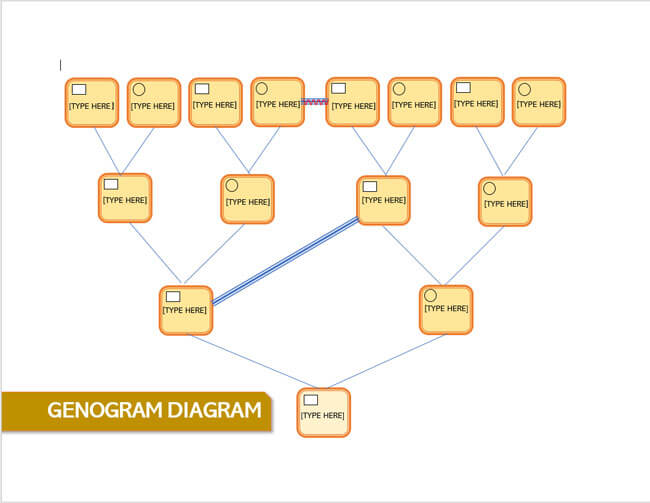
Free Genogram Templates
Constructing a genogram requires not only research but also a lot of technical skills, which can make it a hectic task. Download our free templates to create dynamic and simple genograms.
What Does a Genogram Show?
What the genogram presents to us is, in fact, the effort of successful or unsuccessful adaptation of the members of this system to their context of life. It shows us that if one part is afflicted, it influences the rest. Furthermore, the person’s place in this family tree influences the relationships and behaviors of the next generation.
What is most significant is that it allows the members of a family to see themselves in a broader context, including the past and present, and to reframe emotionally charged behaviors by seeing them from new perspectives. This distancing makes it possible to understand the family responses that have been the source or reinforcing element of the family’s behaviors.
By highlighting and linking the problematic patterns in previous generations, we can see them across the whole family. Indeed, families transfer these problematic behaviors through generations.
EXAMPLE
The age of onset of the cause of violent death or the type of dependency on alcohol, drugs, or gambling can be traced to previous generations.
Also, not only are the problems similar but they are also approached in the same way across generations, such as by repeating flawed solutions.
The solutions to life’s difficulties are thus also passed down from generation to generation; in the event of difficulty, the current family will follow the same path, with all the risks of dysfunction, somatic problems of all kinds, and disunity that this entails.
When one or more family members learn about these patterns through the genogram, it allows them to prevent the worst. They can talk about it and resort to mediation to avoid dead ends in relationships and “family breakdown,” which doom them to repeating the same scenarios from one generation to the next.
Its analysis can help them overcome conflicts, lawsuits, divorce, internment in psychiatry, imprisonment, unemployment, alcoholism, drugs, hypochondria, adulterous birth, incest, promiscuity, violent death, premature death of children, and murders.
The template thus offers us important insights for identifying and understanding the nature of these impasses and for helping people react, reorganize their lives and relationships, and correct some of their behaviors.
Steps to Develop Genogram
A template is made in three main steps, which are as follows:
- The general arrangement of the family structure;
- Collecting necessary information about a person’s family;
- Overview of family relationships.
The layout of the familiar structure is the initial phase and also the most important. It serves as an axis for the whole template. At this stage, it is necessary to define the biological and relational links between the family members. There is a set of predefined symbols to represent these links graphically.
In the register of family information, the following information is entered:
- Demographic information such as dates of birth and death, education level, dates of marriage, and divorce;
- Information on the members’ level of functioning, including whether they are functioning or not, how much they are functioning, and why;
- Critical family events.
In the third step, we trace family relationships. Here again, the links between one and the other members are established, but in this case, a psychological link is seen rather than a biological or legal one.
Step-By-Step Guide for Creating Genogram Template
To develop a template from start to finish, you need to take the following steps:
Define the purpose of the genogram
The first thing is to define the purpose of it. Obviously, in any case, it provides information about a person’s history and family environment. However, this information can be used for different purposes.
Sometimes the data obtained is beneficial for medical purposes. Family history is also a genetic history and helps visualize inherited physical strengths and weaknesses. Simultaneously, the genogram provides valuable information about emotional issues that recur or are common in the same family. These are psychological patterns that are present in the family environment.
It is also true that the genogram has a particular purpose. It suits you perfectly to ask yourself: What is the reason for depression in this individual? Is it possible to trace a specific condition through different generations? The important thing is always to set a goal.
Define the number of generations to analyze
It is essential to view the work realistically. Ideally, three generations should be taken as a basis, but this is not always possible. There are families in which a whole generation has already disappeared, or there is no contact with the members of it.
In other cases, the contact you have with different generations is indirect. It means that you can only get information about a parent from what others are saying about them. It gives rise to a possible bias. In these cases, it is better to have other information sources corroborate or refute the initial information.
The best approach would be to make a list of living relatives who you can contact. Next, create a new list of people who can offer information about family members that cannot be contacted. And, finally, define how many generations the genogram will cover.
Prepare a questionnaire to collect information
It is one of the most critical steps, and it is closely related to the goal. What is involved here is preparing a series of questions that serve as a guide to gather the necessary information to develop the template.
It should contain a set of basic questions to collect demographic information. This group of questions should include names and dates (birth, death, marriage, divorce, city transfer, etc.).
Then, there must be a group of questions allowing for a deeper exploration of the specificities of each member of the family.
EXAMPLE
He could list illnesses he has suffered or will suffer, duels he has had to face, hobbies and interests, extreme experiences, and significant conflicts.
Finally, it is necessary to ask a third group of questions aimed at investigating critical family events. It was these times of crisis or serious problems that were common to many family members. The critical events that the genogram seeks to clarify will be evident based on its intended use.
Gather information in the field
Not all of these have the same level of depth. Some will provide the most visible elements, while others will go into one or more aspects. This will depend to no small extent on the field information that can be collected.
What is involved in this step is establishing contact with possible sources of information. It is essential to keep in mind that not everyone is willing to share their story. Therefore, it is necessary to understand from the outset that this could be a daunting task that will require patience.
Gather documentary information
Letters, photographs, videos, and any family document ultimately prove to be very relevant. It is sometimes possible to find important information on an identity document, a purchase and sale contract, or a medical prescription.
Many families cherish the so-called “family album.” There are usually stamped images of major collective events. When you look closely at a photo, you can be intuitive about someone. What emotional “atmosphere” can be seen in the picture? What is the attitude toward each other?
Things to Know While Making Genogram
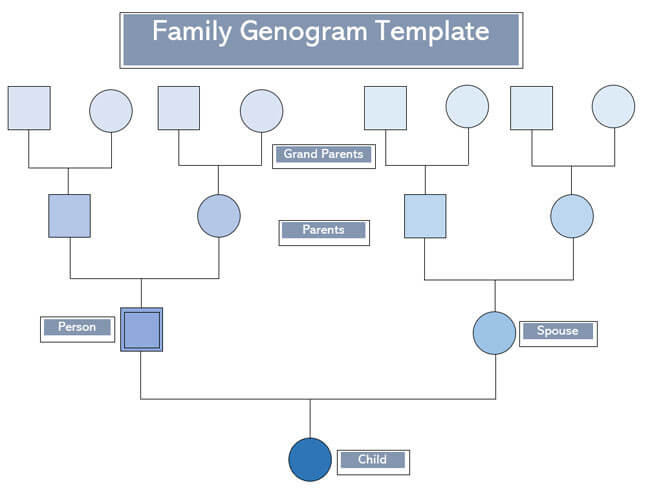
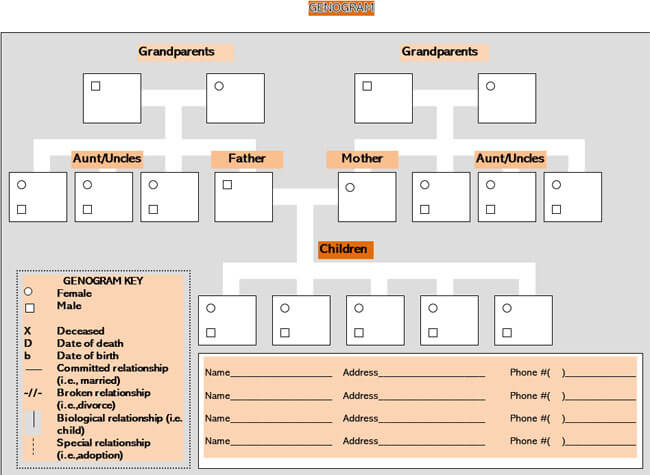
There are three main things to consider while making a genogram: structure, individual data, and relationships between people.
Family structure
The first thing to consider is the family structure. It is a schema that shows the relationships between the individual’s family members, including at least three generations. Even though this component is not the most crucial for clinical or educational research, it is crucial for correctly creating other connections.
On a visual level, the layout is very similar to what we can expect from a family tree, although we already find some differences in this first element.
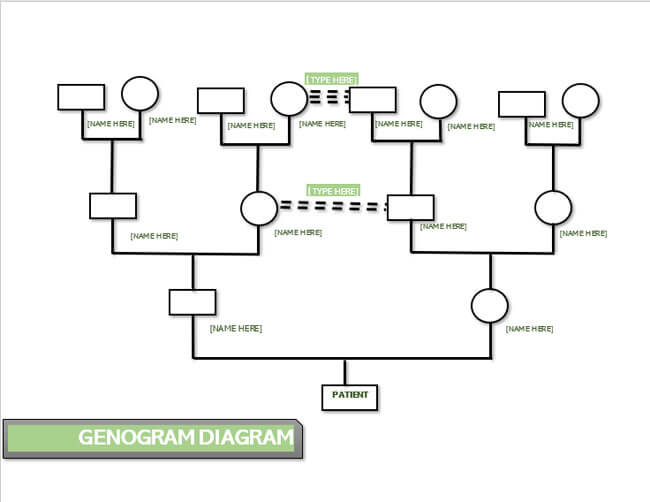
EXAMPLE
Several predefined symbols allow you to point to different connections, such as the relationship between parents and children or marriage.
Relevant information about family members
The second important thing to consider is a series of data points that provide essential information about the family members indicated in the first. These data can be objective (such as the dates of birth and death of individuals) or more subjective.
Emotional bonds
Finally, the third thing to consider while making a genogram is to plot emotional links between different members of the family. We are not talking about blood or legal relationships, but about the emotional, affective, and psychological bond between them.
Thus, all conflicts, affections, similarities at the emotional or mental level, and other similar elements would be reflected in this element, which would be useful when conducting a pedagogical therapy or intervention.
Basic Symbols and Lines Used in a Genogram
Its basic symbols can be used to explain each member’s characteristics and circumstances or their relationships.
Some of the symbols that provide us with information about the relationships that exist between family members are:
Lines
The type of relationship that exists between two family members can be represented in the genogram. The encoding for reading is based on drawing lines that indicate aspects of the relationship between two people.
The coding would be as follows:
- If there is a close and excellent relationship between the two members, two parallel lines will be drawn.
- Three parallel lines would represent members with a very close relationship.
- A symbiosis determines a merged relationship. In that case, it would be a symbiosis of interdependence.
- A dashed line between two people would indicate a distant relationship.
- An irregular line would be drawn between two people who have a hostile relationship.
- An irregular line with three parallel lines shows a very close and antagonistic relationship. It is narrow and conflicting.
Symbols
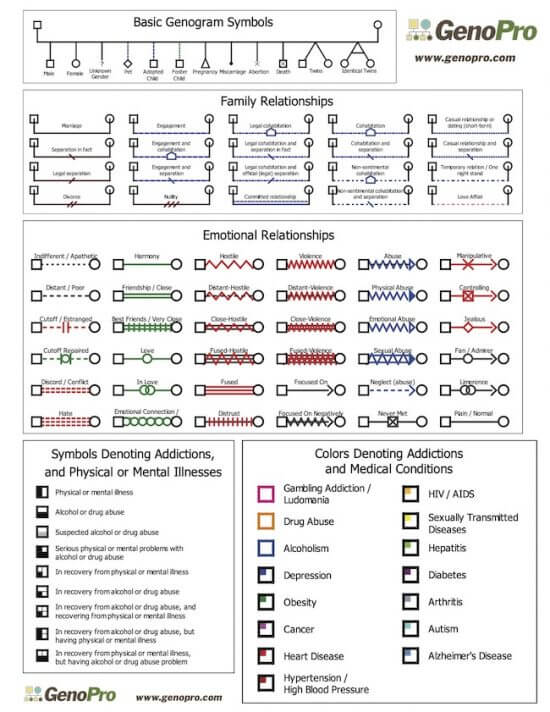
Symbols in it are used to represent parent and child relationships. In a standard genogram, there are three different types of children: the biological/natural child, the adopted child, and the foster child. Symbols are also used for gender, pregnancy, abortion, and miscarriage. The name and current age, or date of birth, of each person are inside their symbol.
- The circle represents a woman
- The square represents a man
- Deaths are represented by a cross
- A square with a dashed line is used for an adopted child
- A square with a dotted line is used for a foster child
- Abortions, whether it was spontaneous or induced, is represented by a black-colored circle or only by a blade.
- Pregnancy is indicated by a triangle.
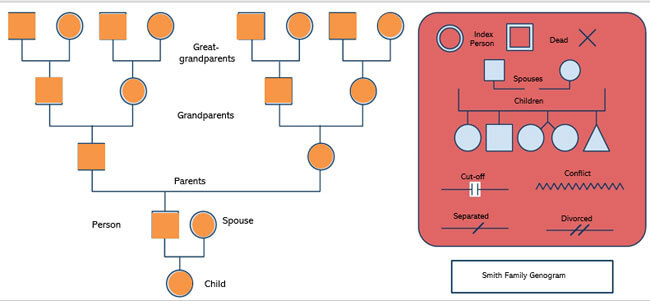
Genogram symbols chart
The following chart shows the icons, lines, and symbols to use for certain relationships.
Step-By-Step Guide on How to Make Genogram Template
The following guide will help you create a comprehensive and accurate genogram.
Draw the diagram according to the links
The type of relationship between family members is always an important fact. As a result, it’s essential that not only the link itself be represented but also some aspect that helps determine the link’s overall quality.
Use standard symbols
It is appropriate to design standardized symbols to represent close, distant, strained, and conflicting relationships graphically. It is also useful to have symbols to graphically represent cases of physical, emotional, or sexual abuse. In many cases, it would be necessary to mention that some form of abuse is suspected, but no evidence is found.
Analyze the genogram
Analyze it to check if all information is recorded correctly. In principle, this is to assess the accuracy of what is recorded in the graph. When in doubt about data, it is best to highlight the doubt or find a way to corroborate the information.
You can organize the data as precisely as possible and define the connections using the initial analysis. This must be done with accuracy to ensure that the genogram can be effectively used to obtain insights about hereditary diseases or behavioral patterns in the family.
Search for trends
In this step, the validity of the genogram is specified. All the information collected, organized, and represented should make it possible to identify trends. You should be able to visualize the events, circumstances, or things that repeat themselves throughout one generation after another.
You can analyze,
EXAMPLE
If there is a recurrent disease in different family members and successive generations, or if there is dysfunctional behavior transferred from one generation to the next.
You may also see why some family members escape this pattern and what was in their personal history that allowed them to break the pattern.
Many such questions can be answered by observing the genogram. Certainly does not give all the details, but does offer helpful hints for further research and, more importantly, for understanding the root causes of a current event.
Check compliance with the objective
The development of a genogram is not a mechanical task, nor does it give absolute results. Perhaps the same process results in reconsidering the original goal one or more times. Sometimes the discovery of unexpected data can lead us to take a new approach.
Therefore, the verification of compliance with the initial objective has a relative value. In reality, what needs to be verified is whether the data found, organized, and interpreted enrich the understanding of the person being analyzed. It is often the case that, although the objective was not fully achieved, it helped. Either way, there should be a final evaluation of the process.
Frequently Asked Questions
The half-siblings are usually shown on the left side of the genogram.
To show a remarriage in a genogram, one has to extend the line from the first marriage and include the other spouse.
A diagonal cross over the symbol is used to indicate death. It is also used to represent miscarriage.
Conclusion
The genogram is an instrument for analyzing the family structure, making it possible to give a brief and quick overview of all relationships, often spread over three generations. It highlights the filiation and breaks of links and the transgenerational repetitions of dependent behaviors or vulnerabilities. Therefore, it is a way of creating the genealogical tree of a family by giving insights into the many different things that have happened in a family, such as negative family dynamics and family struggles like divorce, death, and broken relationships. Furthermore, it can aid in your comprehension of possible causes for these events.
About This Article