A metric unit chart helps you find equivalent measurements without having to remember every conversion. The important part is knowing which relationship to use. Changing centimeters into millimeters is straightforward, but square units, cubic units, and temperature scales don’t all follow the same rule.
The six editable charts below cover area, cubic volume, liquid volume, mass/weight, temperature, and time. They’re available in Microsoft Word (DOTX or DOCX), OpenDocument (ODT), and linked Google Docs formats. Each uses a landscape US Letter layout. You can use them on screen or prepare printed copies. This collection doesn’t include a separate length conversion chart.
Metric Unit Chart Template 01
Metric Unit Chart Template 02
Metric Unit Chart Template 03
Metric Unit Chart Template 04
Metric Unit Chart Template 05
Metric Unit Chart Template 06
Why square and cubic units change differently
One centimeter equals ten millimeters. If something measures 5 centimeters long, converting it into millimeters is simple enough. Multiply by ten and you get 50 millimeters.
But what happens when you’re measuring the area of a surface rather than its length?
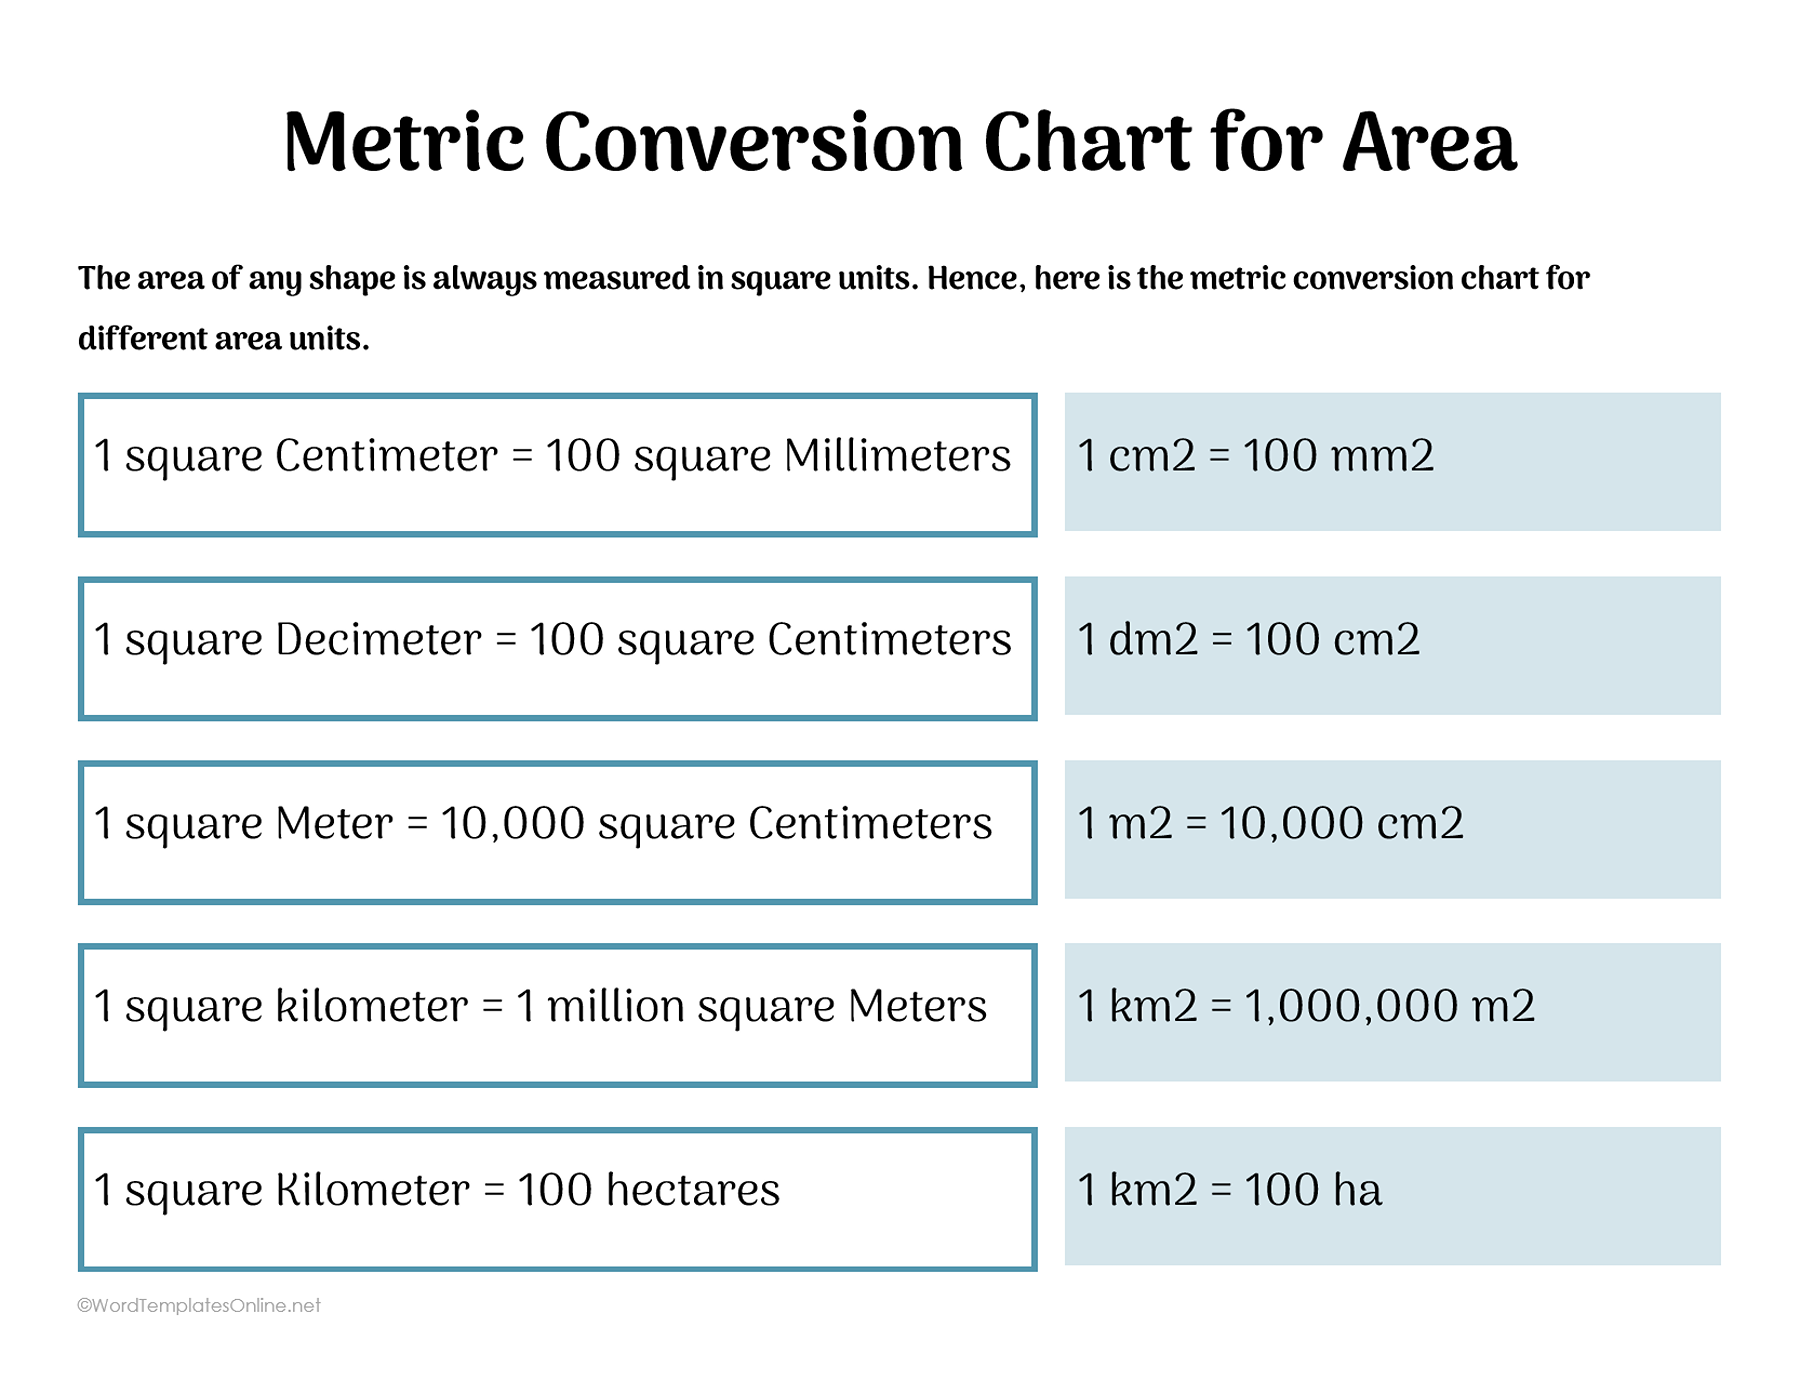
Imagine a square with sides measuring 1 centimeter each. Its area is 1 square centimeter, written as 1 cm².
Now measure those sides in millimeters. Each side is 10 millimeters long. To calculate the area, multiply the length by the width:
10 mm × 10 mm = 100 mm²
So, 1 cm² = 100 mm².
That little raised 2 in cm² makes quite a difference. It tells you the measurement covers two dimensions. When you change from centimeters to millimeters, the conversion factor applies to both.
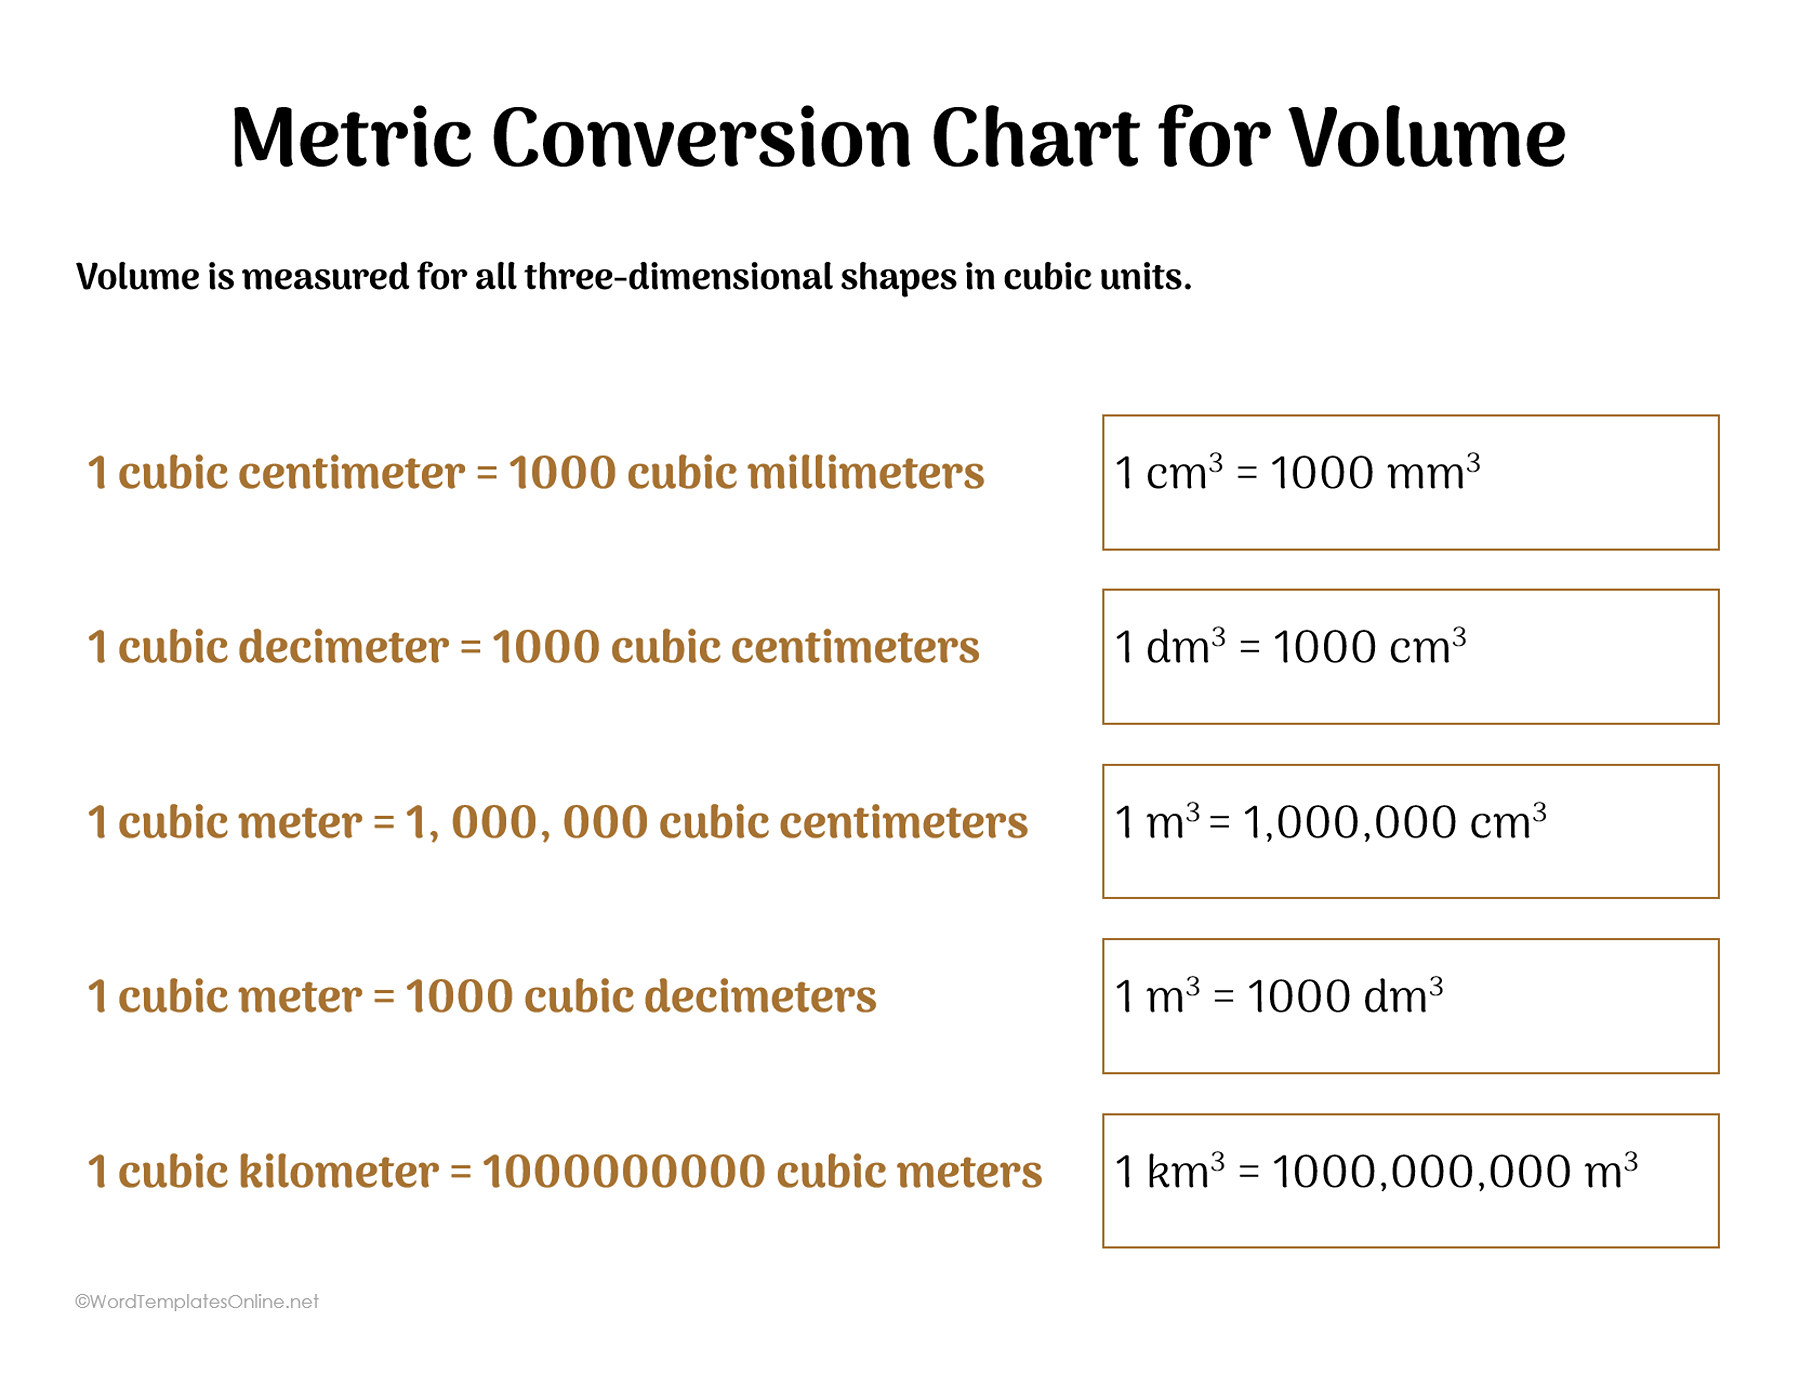
Cubic units add another dimension. Picture a cube measuring 1 centimeter along each edge. Its volume is 1 cubic centimeter, written as 1 cm³.
In millimeters, the calculation becomes:
10 mm × 10 mm × 10 mm = 1,000 mm³
This gives us 1 cm³ = 1,000 mm³.
The area and cubic-volume charts in this collection show these relationships at different scales. The area chart includes square centimeters, square meters, square kilometers, and hectares. The cubic-volume chart covers units such as cubic millimeters, cubic centimeters, cubic decimeters, and cubic meters.
The underlying metric prefixes work the same way. According to the National Institute of Standards and Technology’s metric-prefix reference, prefixes such as centi- and milli- represent powers of ten. What changes for area and cubic volume is how many dimensions that factor applies to.
How liters fit into volume measurements
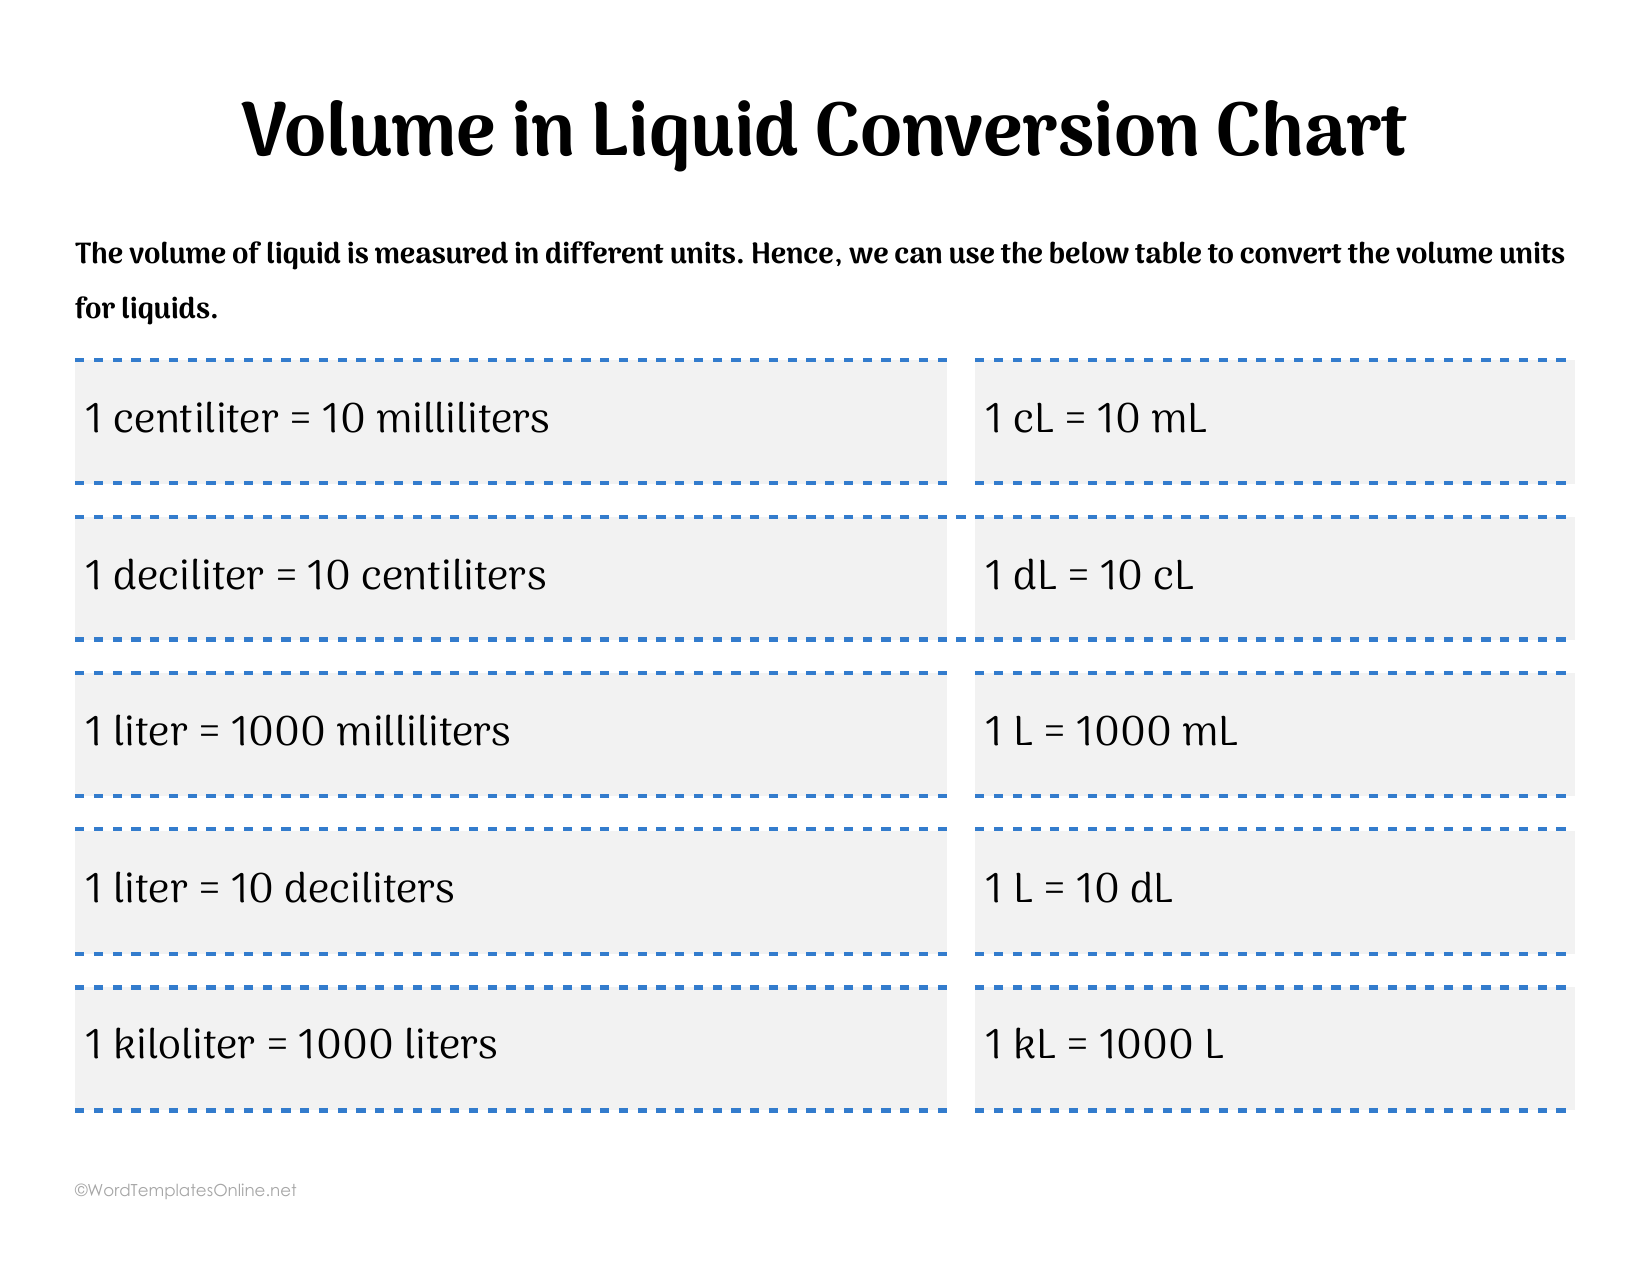
You may have noticed that the collection also includes a liquid-volume chart. It uses liters and smaller or larger units such as milliliters, centiliters, and kiloliters.
These are still volume measurements. The difference is how the units are expressed.
For example, 1 cL = 10 mL and 1 L = 1,000 mL. You can use the metric prefixes directly for these relationships.
There’s also a connection between the two volume charts that is worth knowing:
1 cm³ = 1 mL
The NIST reference for SI units of volume confirms this equivalence. It also identifies 1 cubic decimeter as equal to 1 liter.
This means the cubic-volume and liquid-volume charts aren’t measuring entirely different things. Both deal with volume. One uses units based on cubed lengths, while the other presents liter-based relationships commonly used for liquids.
The liter isn’t restricted to measuring liquids, either. It’s a unit of volume regardless of the material being measured.
If you’re working with US cups, fluid ounces, or gallons, those conversions involve different units. Our liquid measurement conversion guide covers that broader subject.
When moving the decimal point isn’t enough
Mass is one of the easier places to see metric prefixes in action.
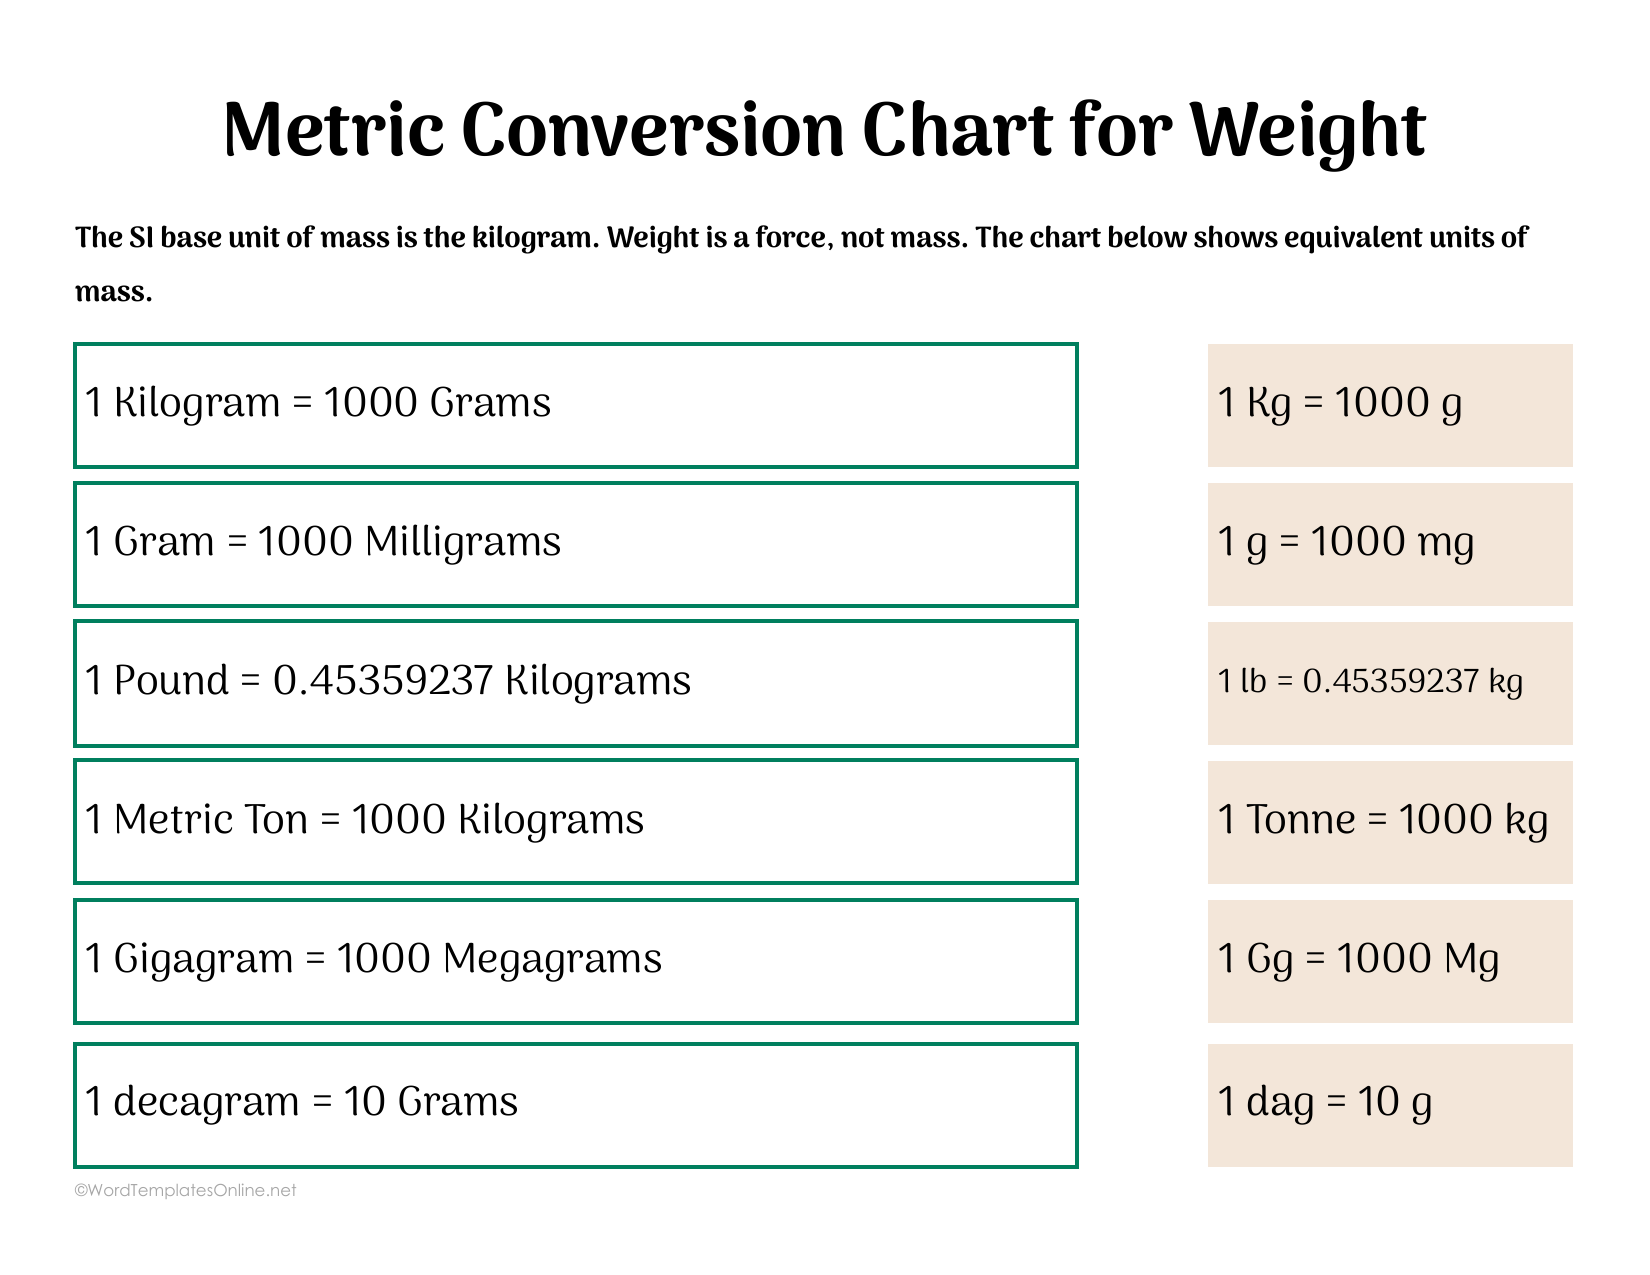
The mass chart includes the relationship 1 kilogram = 1,000 grams. Suppose a package has a mass of 2.5 kilograms. Multiplying by 1,000 gives you 2,500 grams.
Converting grams into milligrams follows a similar pattern. There are 1,000 milligrams in a gram.
Before going further, it’s worth clearing up a small distinction. We often say weight when talking about kilograms or pounds, but mass and weight aren’t technically the same thing.
Mass describes how much matter an object contains. Weight is the force of gravity acting on that object. The kilogram is the SI base unit of mass, as explained in NIST’s definitions of the SI base units.
You don’t need to worry about that distinction every time you read a package label. It simply helps explain what the units on the chart represent.
Pounds work differently from metric prefixes. You can’t turn pounds into kilograms by moving the decimal point a few places.
The exact relationship is:
1 lb = 0.45359237 kg
This conversion constant is stated in the official Units of Measurement Regulations 1995.
For an everyday estimate, you could use approximately 0.454 kilograms per pound. When accuracy matters, use the appropriate conversion factor rather than rounding too early.
The mass chart also includes less familiar units such as megagrams and milligrams. Watch the capitalization of their symbols. mg means milligram, while Mg means megagram. That’s a substantial difference caused by one letter changing case. Metric-prefix symbols are case-sensitive.
Time presents a different kind of conversion.
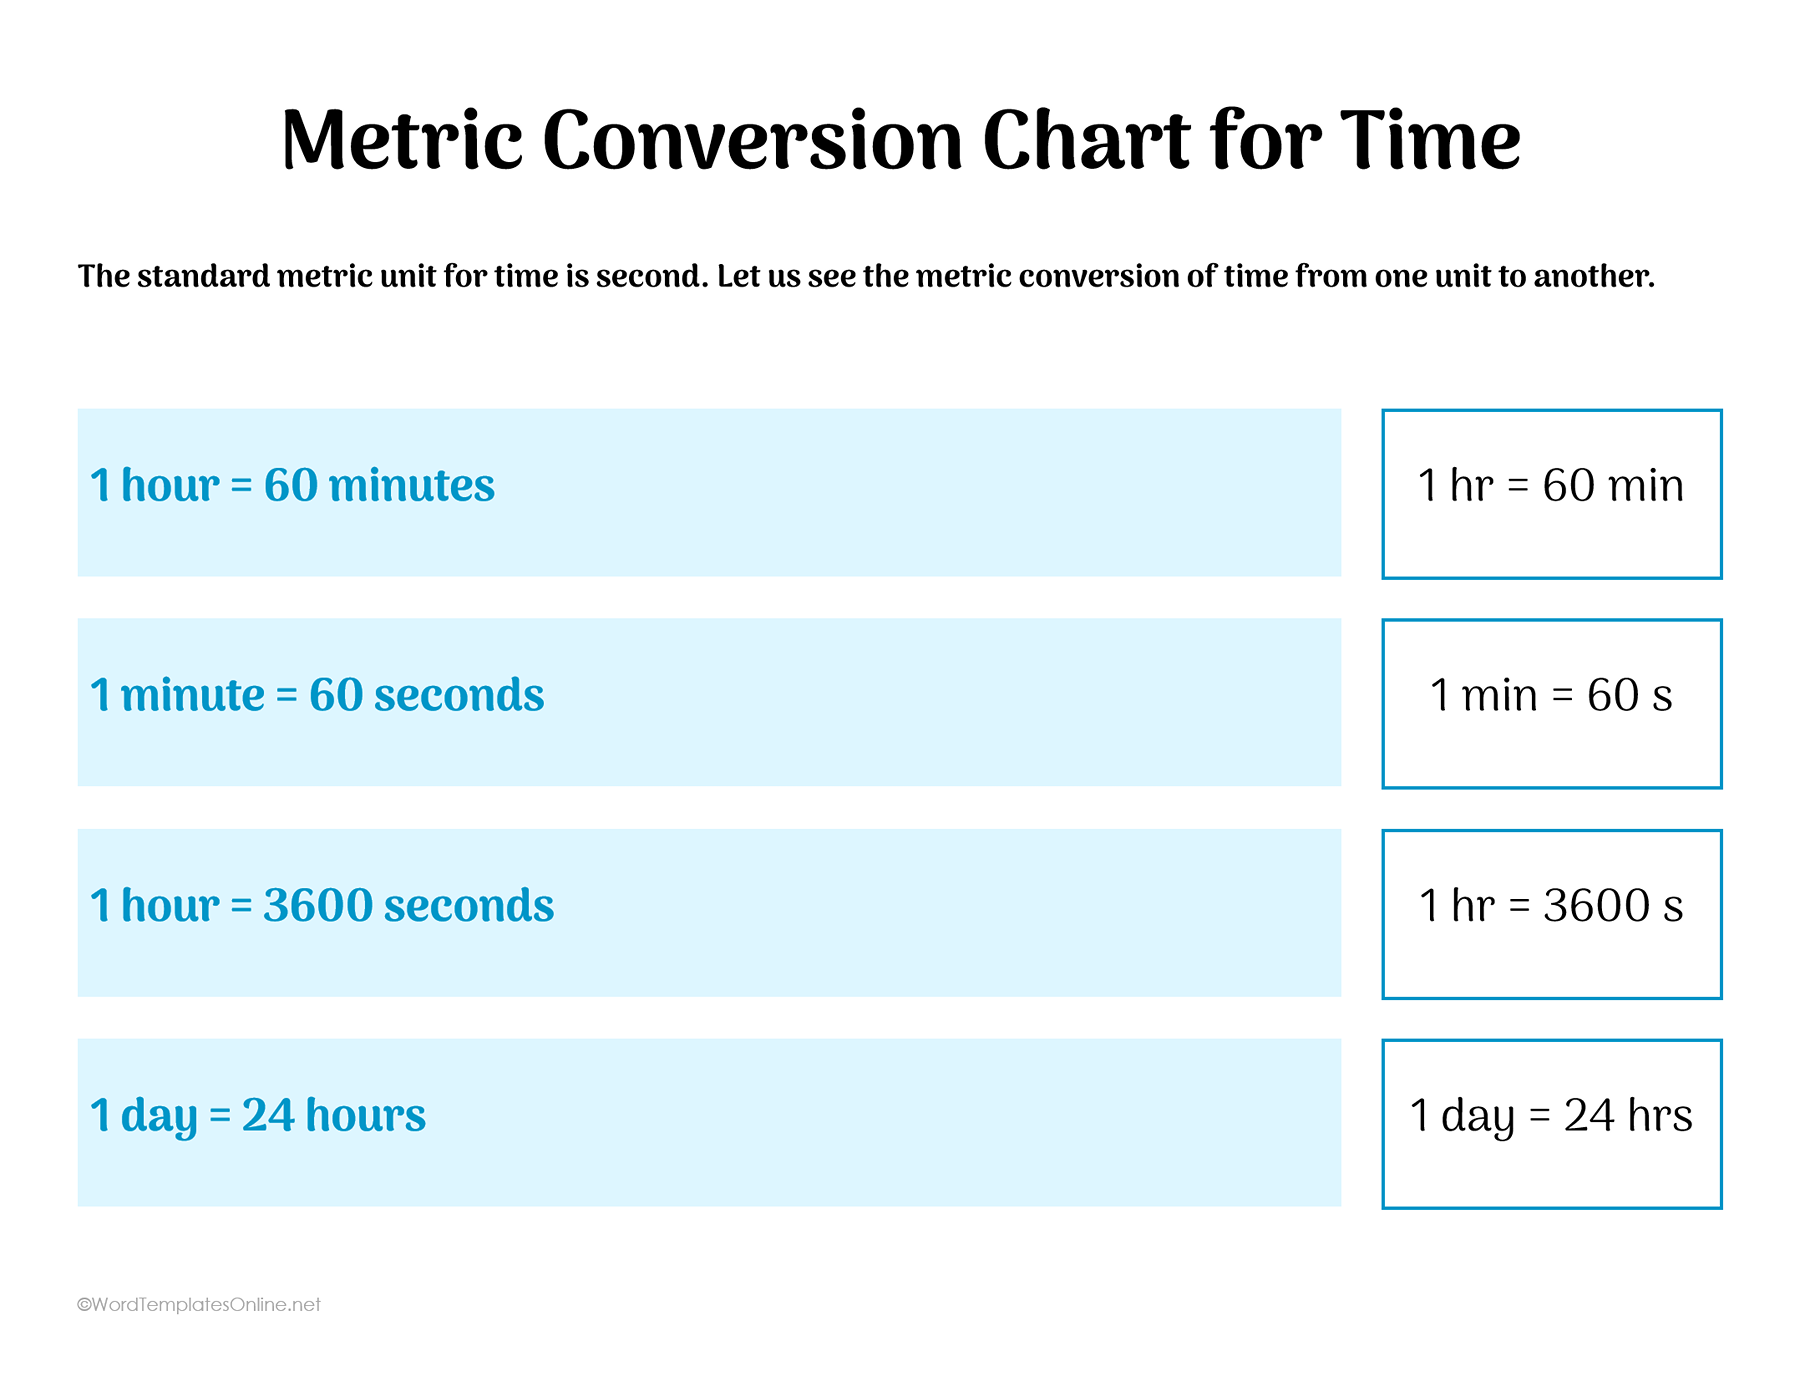
Although the second is the SI base unit of time, familiar relationships between seconds, minutes, and hours don’t follow a decimal pattern. One minute contains 60 seconds, and an hour contains 60 minutes.
Suppose you need to convert 2.5 hours into minutes:
2.5 × 60 = 150 minutes
Multiplying by 100 would be tempting if you were thinking about metric prefixes, but it wouldn’t work for hours and minutes.
The time chart includes these ordinary duration relationships, along with the number of hours in a day. You can refer to it when recording time or checking a calculation without treating every time unit as another step on a decimal scale.
Why temperature needs a formula
Temperature conversions require a different approach because Celsius, Fahrenheit, and kelvin don’t share the same starting point.
Look at this equivalence from the temperature chart:
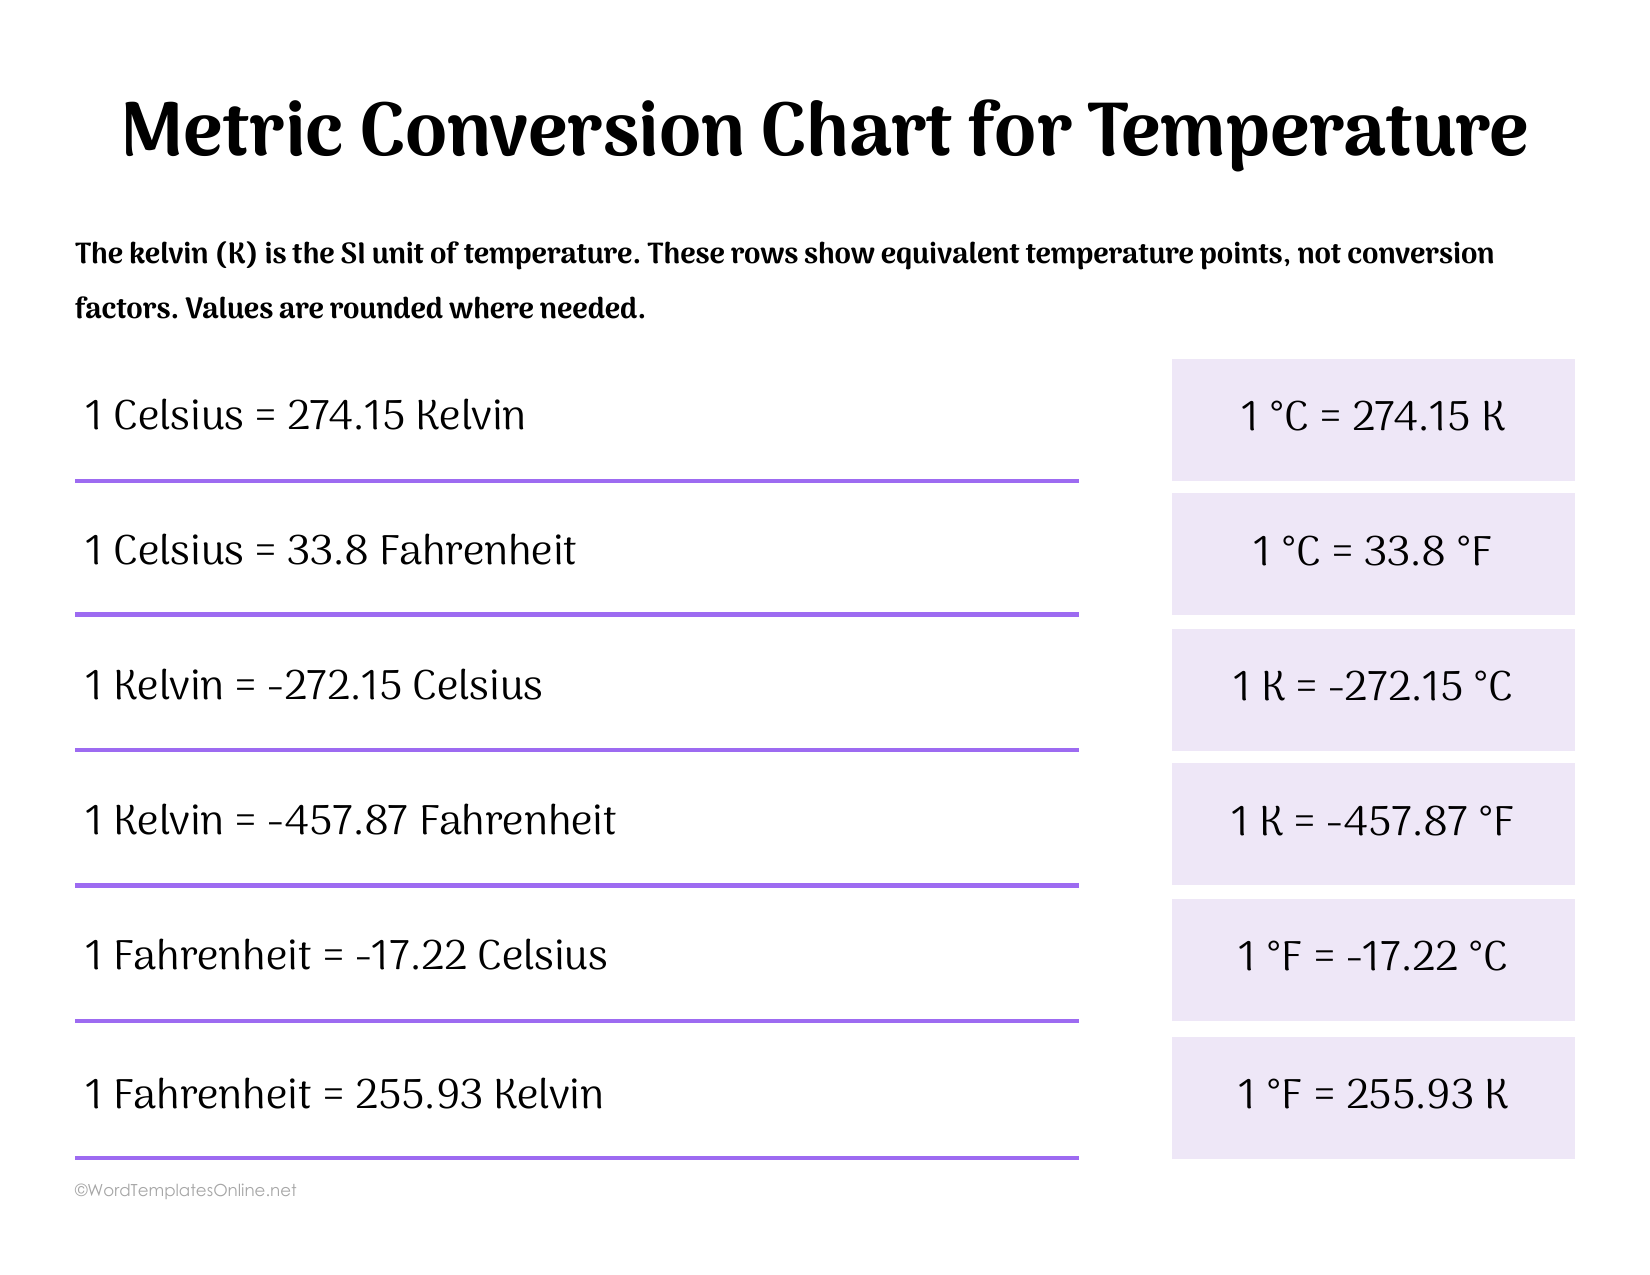
1 K = −272.15 °C
It means a temperature of 1 kelvin corresponds to −272.15 degrees Celsius. It doesn’t mean you should multiply every temperature in kelvin by −272.15.
There’s an important difference between a temperature reading and a change in temperature.
A temperature increase of 1 kelvin is the same size as an increase of 1 degree Celsius. But a temperature reading of 1 K is not equivalent to a reading of 1 °C.
To convert an actual temperature from kelvin into Celsius, subtract 273.15:
°C = K − 273.15
To convert Celsius into kelvin, add 273.15 instead.
Fahrenheit requires another formula:
°F = (°C × 1.8) + 32
Both the multiplication and the addition matter. The multiplier accounts for the difference in degree size, while the added 32 accounts for the different starting points.
Let’s take a temperature of 25 °C.
To express it in kelvin:
25 + 273.15 = 298.15 K
To express it in Fahrenheit:
(25 × 1.8) + 32 = 77 °F
So the same temperature can be written as:
25 °C = 298.15 K = 77 °F
These formulas come from NIST’s temperature conversion guidance.
The temperature chart provides selected equivalent values across the three scales. Some values are rounded. If you need to convert a temperature that isn’t listed, use the appropriate formula instead of treating one of the chart’s examples as a multiplication factor.
It’s also worth paying attention to what a question is asking. Converting an actual temperature reading is different from converting a temperature increase or decrease. The formula’s offset applies to the reading, not to the size of the change.
Before using a conversion in your own work
A conversion is much easier to understand later when the unit stays with the number.
Imagine copying “100” from a calculation into your homework or another document. Without a unit, there’s no way to tell whether it refers to square millimeters, cubic millimeters, or something else.
For area, write 100 mm². For volume, use the corresponding cubic unit when that’s what you’ve calculated. If you’re recording a liquid quantity in milliliters, write mL beside the value.
The charts are references rather than automatic calculators. They provide selected relationships, so you may still need to multiply, divide, or use a formula for a measurement that isn’t listed.
You can keep a digital copy or prepare a chart for printing. The area, cubic-volume, and time charts are supplied as Microsoft Word DOTX templates. The liquid-volume, mass, and temperature charts use DOCX files. All six have ODT and linked Google Docs options as well.
Each document uses a landscape US Letter chart page and includes a separate credits page. When preparing a printout, check the page selection in print preview so you use the intended chart page. Pay particular attention to the smaller numbers and unit symbols. The appearance may vary between office applications.
For work where an incorrect conversion could have serious consequences, refer to the applicable official measurement standard or technical source. These are general-purpose reference charts rather than certified measuring tools.
Before transferring a converted value into your final work, give its unit one last look. The number may be correct, but it still needs to describe the measurement you intended.
About This Article