A break-even analysis is an approach used in economics to determine the minimum number of sales or units that a business must sell at a specified price to cover the cost of an ongoing business (fixed and variable costs).
Free Break-Even Analysis Templates
Break-Even Analysis: Usage and Importance
The uses of break-even analysis in business are diverse and of great importance in ensuring that a business remains profitable. This article will illustrate when it is used and its importance in business by illustrating the benefits a company is expected to gain from using it.
They include
- Price smarter: If effectively carried out, this analysis is an effective tool in determining the appropriate figures to price products and services so that costs are recovered and the business gets to make a profit.
- Cover fixed costs: The break-even point is calculated from the total fixed costs, meaning the company can strategize on how these fixed costs will be met after the analysis.
- Catching missing expenses: When planning revenue generation, it is easy to leave out some costs. By listing all the costs of production, it can help the company identify costs that might have been left out.
- Set sales and revenue targets: The break-even point represents the company’s goals in terms of sales and revenue. The company becomes aware of the number of units it must sell to recover production costs and works towards it. Past this point, the organization can determine the revenue target for a specified period, such as the annual revenue target.
- Financial modeling: When conducting financial modeling to determine the performance of the financial portfolio of a business, break-even analysis is incorporated into sensitivity and scenario analysis, which are done under financial modeling.
- Better and smarter decision-making: A break-even analysis is a solid and fact-driven basis to base decisions on, for example, the viability of a project. Also, a company can determine its profit margin by calculating the value of unutilized capacity (remaining units) in a business once the breakeven point has been reached.
- Limit financial strain: It can be used to limit risks and failures in business by evaluating ideas to see if they are profitable based on realistic potential numbers.
- Fund the business: When external sources of funds, such as investors and financial institutions, are approached to acquire funding, the break-even position can be used to pitch the return on investment of a business. The break-even position illustrates profitability, which shows the company’s ability to pay off its debts.
When is a break-even analysis used?
Break-even analysis is primarily used when undertaking strategic decisions, but can also be used to guide day-to-day business activities. Below are common scenarios when using it that might prove immensely helpful:
- Starting a new business: When starting a business, pricing, and profitability are two aspects that entrepreneurs must take into consideration. Carrying out a break-even analysis is an effective way of determining these two aspects. Depending on the results of the analysis, entrepreneurs can determine the feasibility of the business set sales goals, and plan the minimum number of sales they must sell before starting to generate revenue.
- Creating a new product: It is common for existing businesses to want to diversify their catalog. Before commencing production of new products, a business can perform this analysis to determine if the new product will be profitable and by what margins compared to the additional funding the business will have to inject to produce the new product. It is worth noting that fixed costs like office rent will remain constant in such a situation.
- Changing the business model: Adaptability is crucial to remaining competitive in business. Adaptation might be necessary to accommodate changes in the market, consumption methods, and technology. To adapt, businesses will sometimes have to change their business model to remain competitive. A break-even analysis template is an effective way of checking the impact of changes in the business model on sales and profits, for example, changing from brick-and-mortar stores to online.
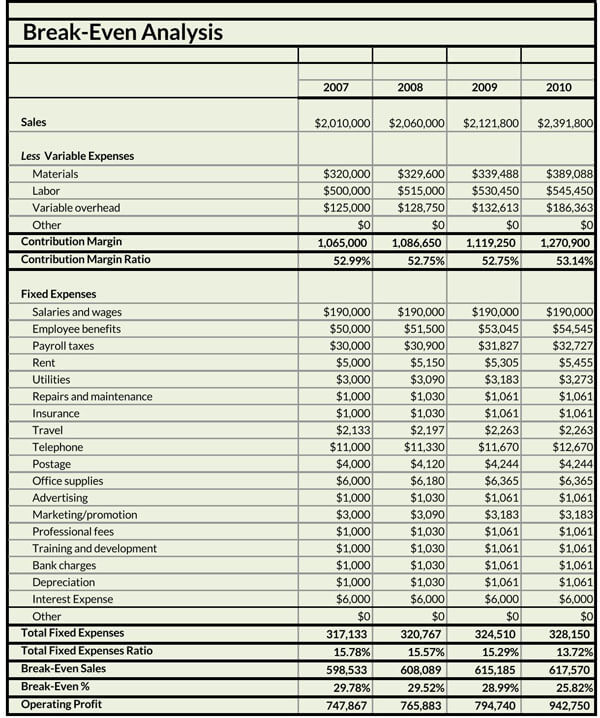
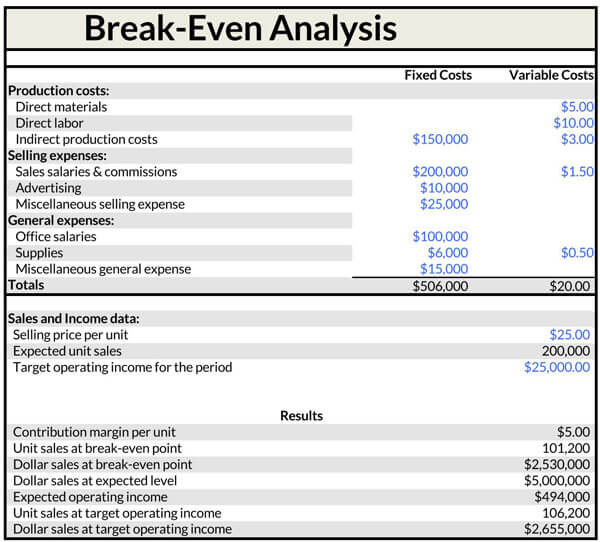
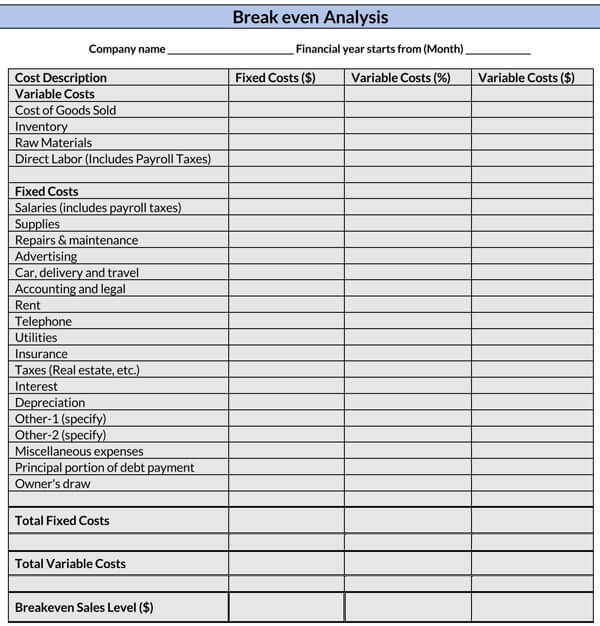
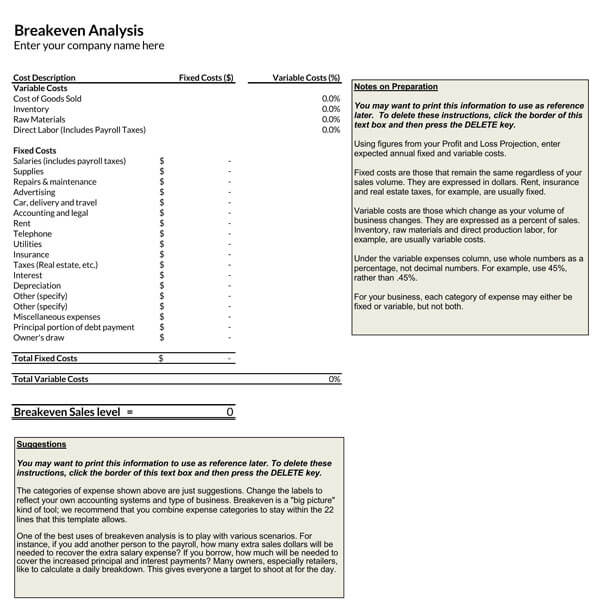
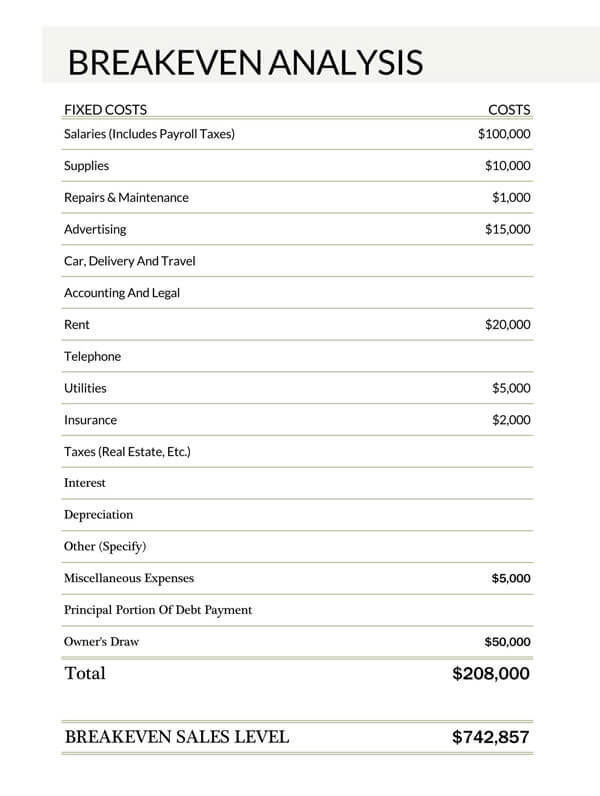
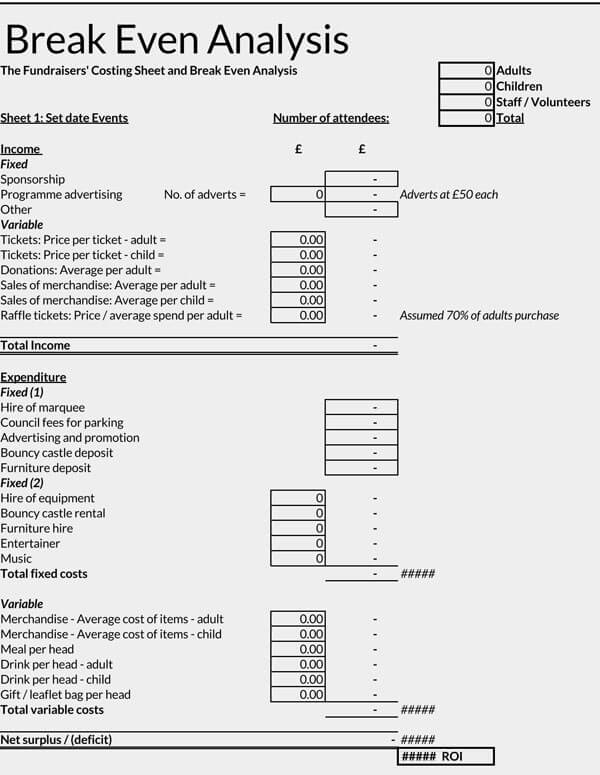
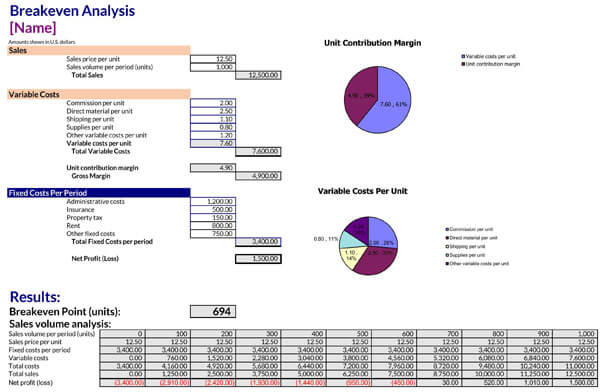
Components of Break-Even Analysis Template
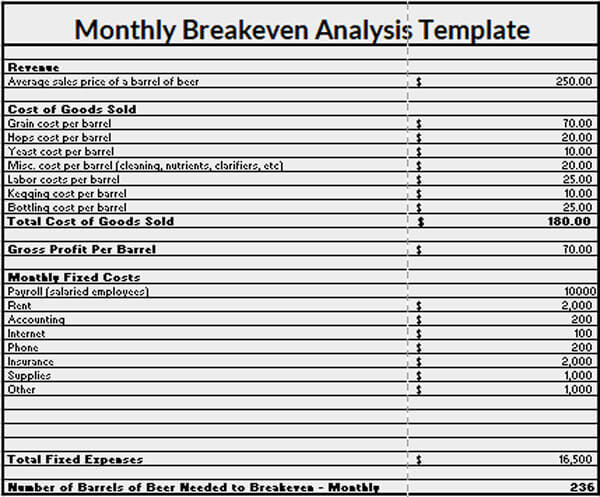
To fill out a break-even analysis template, one should have all the elements required to carry out the calculations. The template has three primary components:
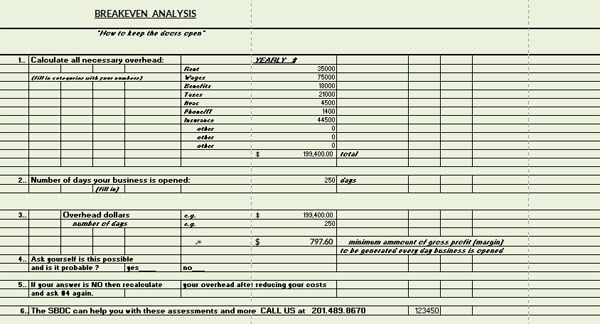
- Fixed costs: Fixed costs remain constant regardless of the number of units produced. They include rent, insurance, software subscriptions, and labor (salaried staff). A list of all fixed costs is provided; they are normally on a monthly basis. Alternatively, they are referred to as overhead costs.
- Variable costs: Variable costs are costs that fluctuate depending on the number of products produced (production volume) and sold, for example, raw materials, fuel, labor (part-time employees), commissions, packaging, etc. They are directly related to production.
- Average price (sales price per unit): The average price is the proposed selling price of each unit.
Break-Even Point Monitoring
Monitoring the break-even point ensures the company keeps track of when it is making or losing money, which is a key aspect for shareholders. The methods below can be utilized to lower the breakeven point. It is defined as the production level at which the sum of the total costs and variable costs equals the revenue generated from sales. This point can also be defined in terms of the number of sales (units sold) or the amount of money.
Pricing analysis
Companies can resort to eliminating or minimizing price reduction offers, such as discounts, to ensure products or services are sold at the maximum price. This way, fewer units are required to reach the break-even point.
Technology analysis
Technology analysis is also a proven method of monitoring the break-even point. Technology that increases the efficiency of operations reduces production costs and the variable costs associated with manual operations. As a result, the output is increased relative to the input.
Cost analysis (lower costs)
Cost analysis is the evaluation of costs and benefits associated with the production and sale of goods and services. It helps in identifying and prioritizing cost-saving opportunities through the reduction or elimination of costs, which lowers the breakeven point while delivering the same quality and quantity of goods and services.
Margin analysis
Product margins are also factors at the break-even point. Marketing products with the highest margin of return lowers it.
Outsourcing
Outsourcing is a method well-known for cutting production costs. If it is cheaper to outsource an activity that is necessary at only one stage of production, then it should be outsourced to lower fixed costs and thus reduce the breakeven point.
Special Considerations
The calculations of break-even analysis are essential to investors, for their primary concern is to make a profit. The analysis is considered when investors want to determine the price at which they will get returns on their investment. Therefore, it is an important consideration when investors are evaluating the Return on Investment of different investment options before deciding to invest:
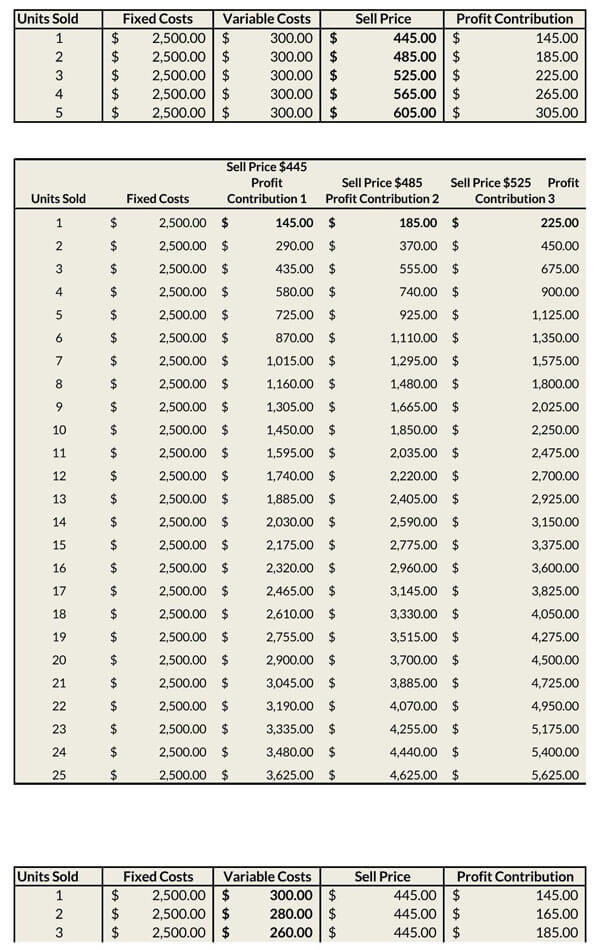
Contribution margin
A contribution margin is the difference between the selling price of a product or service and the total variable costs involved in its production. The contribution margin is not inclusive of the fixed costs.
EXAMPLE
If product A is sold at a wholesale price of $75 with production costs of $25 fixed costs and $30 variable costs, its contribution margin is the difference between $75 and $30, which is $45.
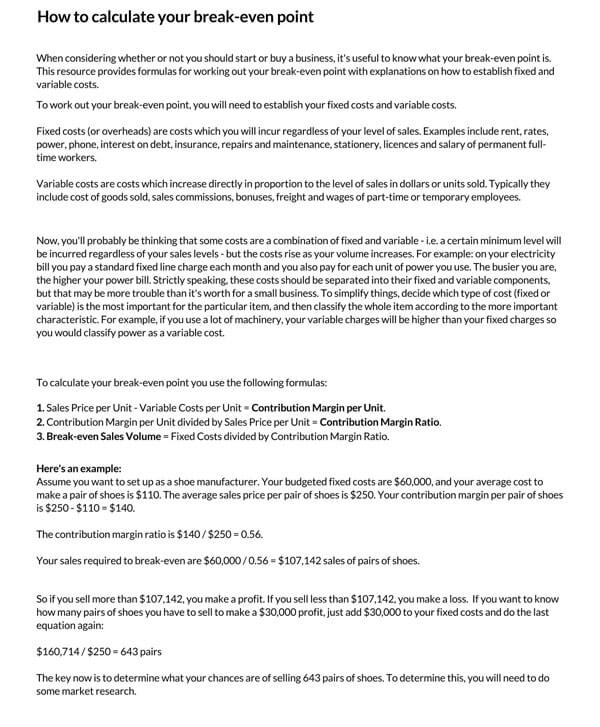
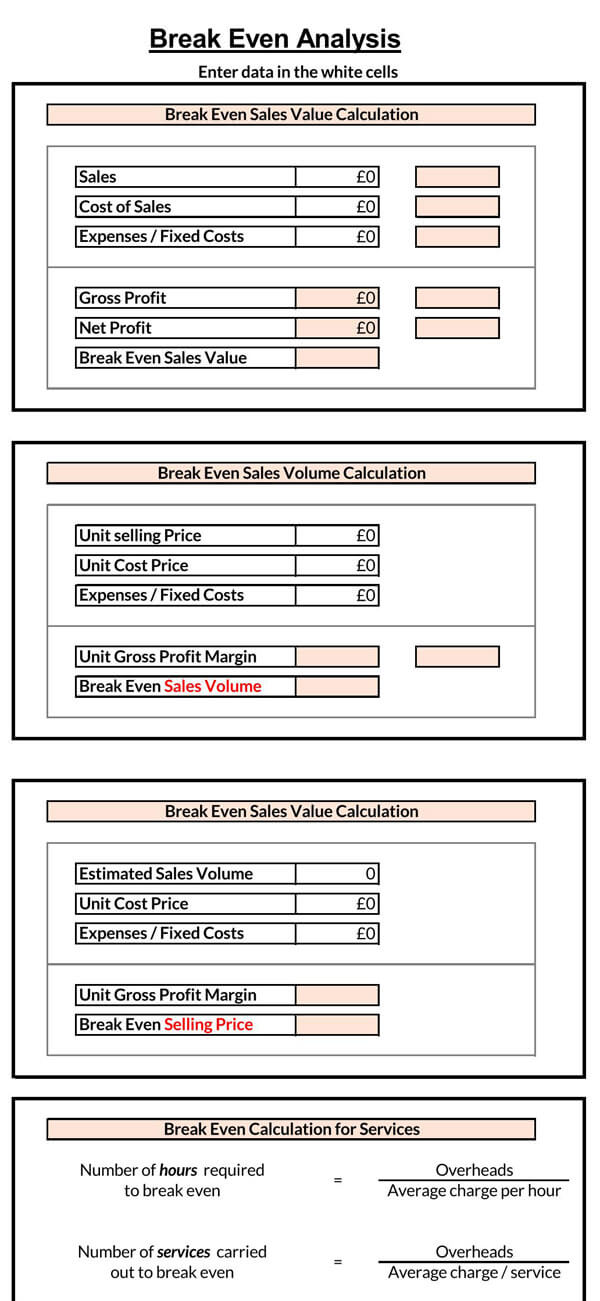
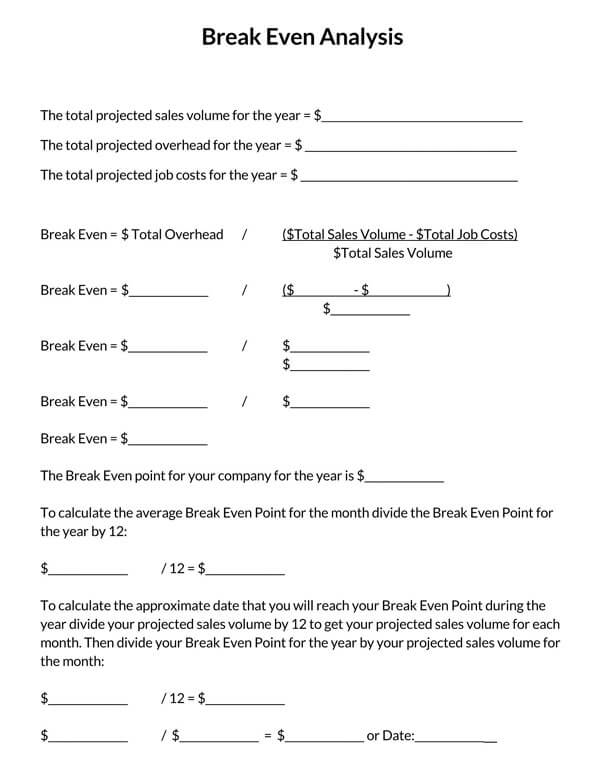
How to calculate break-even point
Two formulas can be used to perform a break-even analysis, the basic one being dividing the total fixed production costs by the contribution margin per unit (the average price per unit less the variable costs).
Alternatively, the breakeven point can be determined by dividing the total production costs by the contribution margin ratio (which is the contribution margin divided by the average selling price).
- Contribution margin = average selling price –variable costs
- Break-even point = fixed costs/contribution margin or
- Break-even point =fixed costs/ (average selling price –variable costs)
EXAMPLE
A chair being sold at a retail price of $100 that is produced at variable costs amounting to $50 and $30 fixed costs, with sales amounting to $10, 000. Its breakeven point can be calculated as follows:
Contribution margin = $100 – $50 = $50
Break-even point (BEP) = $10, 000/$50 = 200
Example
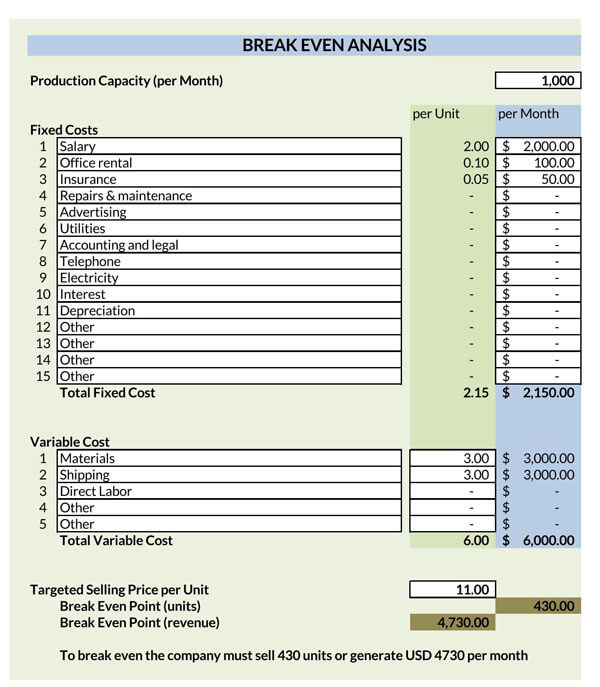
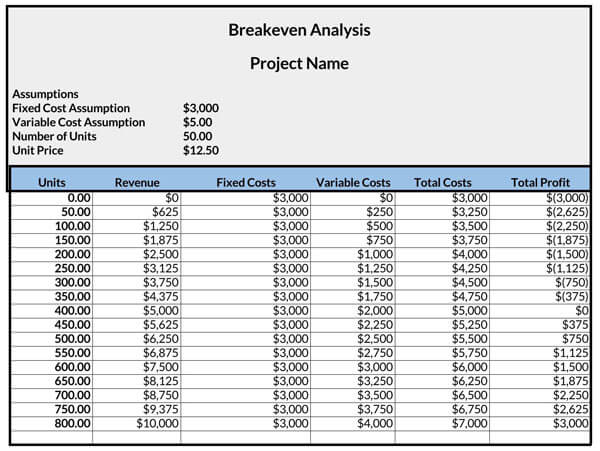
The example below will be used to illustrate how a break-even analysis is carried out:
Vibrant Co. produces children’s soldier toys at a fixed cost of $10,000, which covers the property lease, property taxes, and management salaries. The company also incurs a variable cost of $1.6 per ton. The sales manager needs to know how many toys should be sold to cover the cost of production before investors can start making money. Each toy is being sold for $6.
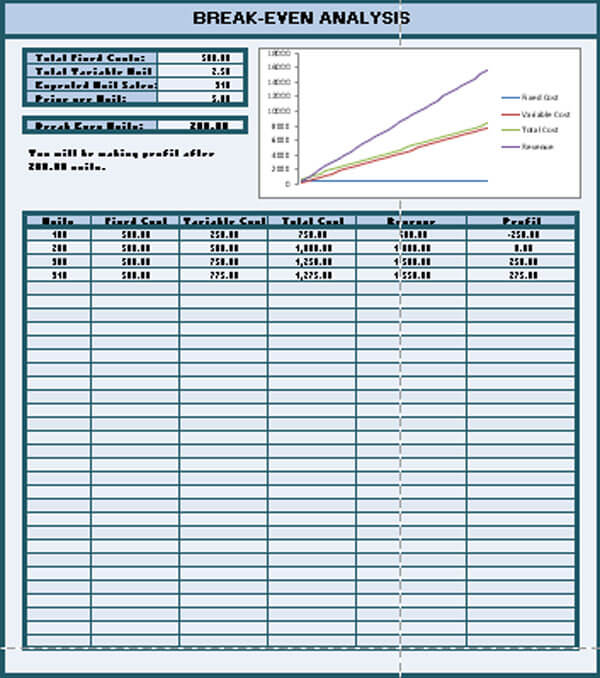
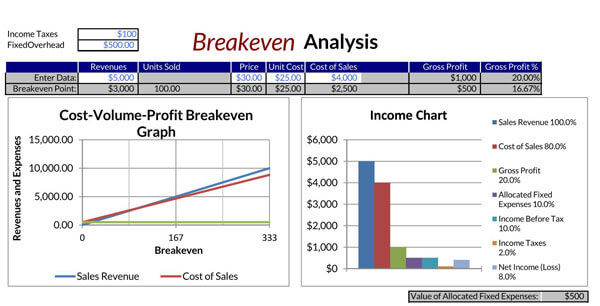
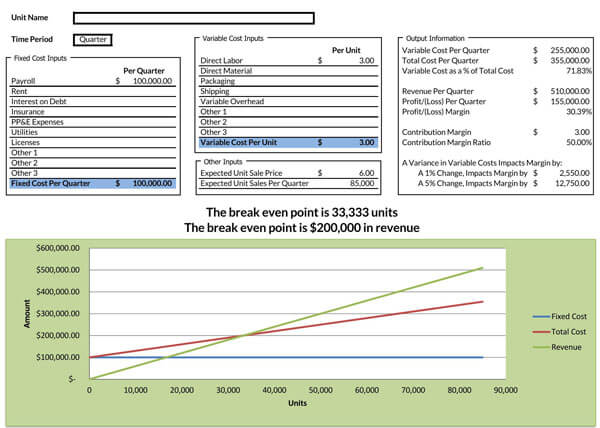
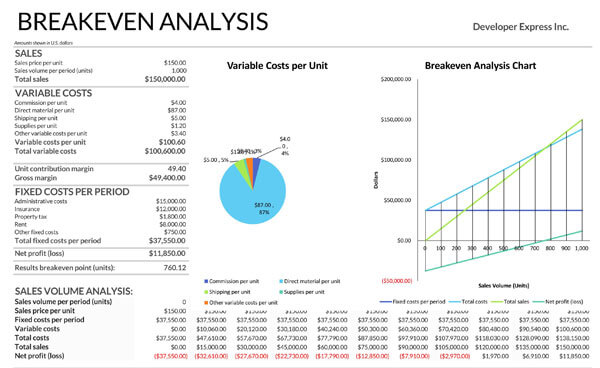
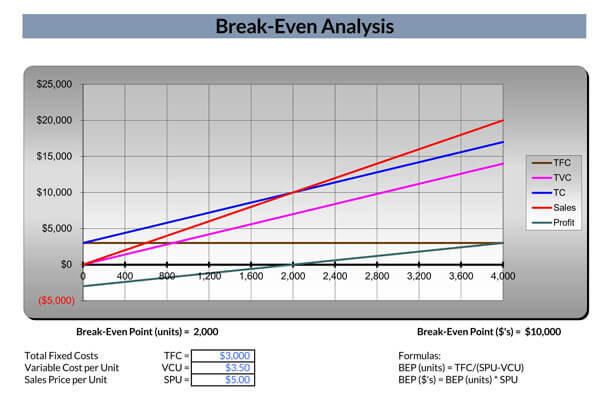
Graphical presentation
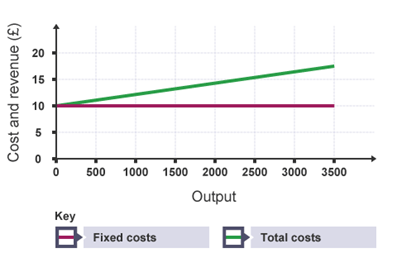
The graphical representation of the costs (fixed and total costs) and revenue versus the number of toys sold is as follows:
- The number of toys is given on the X-axis (horizontal), while revenue and costs are given on the Y-axis (vertical).
- The fixed costs shown in both graphs by the purple line are uniform regardless of the units produced because they do not change throughout the period. Even if the company sold no toys, it would still incur a fixed cost of $10,000.
- The difference between the total costs and the fixed costs amounts to the variable costs. It changes as the number of units sold changes. It is $0 when there are no toys sold.
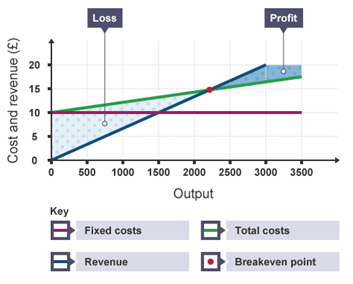
- The revenue, shown in graph 2 by the blue line, increases uniformly from origin because revenue is directly related to the number of sales made. For example, selling 1500 toys equals $ 10,000, while selling 3000 toys amounts to $ 20,000.
- To determine the breakeven point, the following calculations should be done:
BEP = $10, 000 ($6 – $1.6) = 2,272 units.
The break-even revenue is $2,272 multiplied by $6, which is equal to $13,632. Variable costs equal 2, 272 x $1.6 = $3, 635, which is equal to the difference between the total revenue and fixed costs.
Once the sale of toys exceeds 22,272 units, the company is making a profit. On the other hand, sales less than the BEP signify a loss, as indicated.
Frequently Asked Questions
There are several limitations to break-even analysis. The major ones are that it does not predict demand; it assumes demand is stable, which determines how likely the sales projected are to be realized. Two, it ignores competition and time; competition will always influence pricing and other aspects, and fluctuations in competition, cost of materials, and such will be time-dependent, especially if the break-even period is significant, like a year. Lastly, it is too simple, thus limiting it to one price-point company. Companies with multiple co-dependent products cannot use this analysis to price their products.
A margin of safety is the difference between the actual sales of a company and its break-even sales. Managers use the margin of safety to determine how much the sales of a company can sustainably decrease before losses are realized. A 10% margin of safety is considered sustainable.
About This Article