Tracking blood pressure is a significant part of caring for one’s health. An individual can quickly identify patterns in their BP and find a way to manage it before it leads to serious health problems. Hypertension can cause irreversible damage and health issues such as stroke, kidney failure, and heart attack.
Individuals can also help their healthcare providers determine if the treatment they are receiving is effective or should be altered. In addition, healthcare providers will easily identify BP trends and patterns over time and advise patients on what they should do to stay healthy, such as taking medication or changing their lifestyles.
Some people can identify the rise in their blood pressure, but most high BP is asymptomatic. That means it is necessary to find a way to keep track of one’s BP to manage it. Using a log sheet is the best way to measure and record it regularly and actively participate in making informed decisions about your health.
In this article, you will learn more about a log sheet, its benefits, key elements, and how to use it. Free printable templates have also been provided to easily create these log sheets meant to record your BP readings.
What is a Blood Pressure Log Sheet?
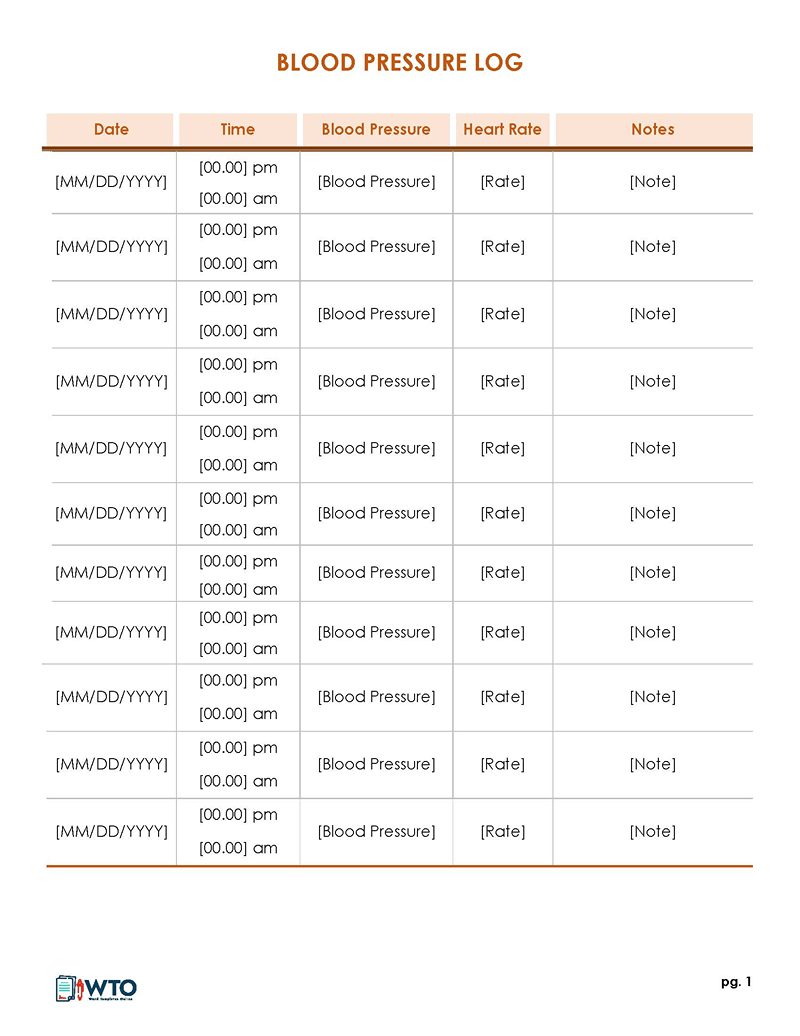
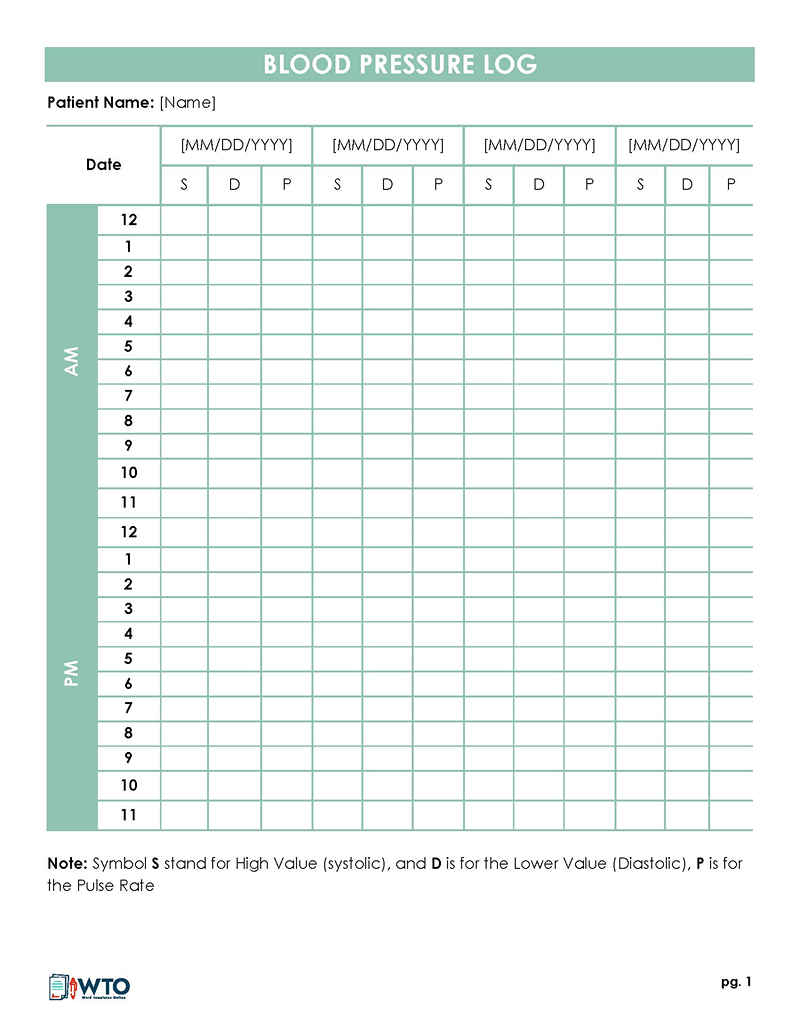
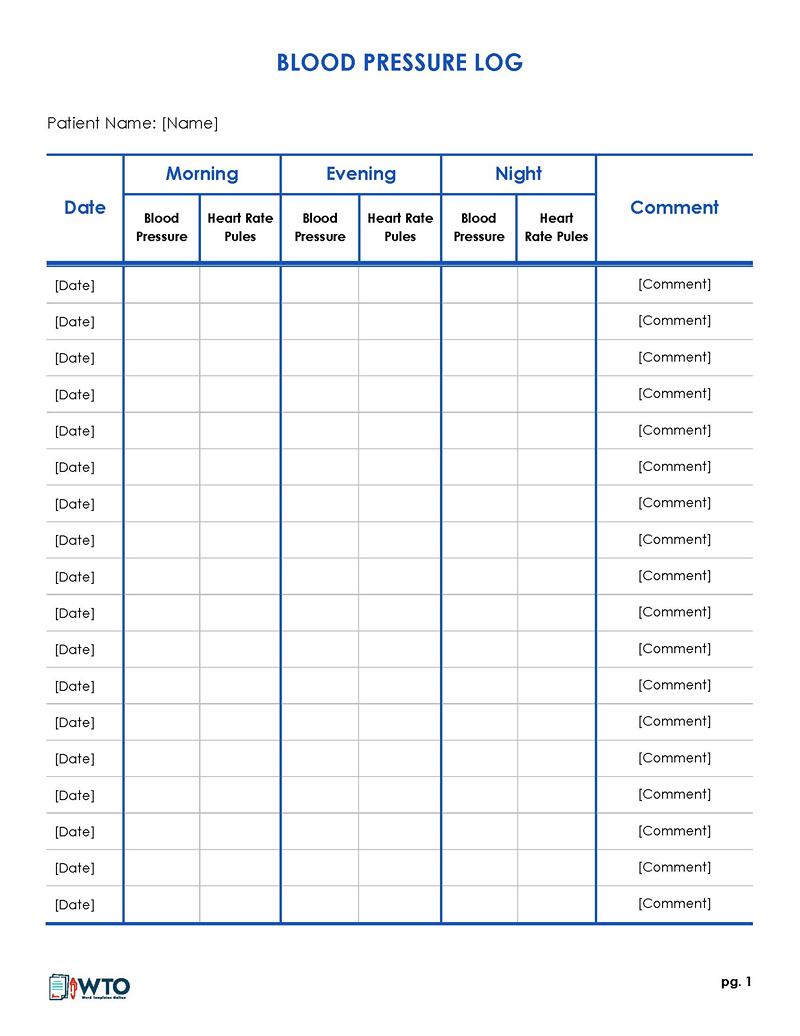
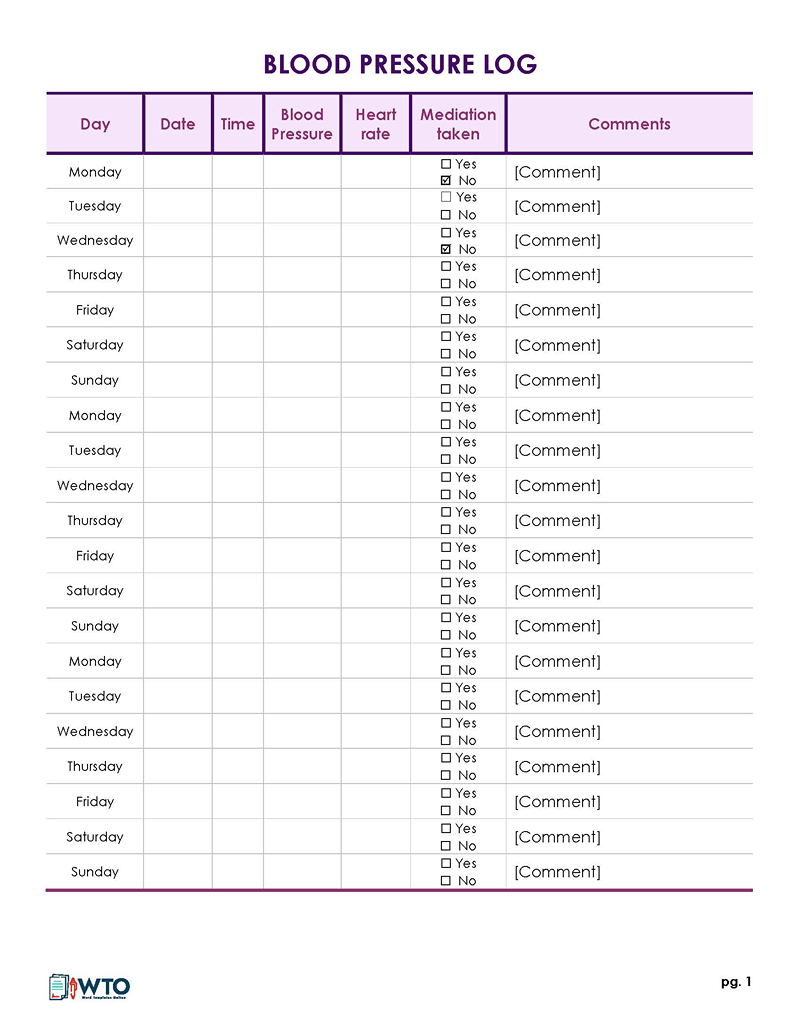
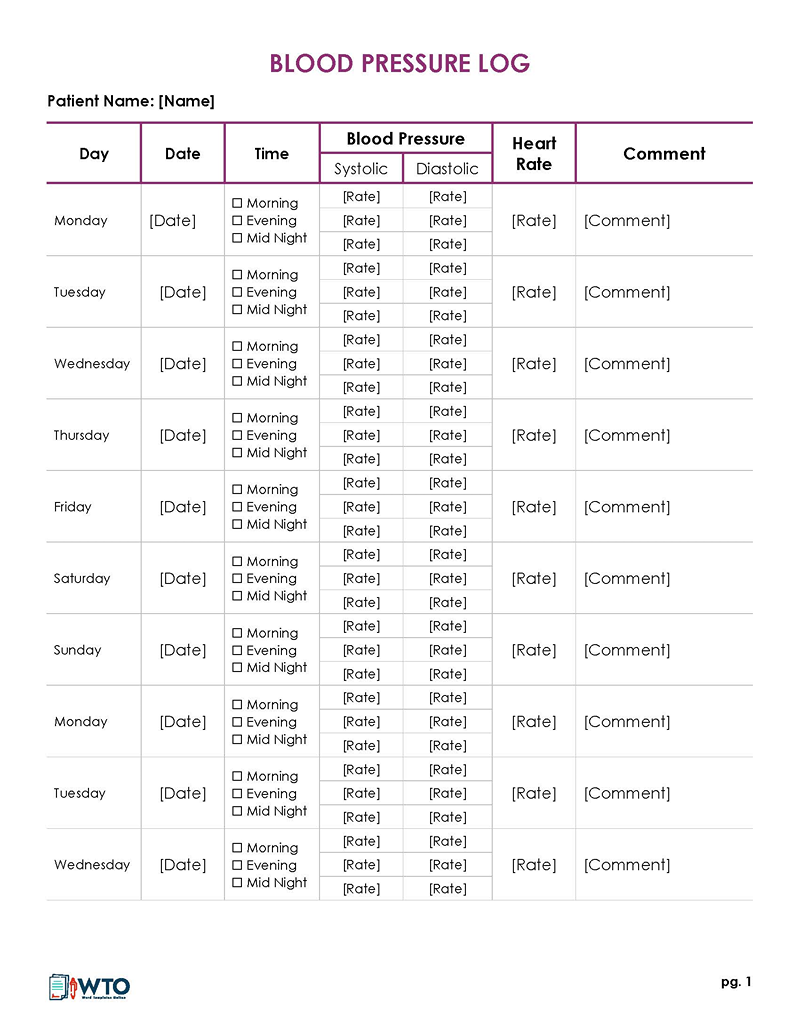
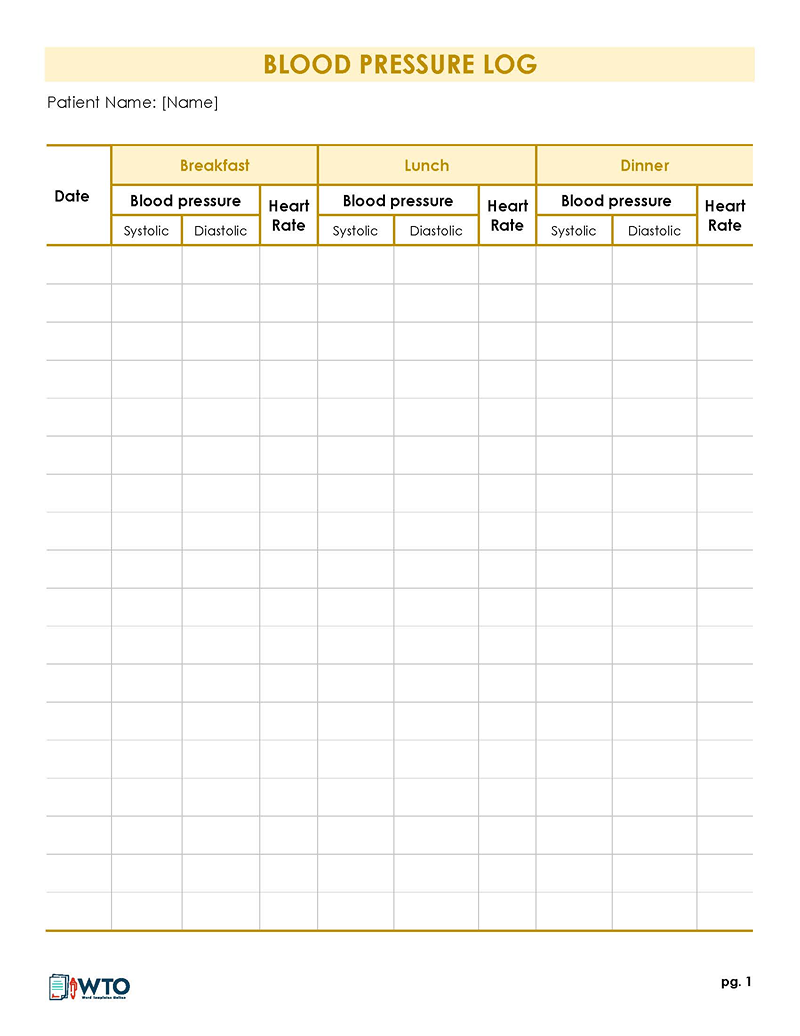
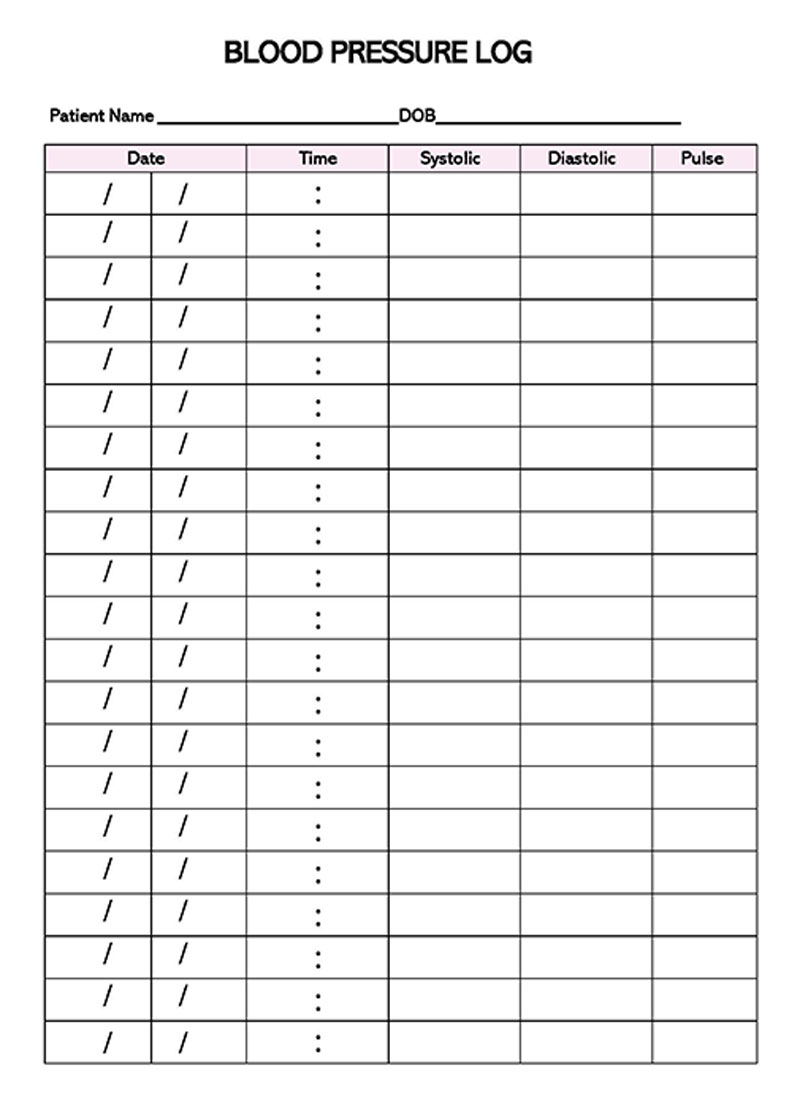
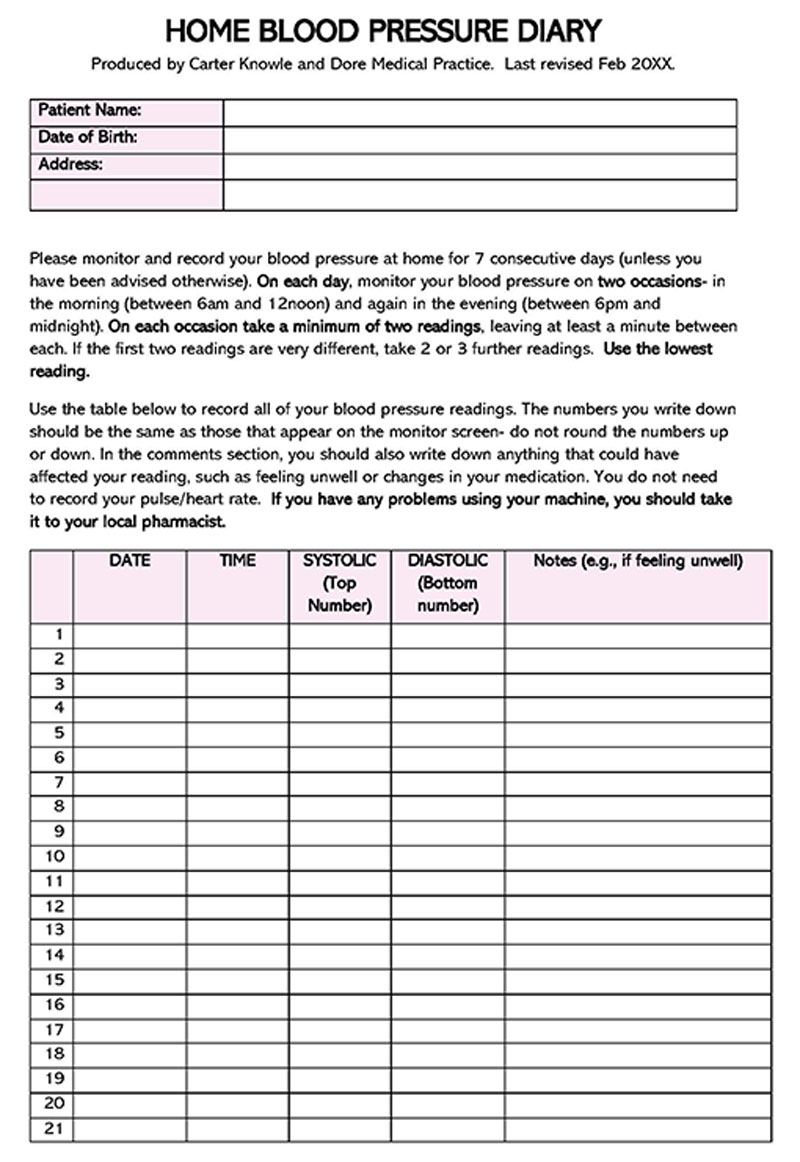
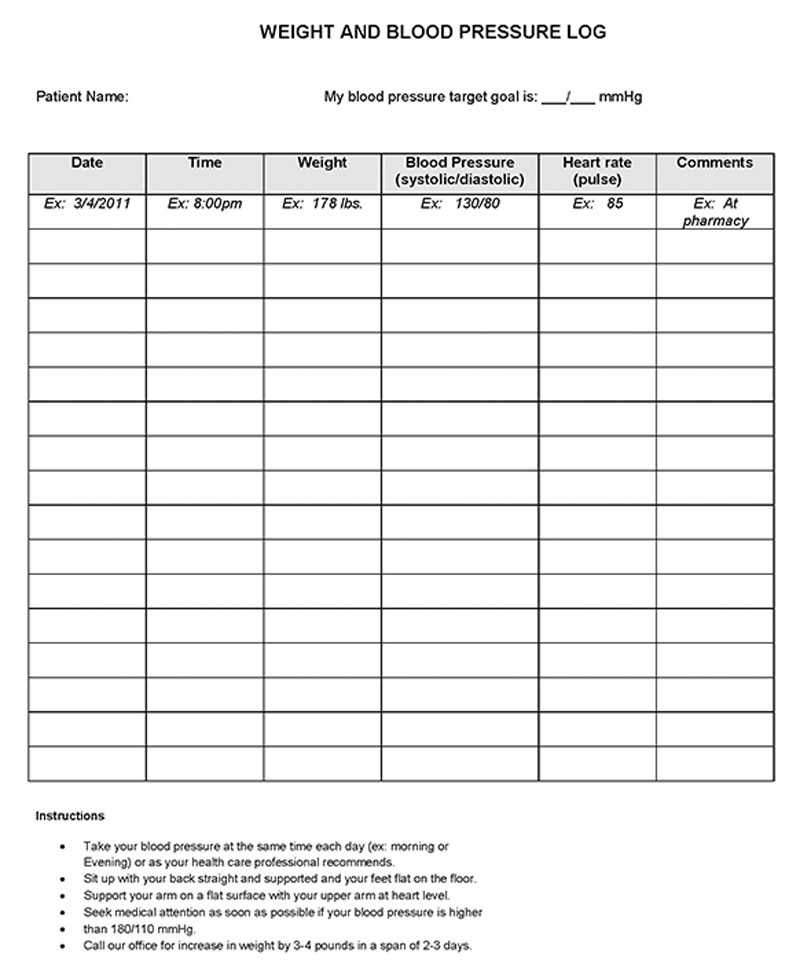
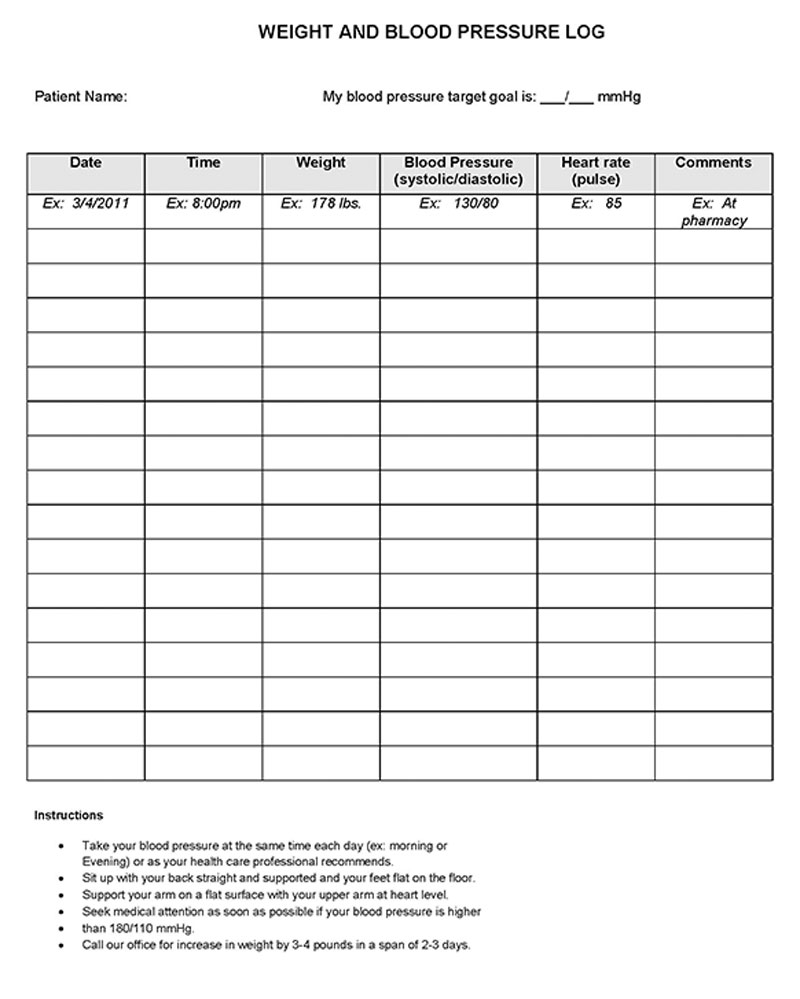
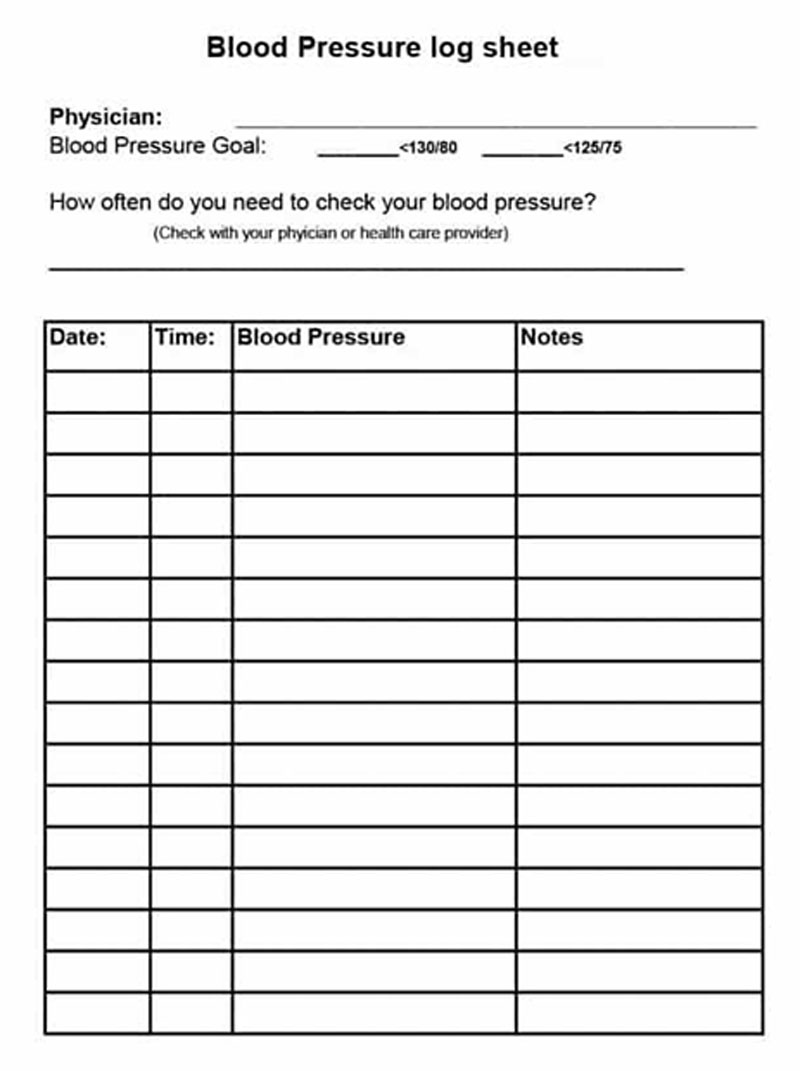
This log sheet is used to track and record blood pressure readings. Individuals can use a log sheet to monitor their BP at home. By using a log sheet, individuals can manage their health conditions better.
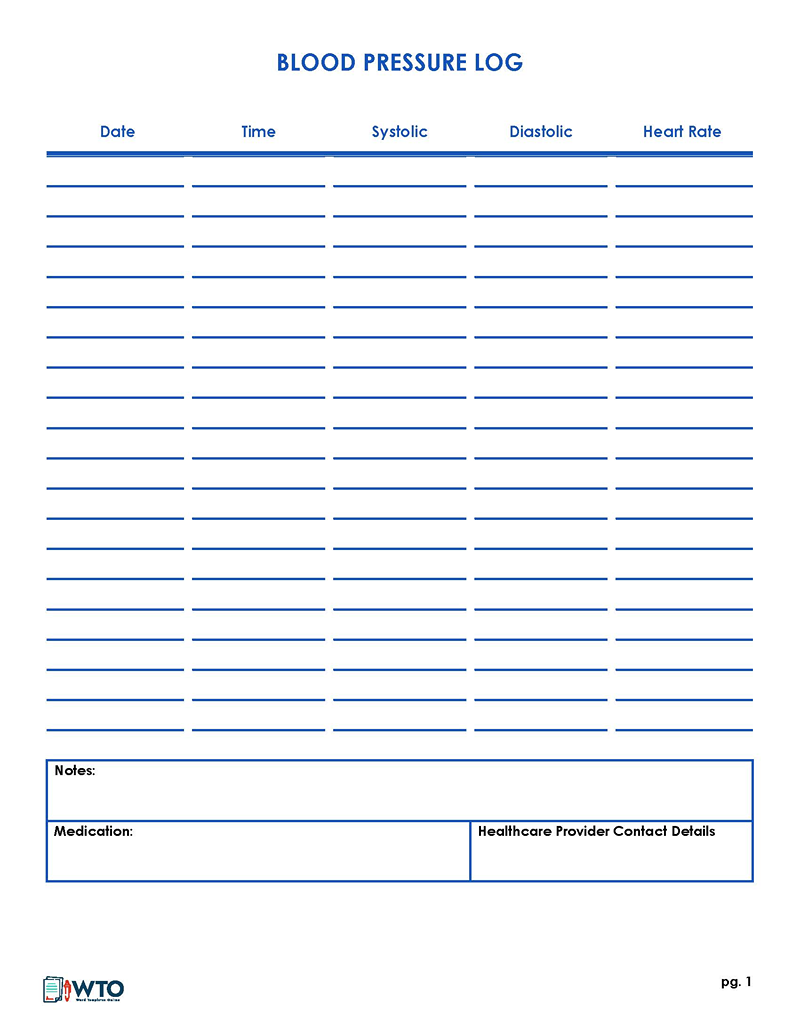
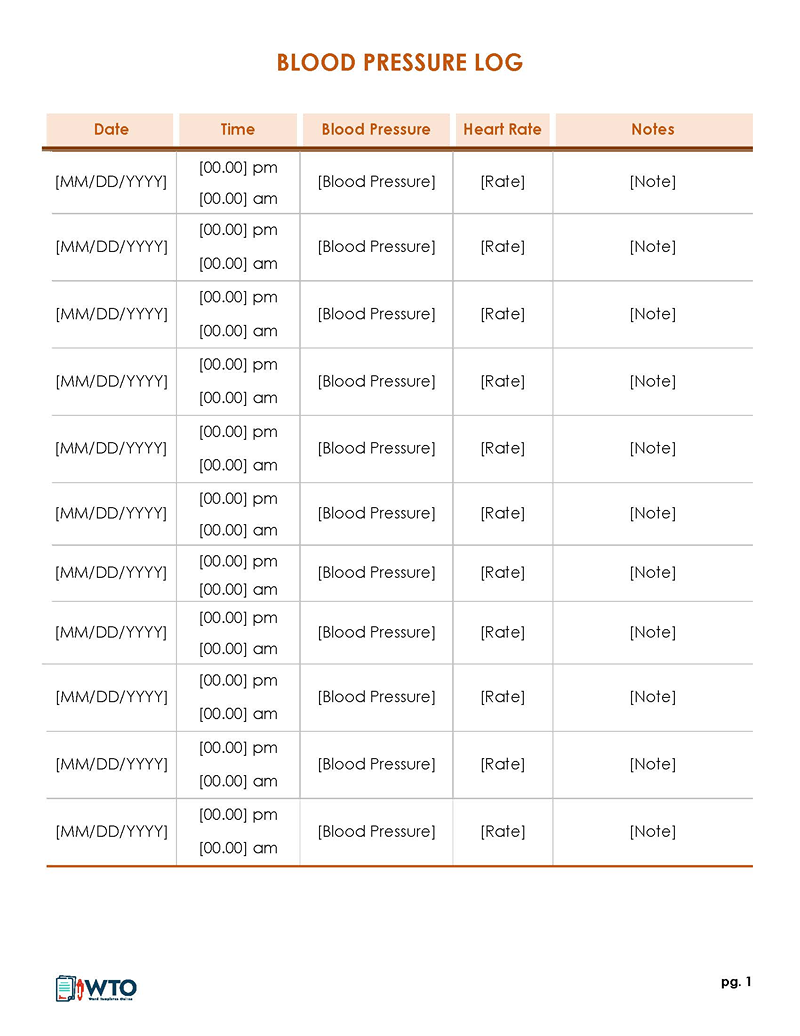
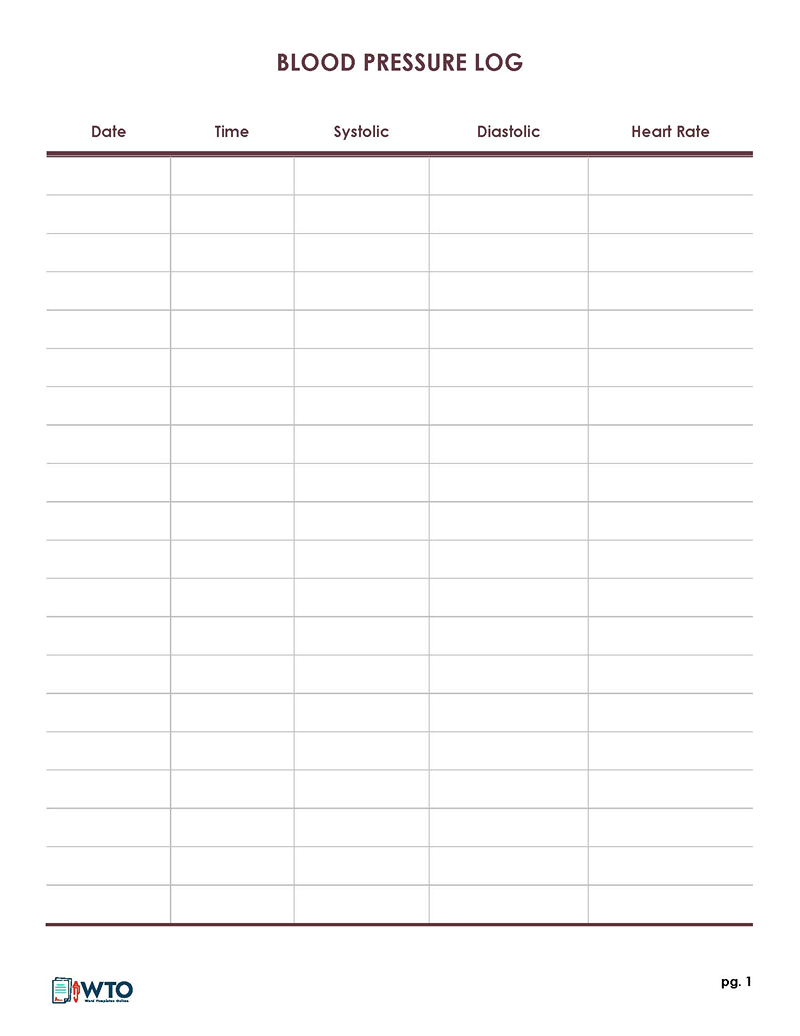
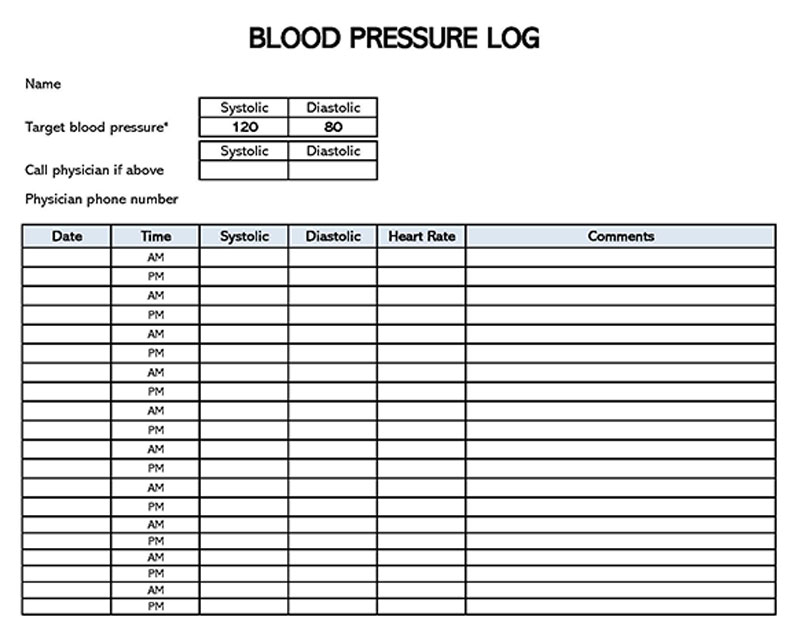
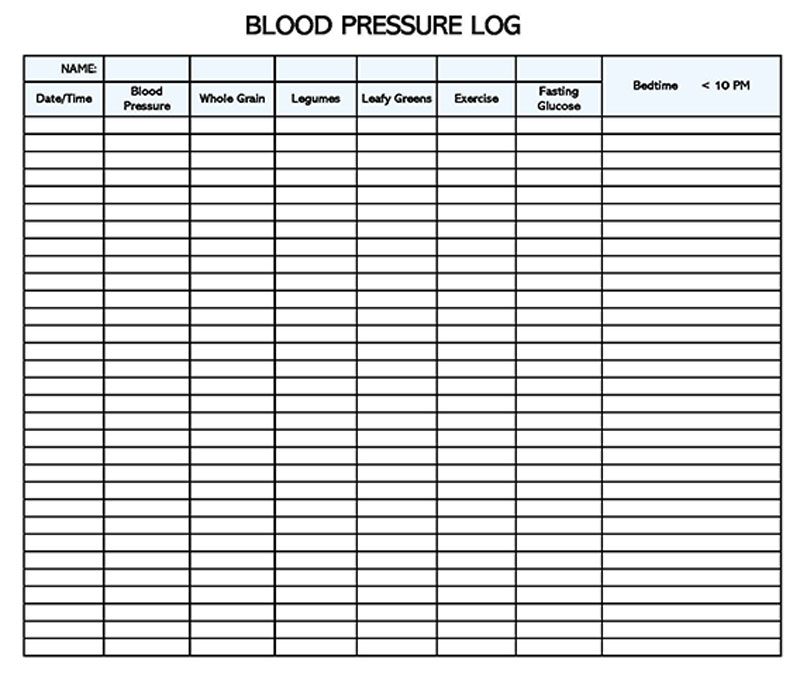
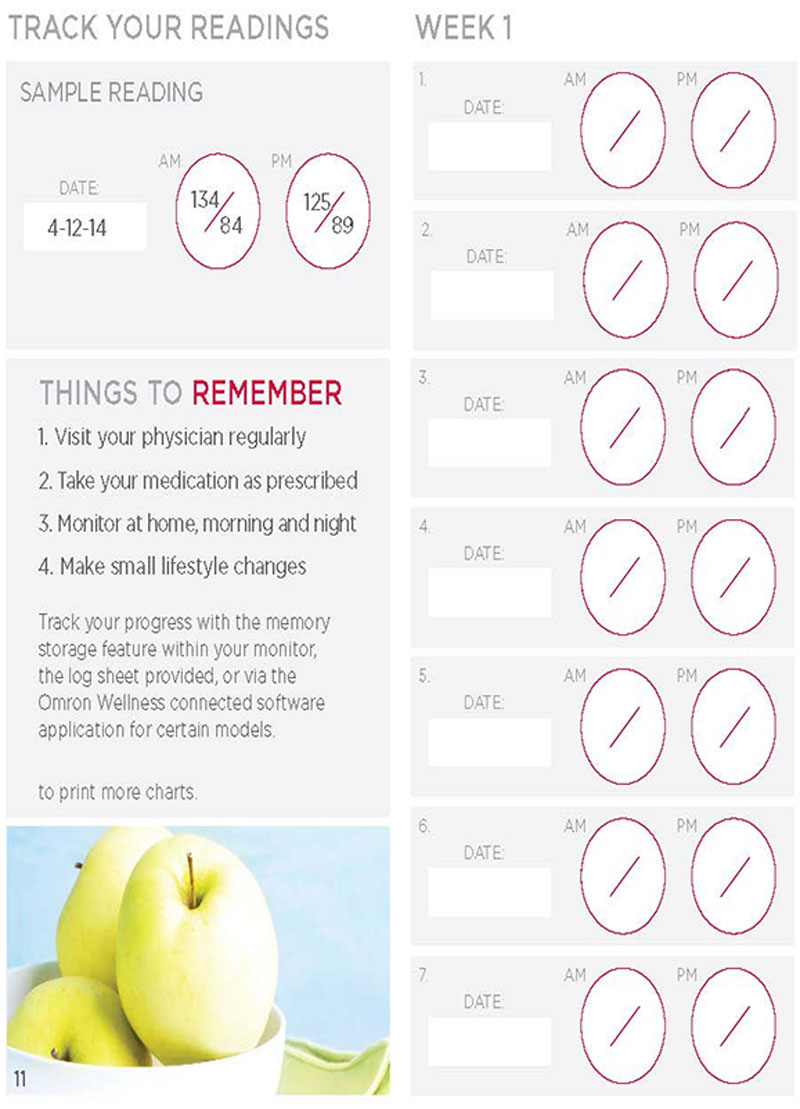
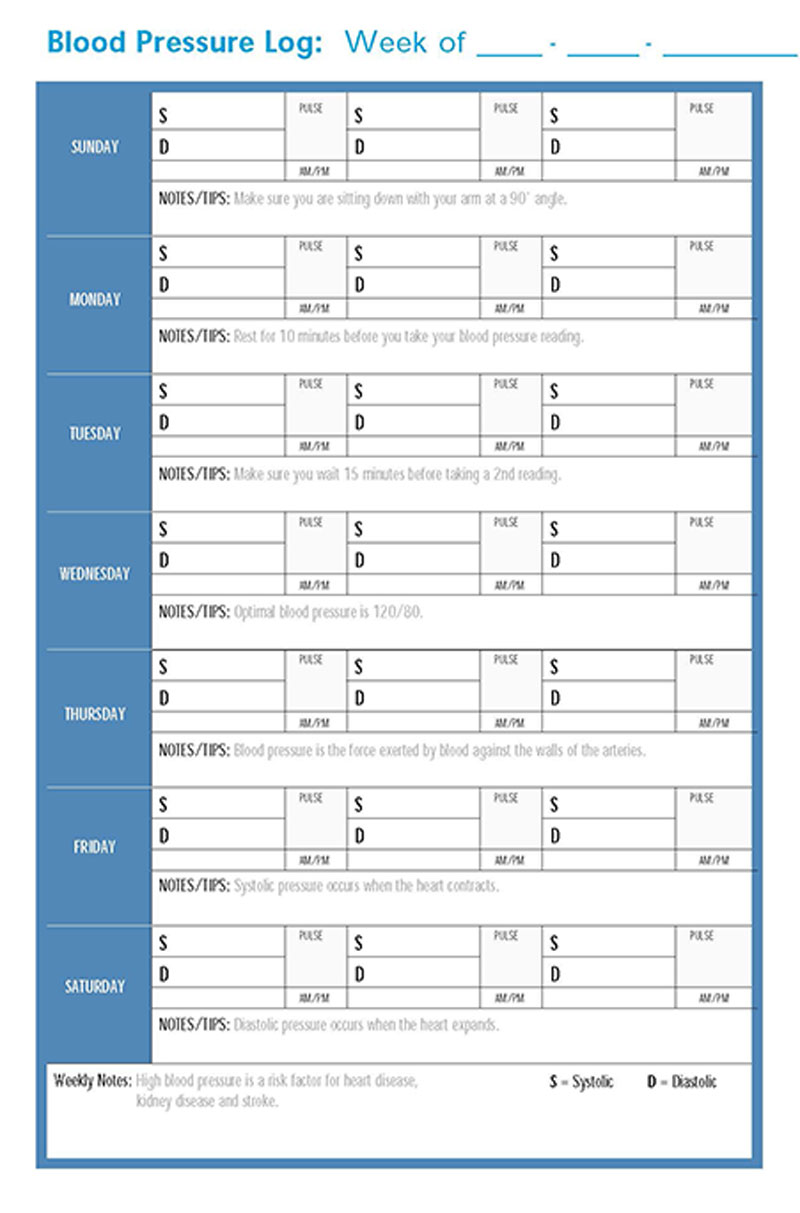
Free log sheets are readily available and have preset time intervals, reminding you to take and record your readings at specific times. It has placeholders to enter the date, time of day, and both systolic and diastolic BP readings. Additionally, you can include notes about your condition or medication on it as well.
Free Templates
Benefits of Using a Blood Pressure Log Sheet
Hypertension is a serious condition that needs to be monitored and managed properly to avoid health issues like a heart attack, kidney failure, or even stroke. To do this, you need a chart to record your readings regularly, which has several benefits as listed below:
Helps you track your blood pressure over time
BP charts allow you to track your BP measurements over time, so you can see patterns and changes that may require medical attention. This is useful to immediately address any medical emergency.
Improved health management
A log sheet encourages you to take responsibility for your actions in terms of adopting a healthy lifestyle that lowers your chances of developing complications. Regular monitoring can also motivate you to make healthy lifestyle changes, such as exercising more, eating a healthy diet, and quitting smoking, all of which can help improve your BP and overall health.
Improved medication management
By recording your BP readings in a chart, you can keep track of your medication usage and monitor the effectiveness of your current medications. This can help you and your doctor make informed decisions about adjusting your medications or dosages, if necessary.
If you are a traveler or have multiple healthcare providers, having a log sheet means you can easily share your BP readings with them. It will ensure that they have access to the same information. Also, if you are a patient with a complex medical history or are receiving treatment from various specialists, maintaining a record of regular BP readings is crucial.
Early detection of health problems
Monitoring BP regularly makes it much easier to identify trends, patterns, and changes. This means that a healthcare provider with access to this information can easily and quickly identify individuals at risk of developing hypertension, heart disease, or other cardiovascular conditions and intervene early to prevent them.
Helps you avoid white coat syndrome
White coat syndrome, also known as white coat hypertension, is an unexplainable medical occurrence that causes an individual’s BPreadings to appear to be higher than normal when taken in a medical environment, such as the doctor’s office. By monitoring BPregularly at home and keeping a record of the readings, one can determine if they have white coat syndrome and take steps to manage it.
Key Elements of a Blood Pressure Log Sheet
The following key elements should be present in a log sheet for accurately measuring and recording readings:
Date and time
The date and time of each reading must be accurately recorded to maintain accurate records. This will help you get the correct medical help when needed. It also helps you and your healthcare providers correctly identify your BP patterns and trends.
Blood pressure readings (systolic and diastolic)
The next element of a log sheet is the BP reading itself. In this section, you can record the actual readings, which include the systolic and diastolic readings. The systolic reading measures pressure in your blood vessels when your heart beats, while the diastolic reading measures pressure in your blood vessels when your heart rests between beats.
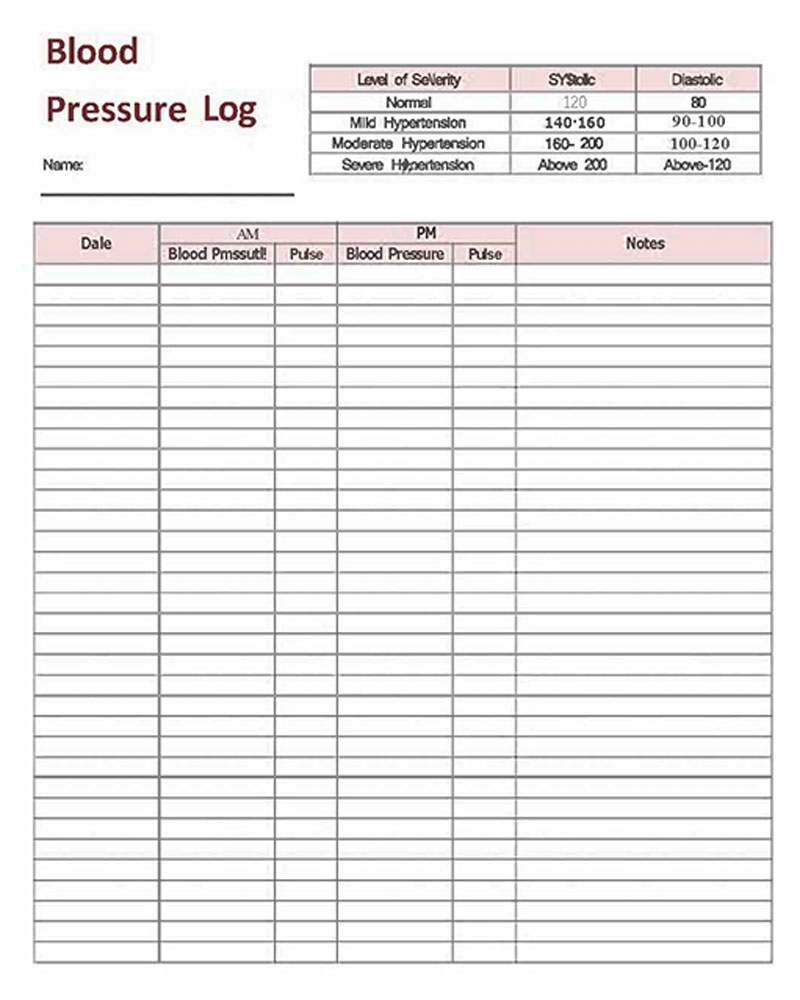
Although these readings vary depending on your age, gender, and other health or environmental factors, the systolic reading should be 115 and the diastolic reading should be 75. Pre-hypertension is identified by a systolic range of 120-139 and a diastolic range of 80-89. Hypertension stage-1 is characterized by a systolic range of 140-159 and a diastolic range of 90-99. On the other hand, hypertension stage-2 is identified by a systolic range of 160 or over and a diastolic range of 100 or over.
Heart rate or pulse
Pulse readings are often included in BP logs because they can provide additional information about cardiovascular health. A high or irregular pulse rate can be a sign of an underlying health issue, such as arrhythmia or heart disease. By tracking pulse readings along with BP readings, individuals can get a more comprehensive picture of their overall cardiovascular health and identify potential issues early on.
Additionally, some medications used to manage high BP can also affect pulse rate, so tracking both measurements can help individuals and their healthcare providers make informed decisions about medication management.
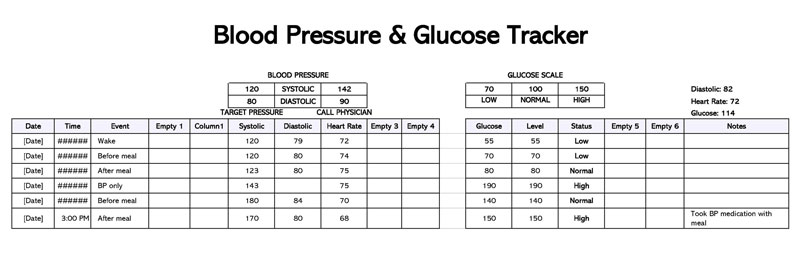
Medication
Noting down the medication you are taking in your log can help you and your healthcare provider monitor the effectiveness of the medication in controlling your BP. It can also help identify any potential side effects of the medication that may be impacting your readings. In addition, by keeping track of your medication usage, you can ensure that you are taking your medication consistently and on schedule, which is essential for managing hypertension.
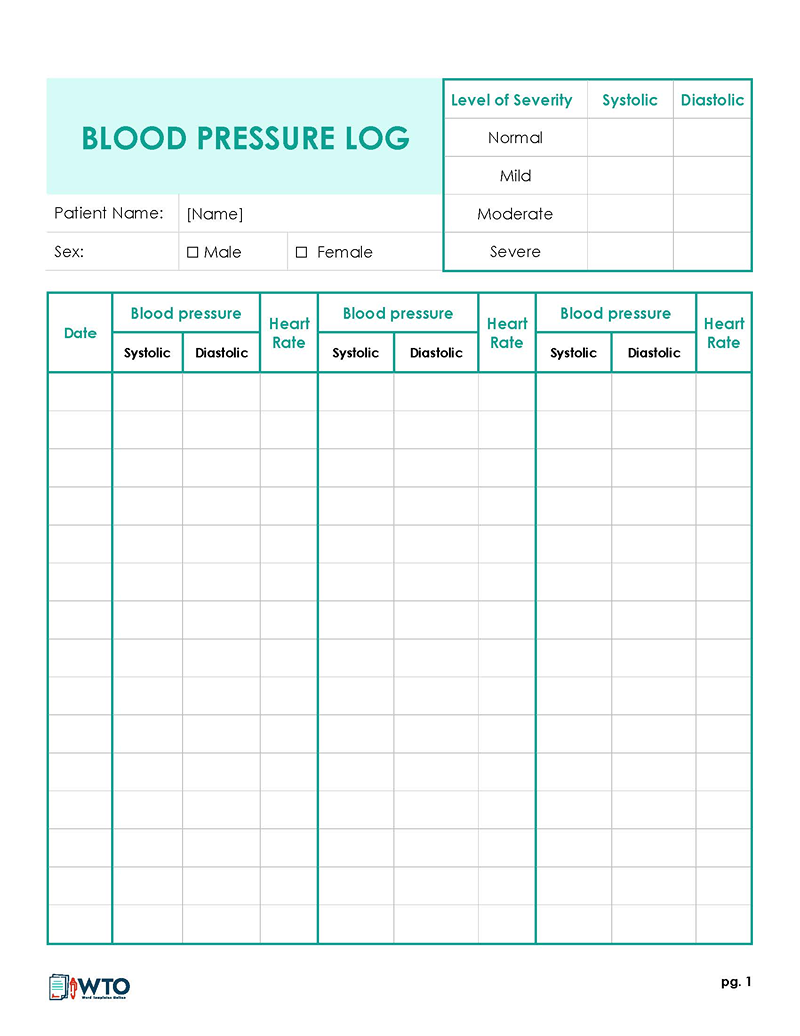
Overall assessment
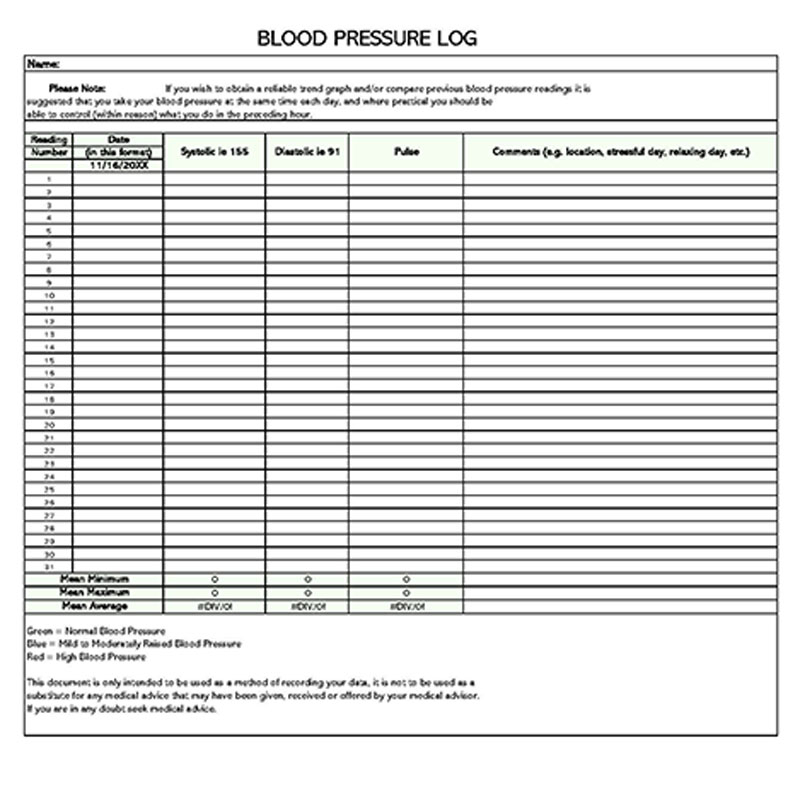
For this section of the log sheet, try to specify if your BP is within a healthy range or if you need to consult your healthcare provider. This will be based on your systolic and diastolic readings, along with your heart rate. If there are any deviations from the acceptable pressure range, recording this information will allow your healthcare providers to determine the underlying factor.
The log sheet should also include a comments section where you can include extra information regarding your specific BP readings. This section allows you to report any abnormalities with the home monitoring kit or health problems that you might be experiencing.
Additional components
Finally, there are some additional components you can include in a log sheet for recording BP readings:
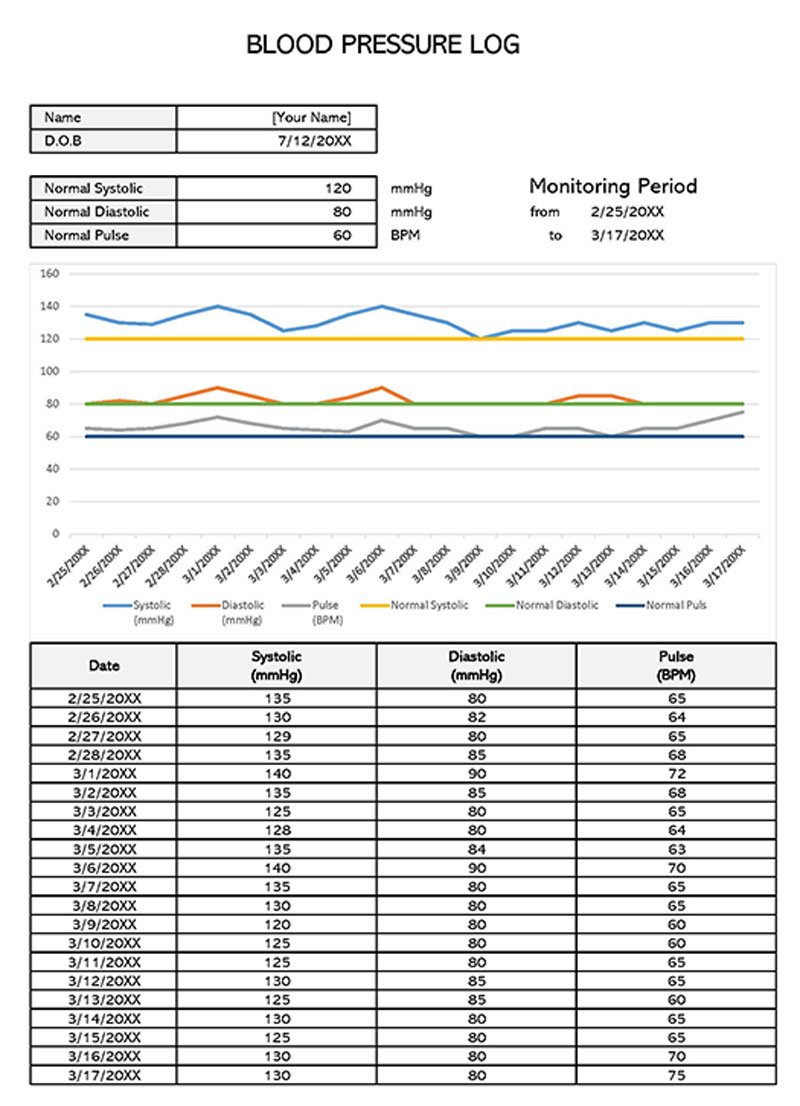
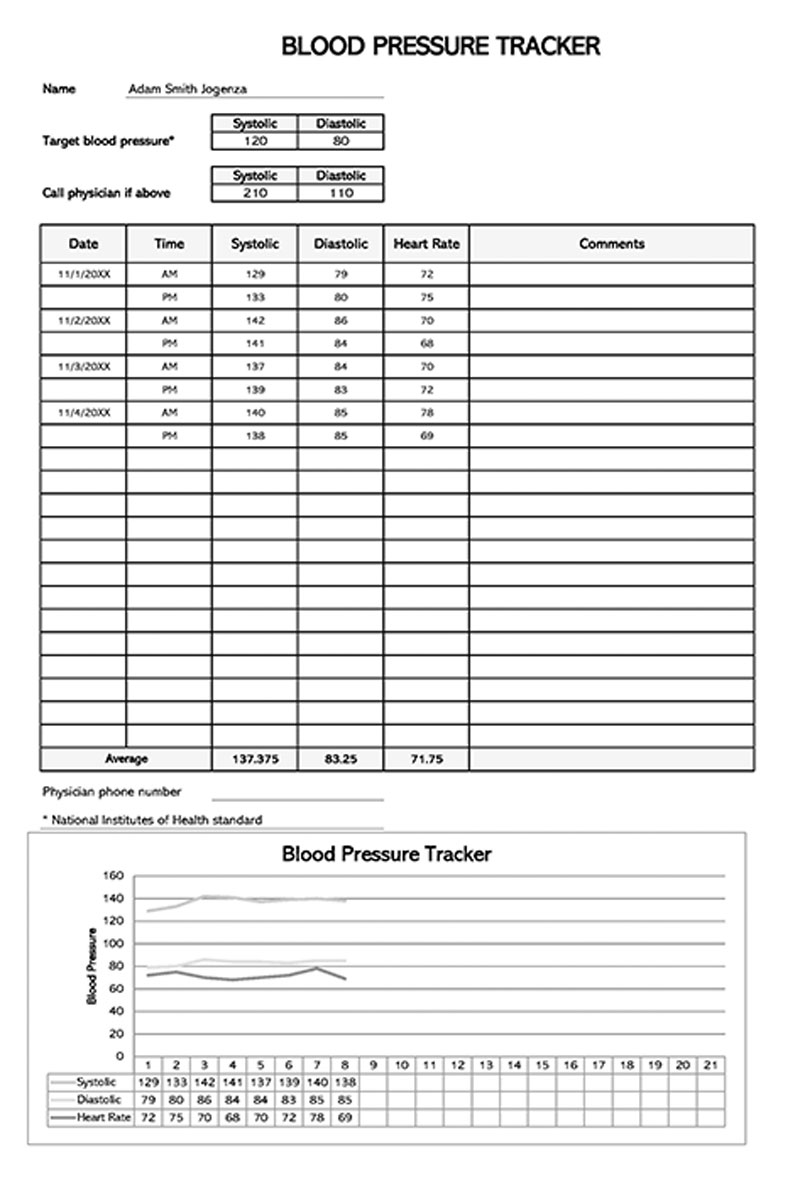
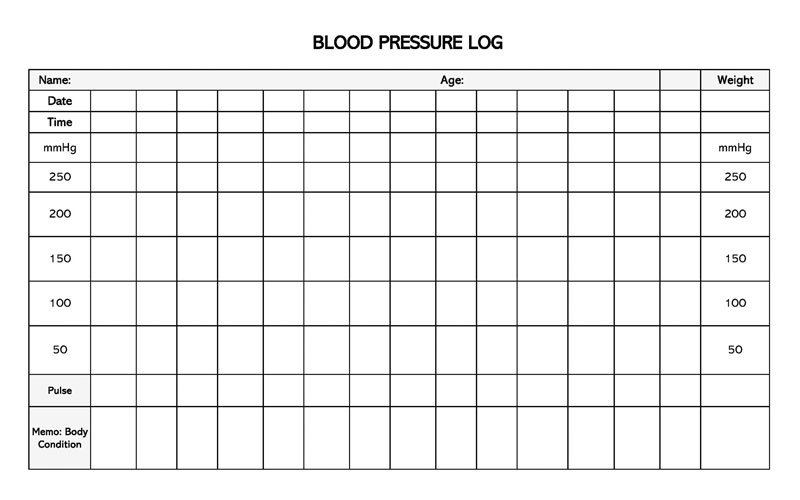
- Trend chart or graph: For this section, you should mention details about when your BP rises, peaks, and starts to drop in the form of a chart or graph. You can also include the factors that contribute to these patterns and how they vary daily.
- Goal setting: You can include your health goals meant to help you maintain your BP within the required range. This may include exercise and diet goals.
- Reminders: Whether it is for medication or measuring your blood pressure, you can set reminders in your log to ensure you are always accurate and consistent.
- Healthcare provider contact information: If possible, include your healthcare provider’s name and contact details, such as a phone number, for emergencies.
- Symptoms tracker: Use this section of the log sheet to record any symptoms related to changes in BP to help your healthcare provider track their onset and effects on the BP readings.
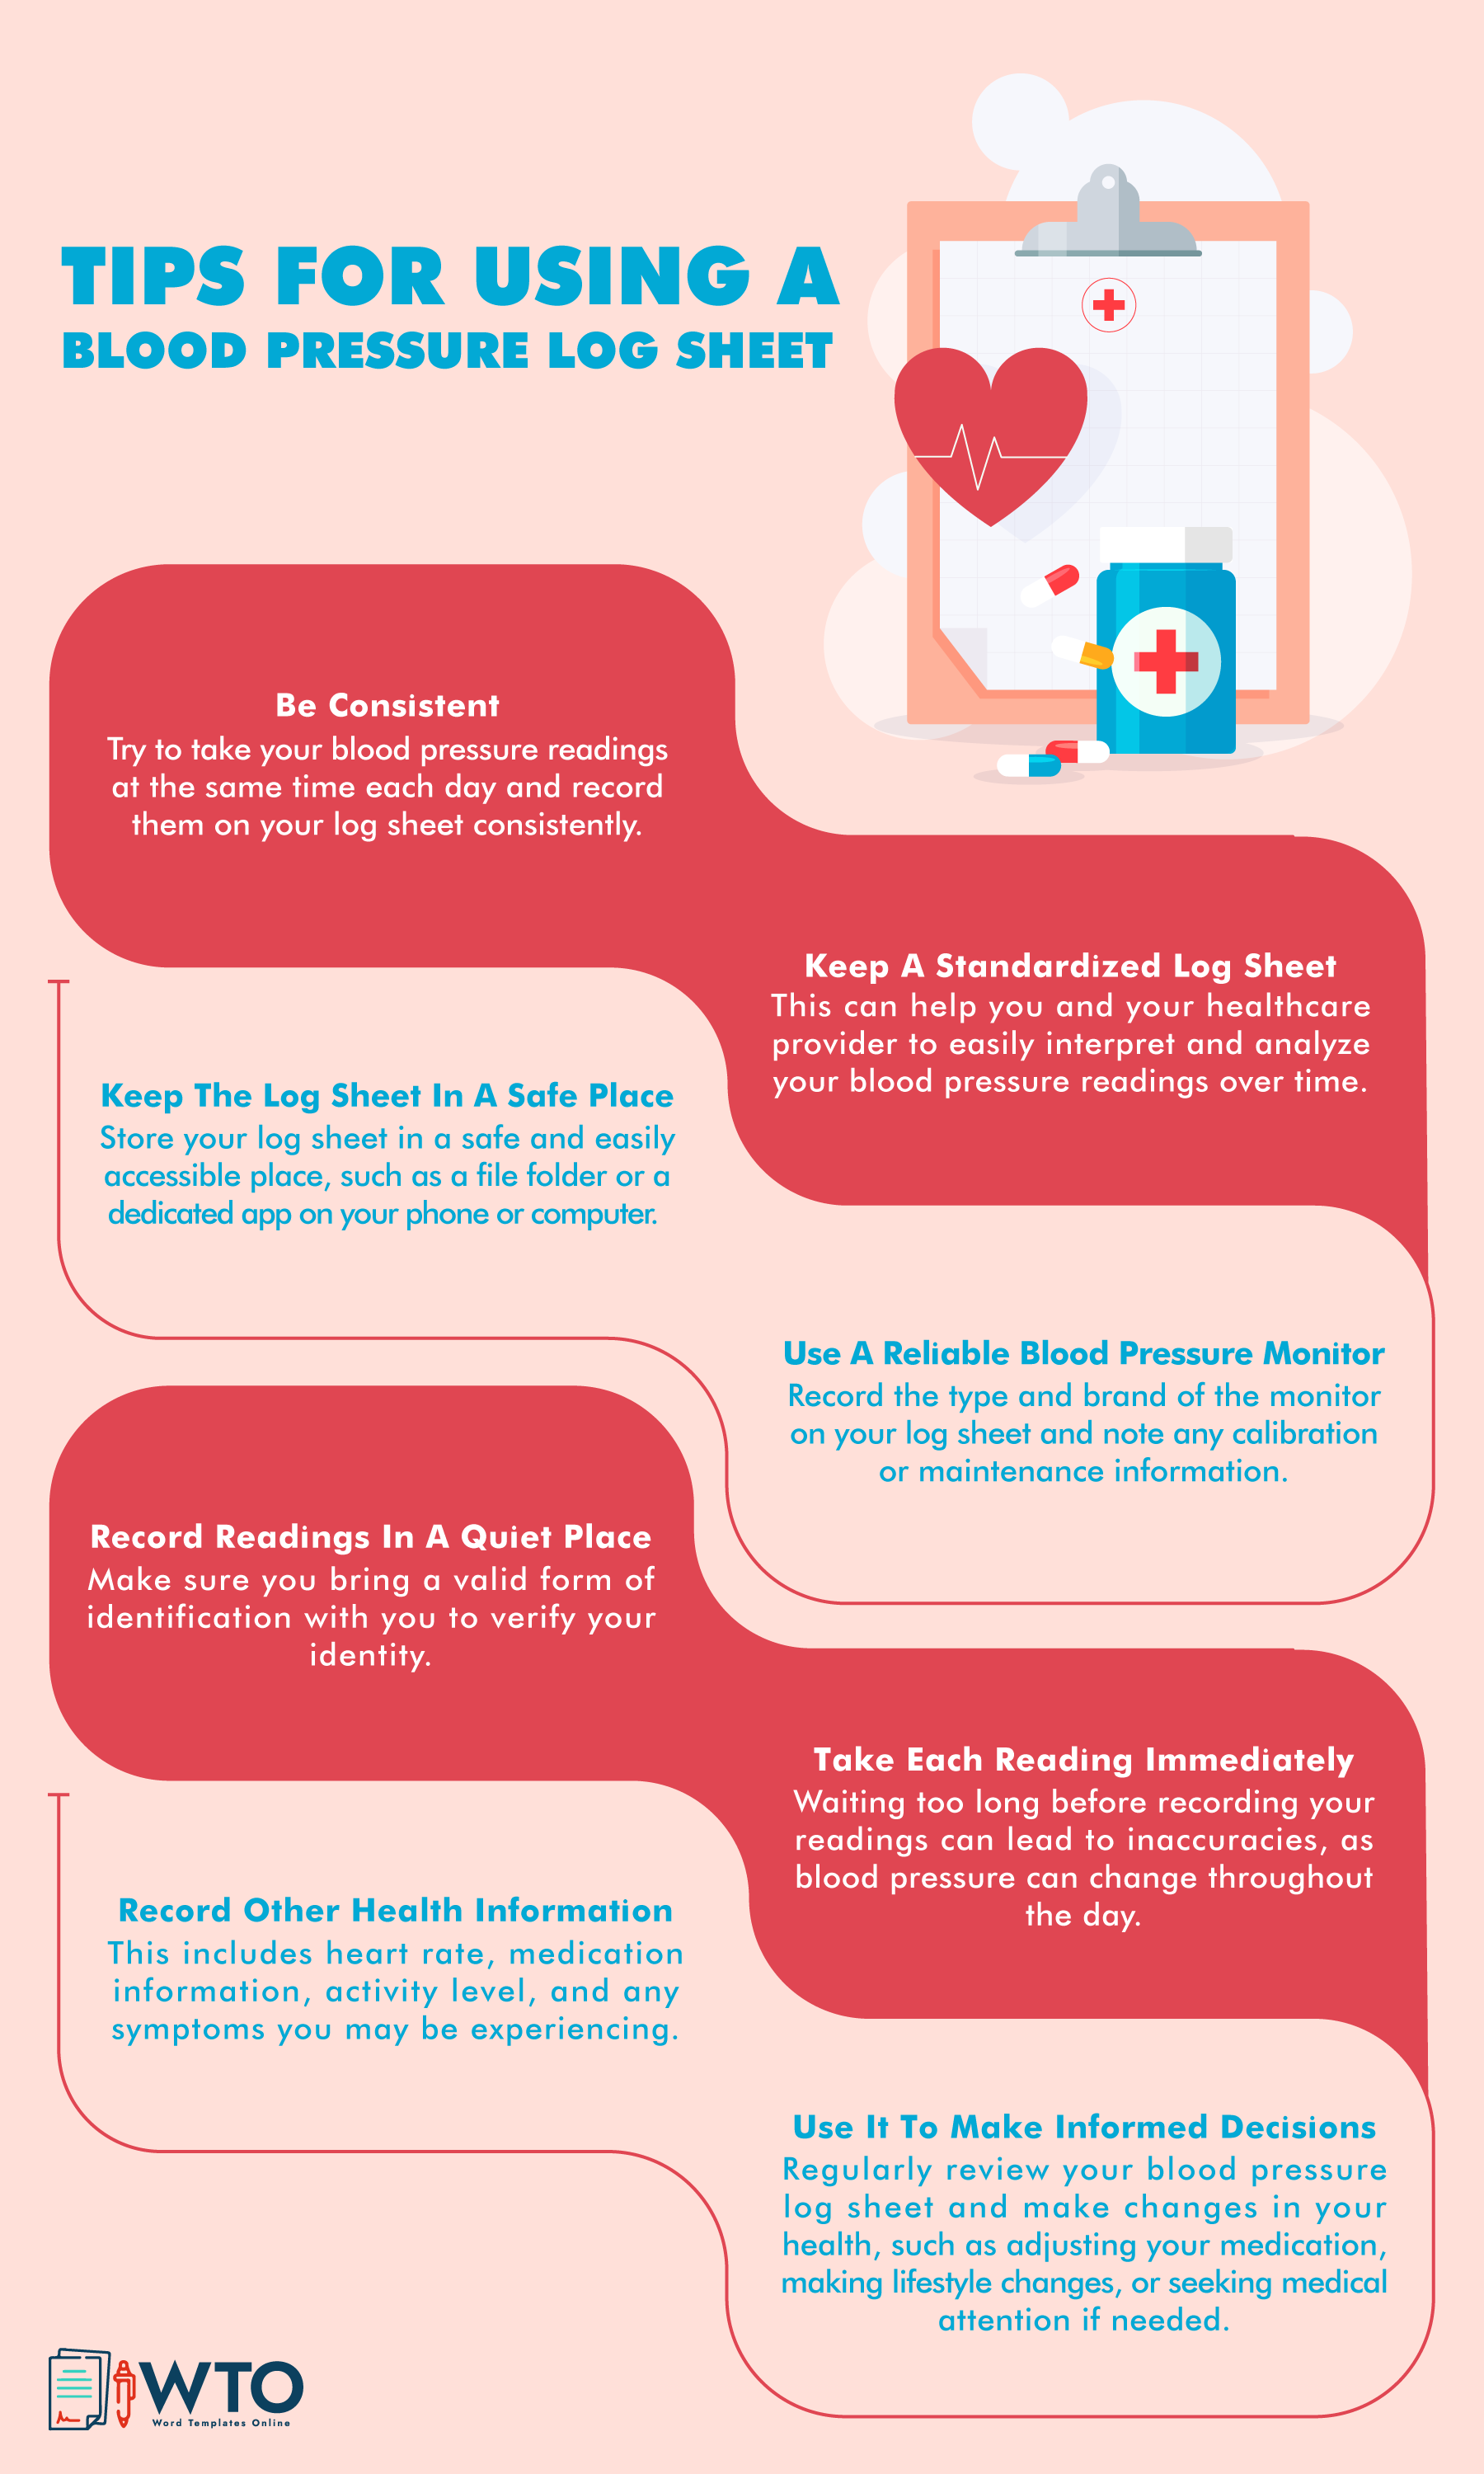
How to Use a Blood Pressure Log Sheet: Step-by-Step Guide
Since you know the key elements of a log sheet, you need to know how to use it to ensure that you record accurate readings.
Below is a step-by-step guide on how to use one:
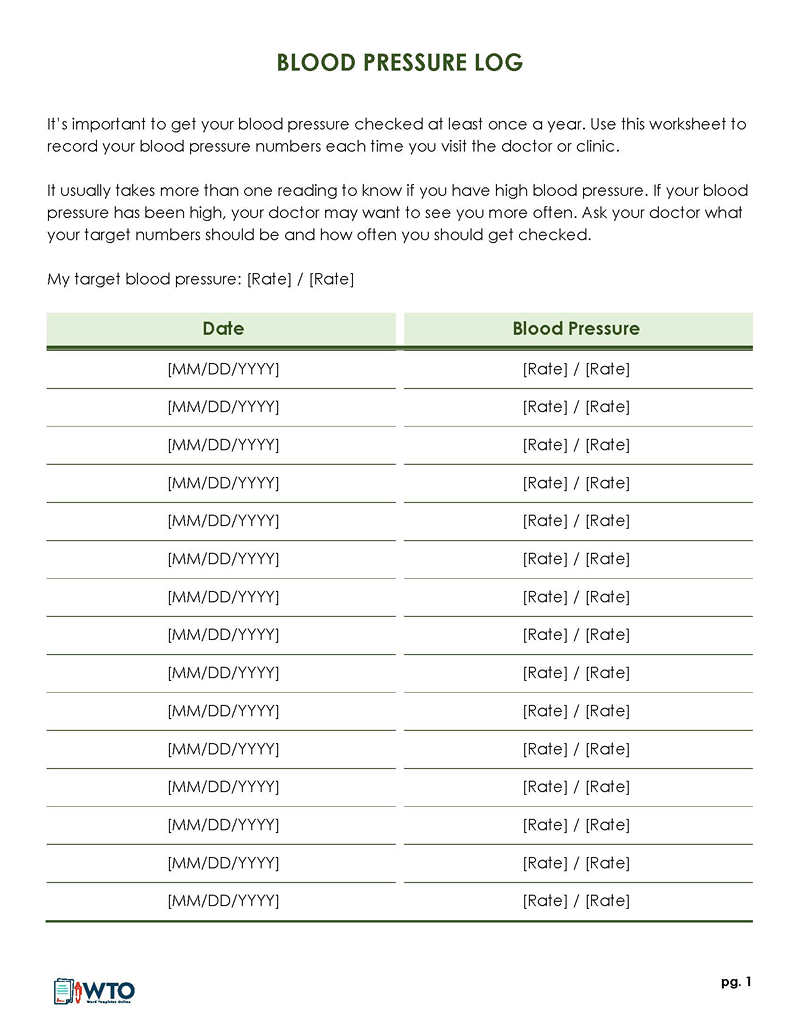
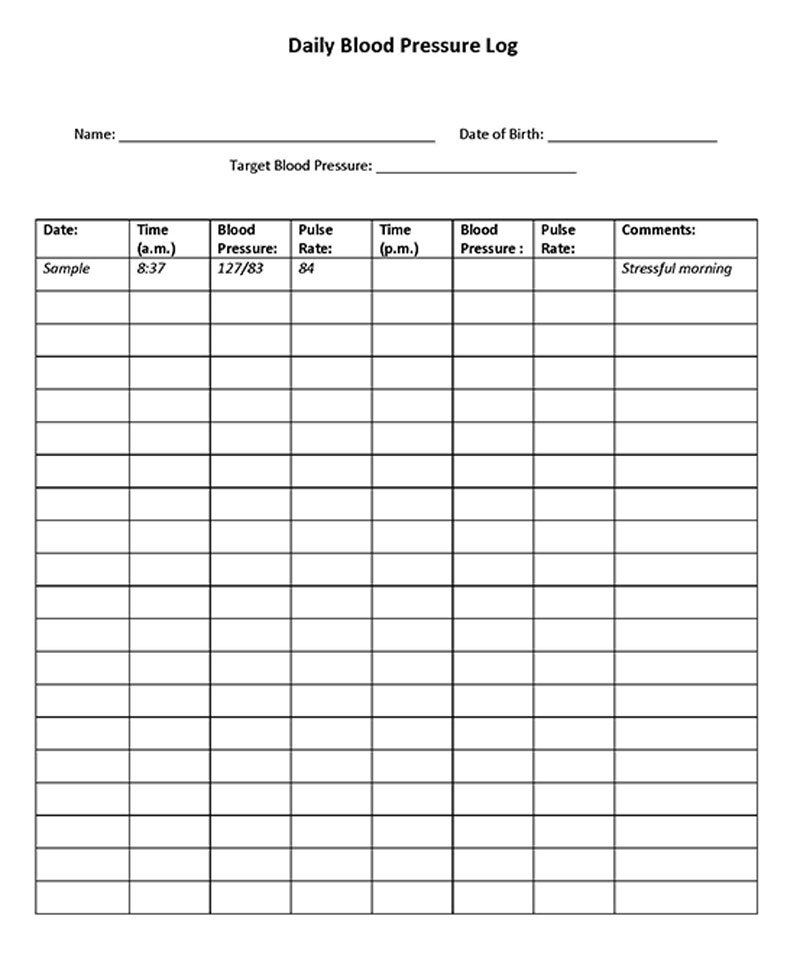
Step 1: Determine the target blood pressure
Determine your target BP first, as advised by your healthcare provider. Before measuring your blood pressure, you must record this information on your log sheet. The target BP will depend on your age and sex.
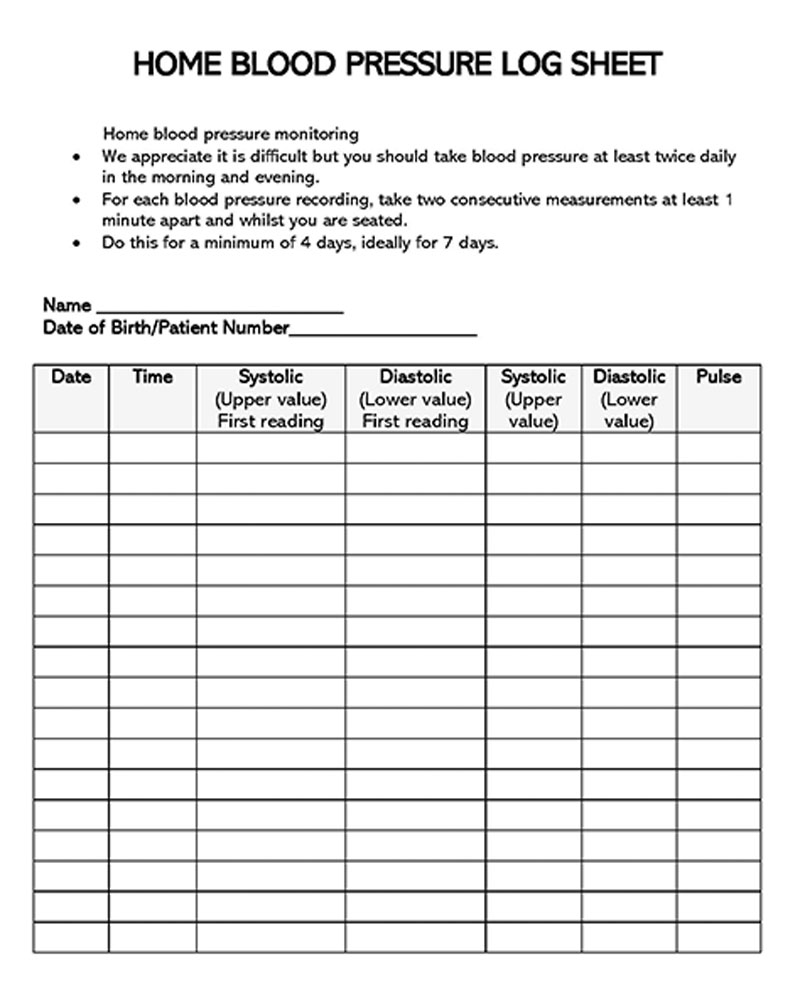
Step 2: Record the readings periodically
Proceed to take and record your readings on the log sheet at the same time daily for an accurate pattern. Use your monitor to take your readings. You should not eat, drink, or exercise for at least 30 minutes before measuring your blood pressure.
Start by entering the date and time, then your BP readings and pulse rate in the appropriate sections of your document. Make sure the information is legible and accurate.
Step 3: Record any medications
If you take any medication to manage your blood pressure, note down the name of the medication and the dosage.
Step 4: List any influencing elements
Use the space provided to add notes about any symptoms, lifestyle changes, or activities that may have affected your readings.
Step 5: Analyze the information
Analyze the information after recording your readings for at least one week. Focus on finding patterns and trends to identify any changes. This way, you can determine if your readings are within the desired range.
Step 5: Consult with your health provider
Finally, ensure you consult and share your results with your healthcare provider. Your doctors will use the information presented in your log sheet to adjust your medication, recommend treatment, or even advise you to change your lifestyle.
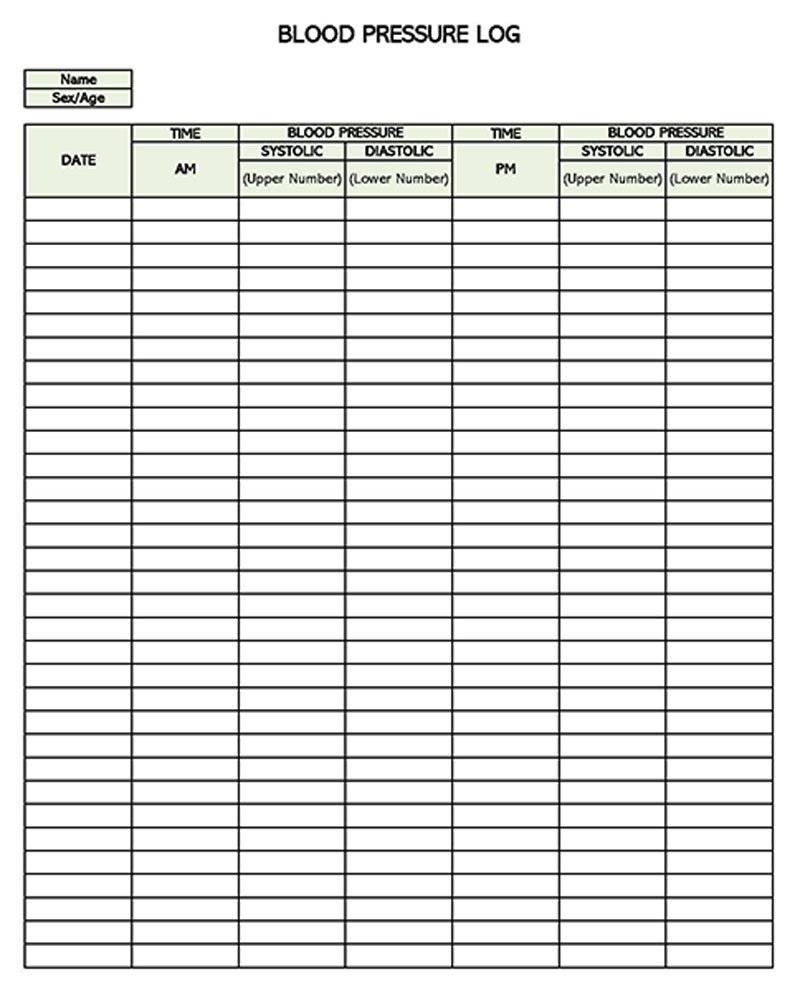
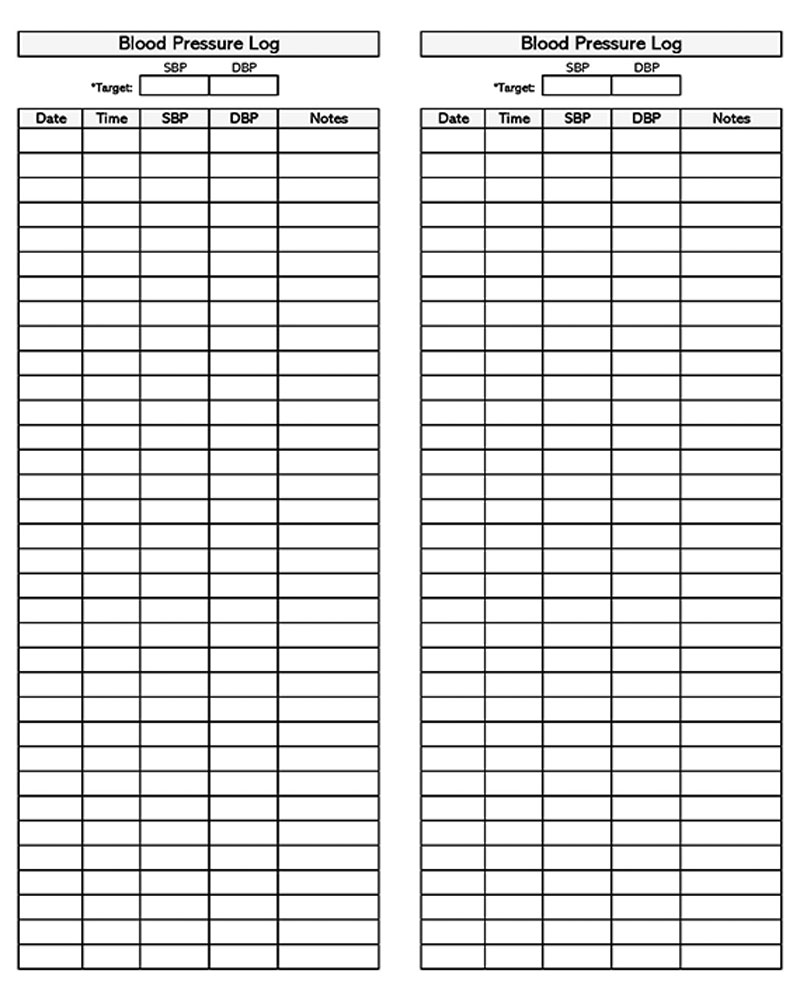
Free Log Sheets
What Does a Blood Pressure Reading Look Like?
The measurement and interpretation of the readings from a home monitor will ordinarily require some guidance from the doctor.
However, anyone self-monitoring their BP should be aware of the following points:
Numbers on the monitor
Every monitor uses numbers to calibrate blood pressure. The numbers represent different elements needed to measure BP accurately.
These numbers include:
- Systolic blood pressure: The first digit on display is considered systolic blood pressure. It measures the pressure in your arteries when your heart beats. It will be the top number in the reading.
- Diastolic blood pressure: The lower number is the diastolic blood pressure. It is the pressure in your arteries when it relaxes in between beats.
Blood pressure chart
The units of BP are millimeters of mercury (mmHg). These are the units in which systolic and diastolic blood pressures are measured on the monitor.
If the systolic blood pressure reading is 140 and the diastolic reading is 70, the reading would be written as 140/70 mmHg.
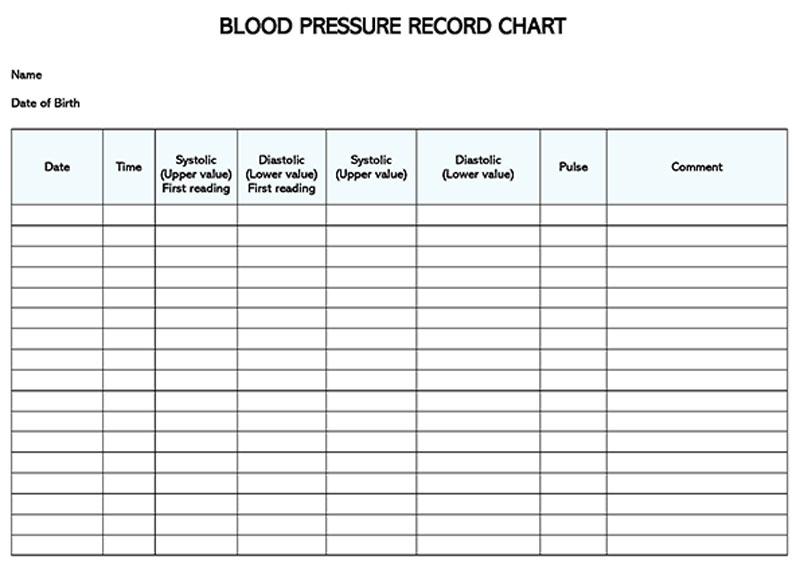
The readings should then be compared to a BP chart to determine the diagnosis and treatment required.
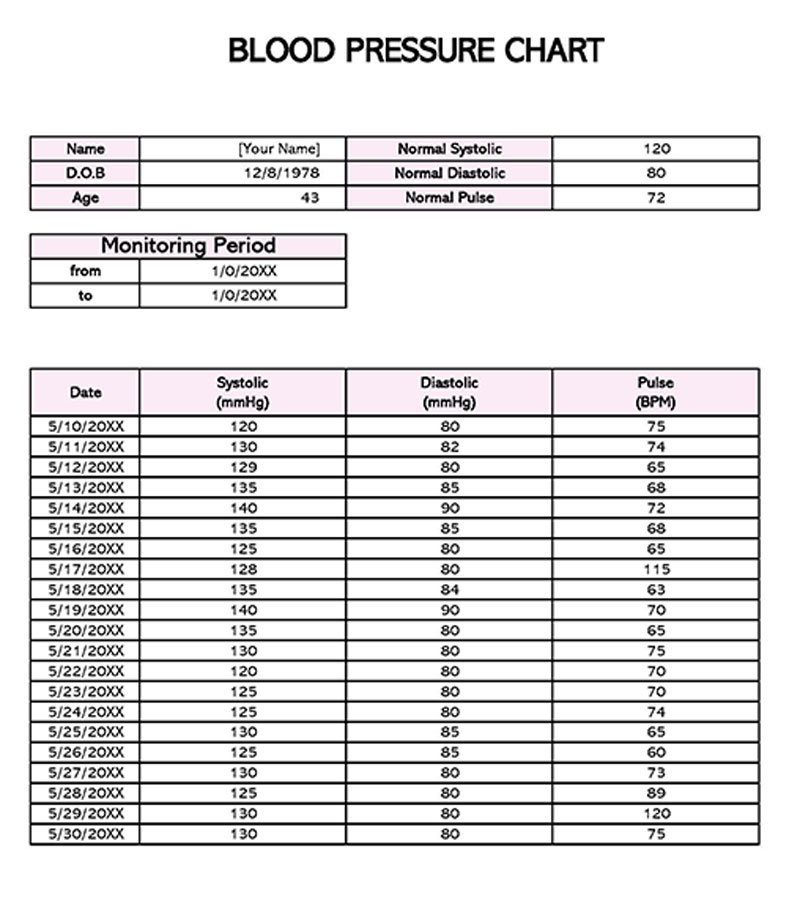
Below is a chart sample:
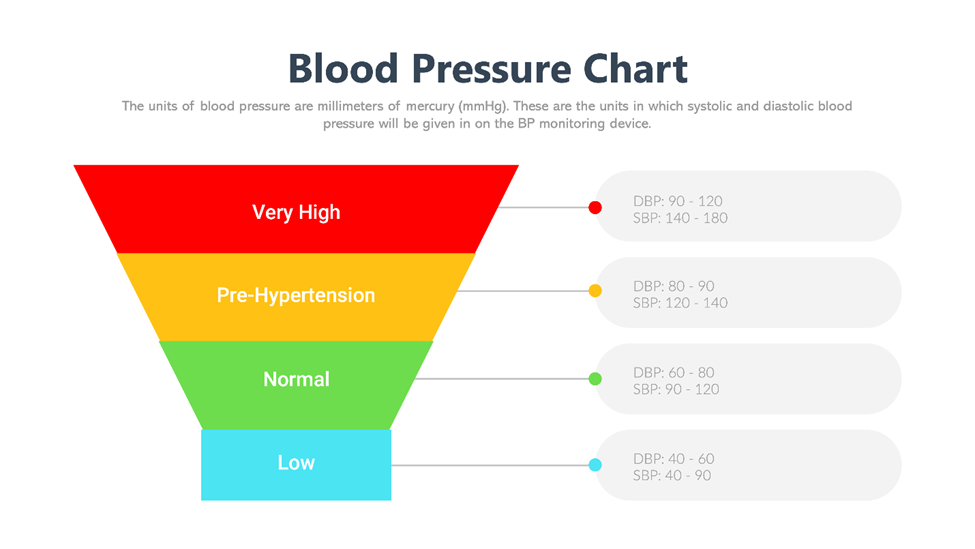
Readings interpretations
Interpreting the BP chart is necessary to determine what the readings mean. The chart will typically have four categories: low, normal blood pressure, pre-high blood pressure, and high blood pressure. The systolic blood pressure is written on the y-axis, while the diastolic is on the x-axis. Where the two readings intersect represents your BP at the time of measurement.
These categories of BP are defined as follows:
- A reading of 140/90 mmHg indicates the probability of high blood pressure. Any values above that indicate high blood pressure.
- Pre-high BP is defined with readings ranging between 120/80 mmHg and 140/90 mm Hg.
- Intersections give ideal blood pressure with systolic and diastolic readings ranging from 90/60 mmHg to 120/80 mmHg.
- Low BP is signified by readings of 90/60 mmHg and below.
Final Words
A log sheet is an important tool for people with hypertension. Hypertension is an asymptomatic condition, but when diagnosed early, it can be treated to prevent serious health complications or even death. Therefore, there is a need for regular monitoring at home.
Once you have taken your readings, you can record your results on the log sheet to analyze and share them with your healthcare provider. Using the information in this article, you can create a log sheet to record your bp readings or use our free printable templates to create one.
About This Article